Monitoring url endpoints with Grafana, Azure and more
After moving my blog to the Hugo platform hosted on Netlify I lost the uptime monitoring I had through Jetpack on Wordpress. I had Jetpack connected to my wordpress blog and got a service monitoring if my site was up or down. I would get an email if the site wasn't responding, but not more than that.
As I've worked quite a bit with Grafana I knew about their Worldping service, but I haven't had any real need to test it before now. Now I had the perfect reason for checking it out as well as look at some alternatives.
Grafana Worldping
I went over to my Grafana installation to check if the worldPing plugin was installed, but it does not ship by default. Luckily installing plugins in Grafana is easy. I headed over to the Grafana website and navigated to the plugins. There you'll find worldPing and the documentation for installing and getting started with it.
Install and configure
First off you install it, the easiest way is to install via the grafana-cli directly:
grafana-cli plugins install raintank-worldping-app
Or you can download it and unpack the zip file in your plugins directory.
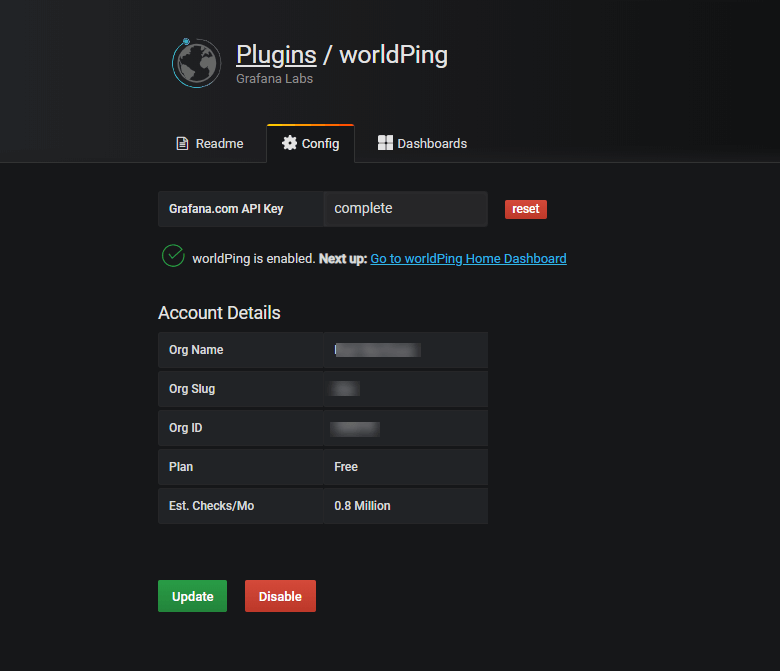
After installing it you enable the plugin. You will be guided through the whole process. You will have to create an account on grafana.com if you haven't got one already and then register the app on the grafana site.
The probing of the endpoints will be run through Grafana and not by your local installation. You'll have your local dashboards connecting to Grafana.com via an API key to pull the probing results.
\
Dashboards
When you have finished the configuration of the plugin you'll have some dashboards available in your Grafana installation. They'll live under the worldPing menu item in the sidebar menu, but you'll find them in the normal dashboard menu as well.

\
Summary
\
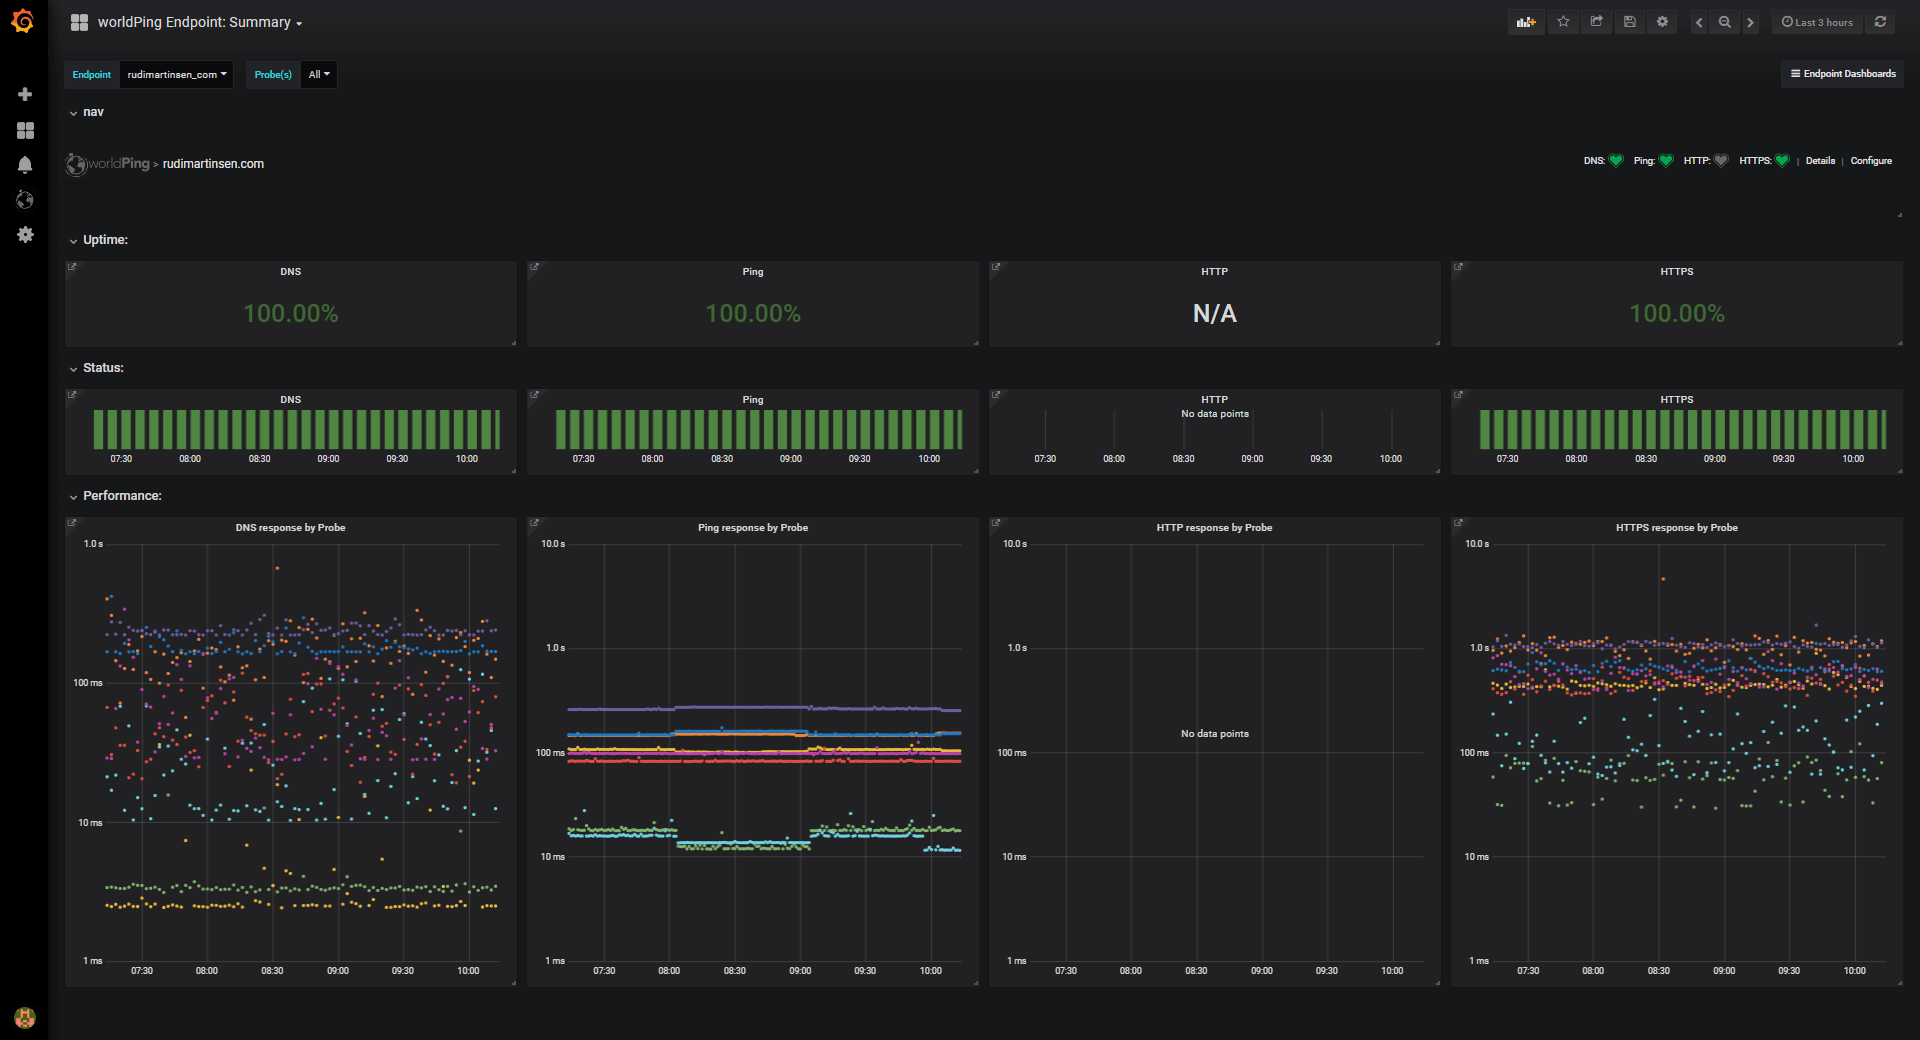
Your summary dashboard will give you a quick glance over the health of the endpoint with boxes for DNS, Ping and Http / Https. Further you'll have response graphs by service/protocol where you can see the performance of each probe over time.
Comparison
\
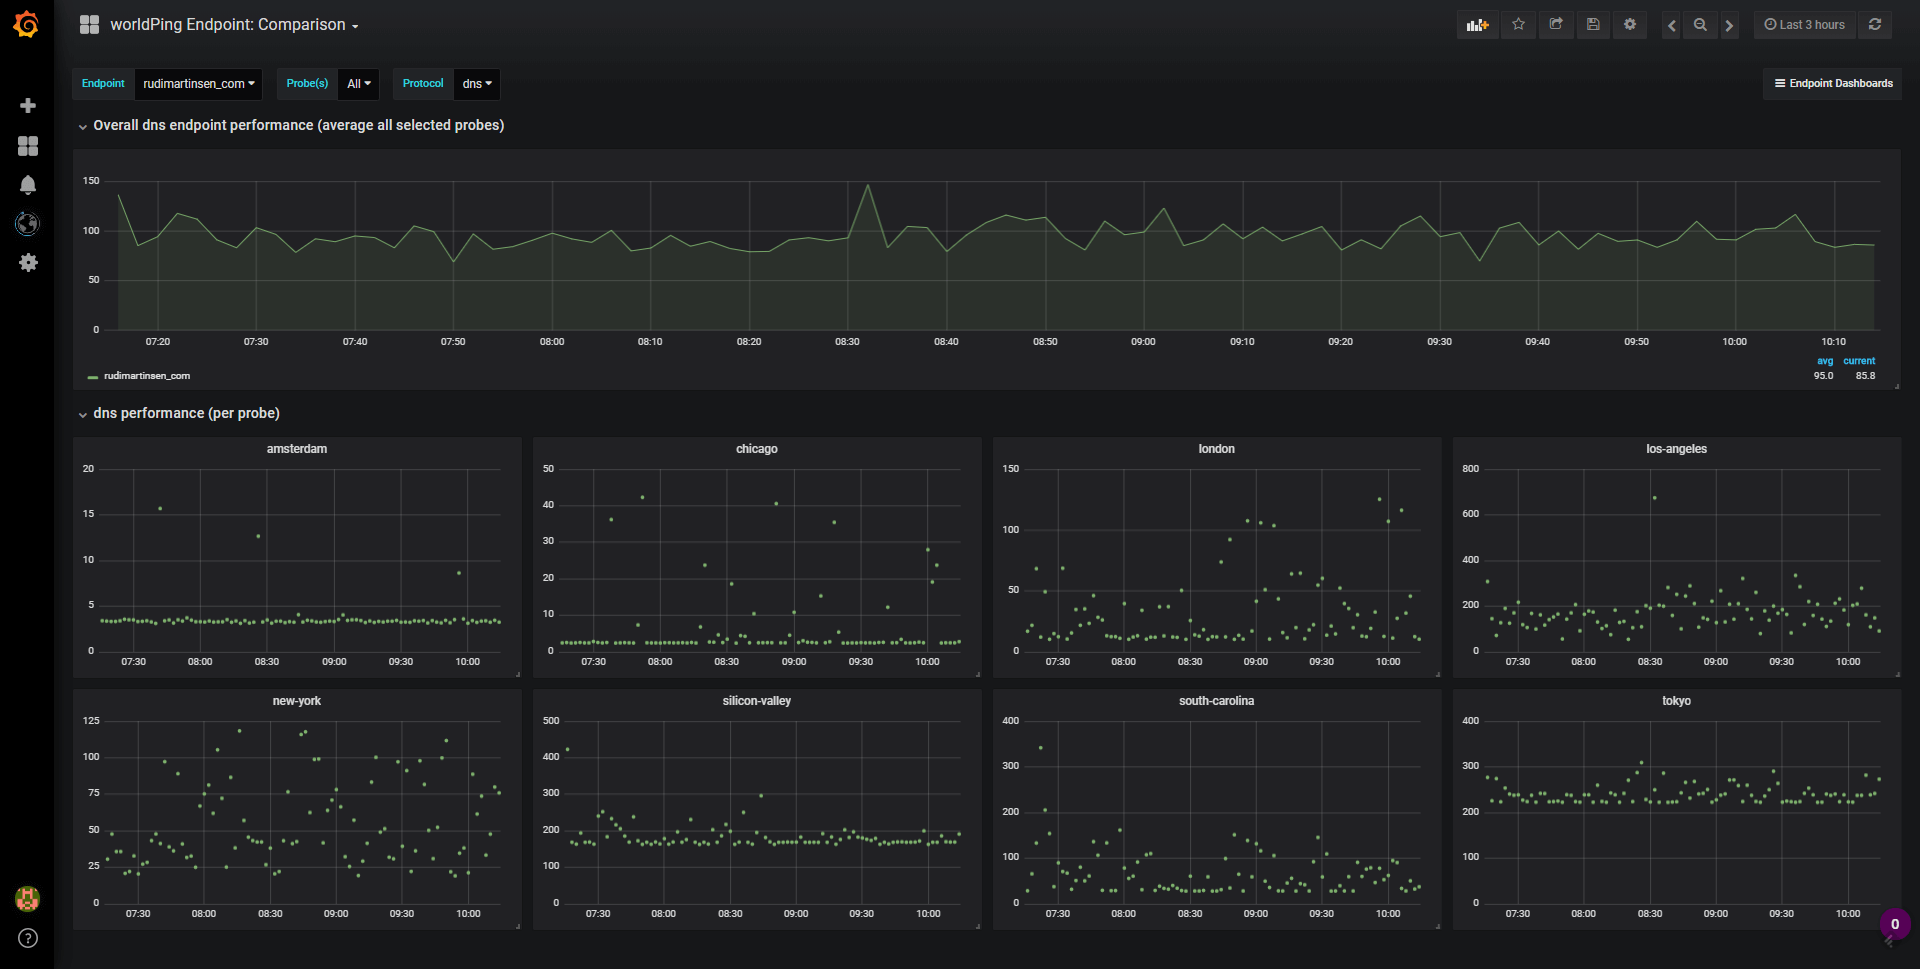
The comparison dashboard will check your dns performance across the probes configured with single graphs for each probe.
DNS, IP and Web
\
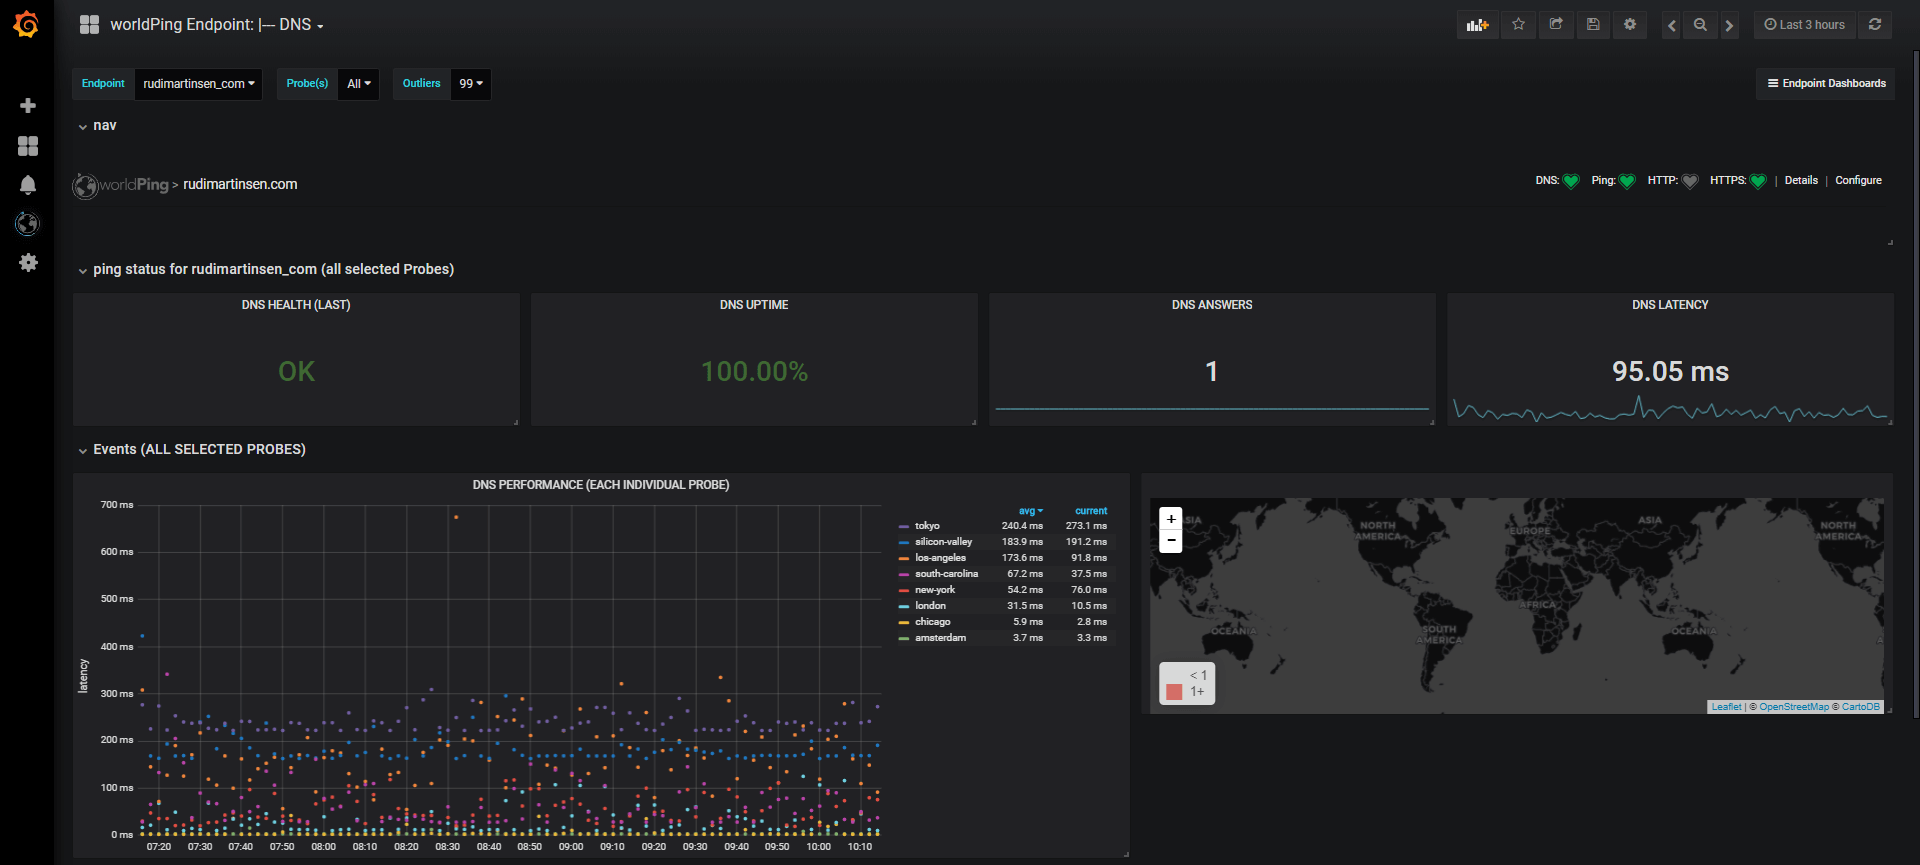
You'll have individual dashboards for DNS, Ping and Web (ping and web dashboards not shown) which gives a bit more details on the specific service, both overall but also by each probe. These dashboards also have a Map graph which I expect should show the probes plotted on the map, but these doesn't work in my case.
Alerting
Grafana has alerting built in, and I'm using this in my monitoring of my Freenas with an integration that sends alerts to my private Slack.
You can set up alerting on the worldPing dashboards as well, but there is a couple of things to be aware of. First the alerting feature in Grafana doesn't support (in the current release) Template variables in their alert queries.
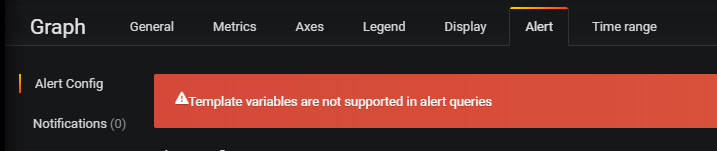
Grafana alert doesn't support templated variables
All of the worldPing dashboards uses variables so if you want to make use of Grafana's alerting feature you'll need to configure the query you want to use for alerting to use specific filters. In my case this isn't a big problem since I only have one site that I want to monitor, but if you have several you would probably need to set up multiple queries with specific values.
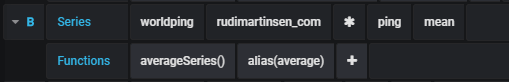
Query on specific endpoint and probes
\
After fixing that you can set up your alert query and specify the notification. I've configured mine to send the notification to my private Slack.
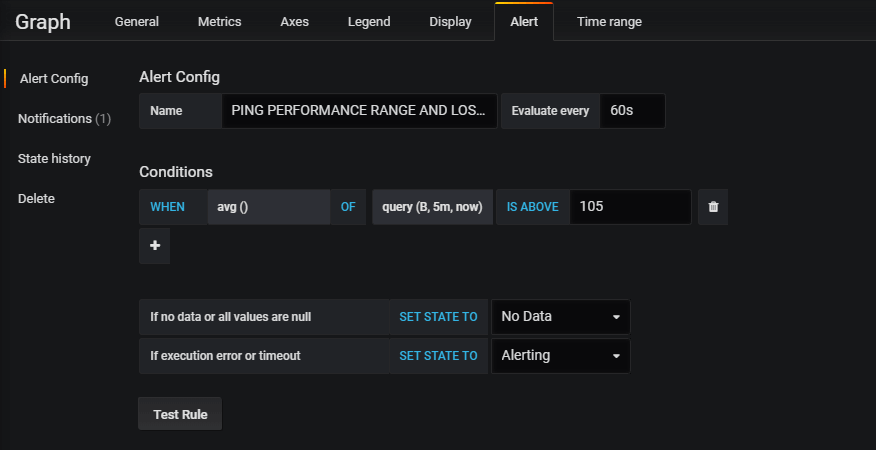
Grafana alert setup
\
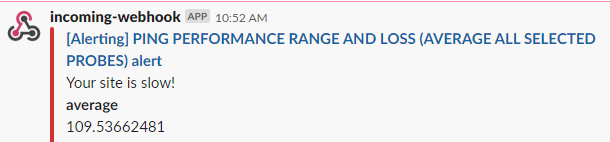
Slack alert from Grafana
\
This customization leads on to the second thing to be aware of, the worldPing dashboards are delivered by Grafana Labs and are shipped through the plugin installation. When you update the plugin the dashboards will most likely be overwritten by the default ones hence you'll lose your customization. Note that you will be warned about this and given the option to save a copy the edited dashboard.
By this you can also build an "alerting dashboard" which would allow you to create your specific queries you want to have alerting on. Note that these live in your local Grafana environment which needs to run for the alerting to work.
I've created a small dashboard with some queries that will send a notification to my private Slack if something seems wrong or slow.
Alternatives
If you want a solution that checks if your site is up or down there are lots of services out there i.e. Pingdom, Uptime robot and Uptrends. I haven't tested either of these and can't really vouch for them, but it shows that there are tools available that has a (limited) free tier which might be worth checking out if you don't want to go with Grafana.
Azure Application Insights
You could also use Azure Application Insights which works with any URL. I've set up this in my private Azure subscription for testing.
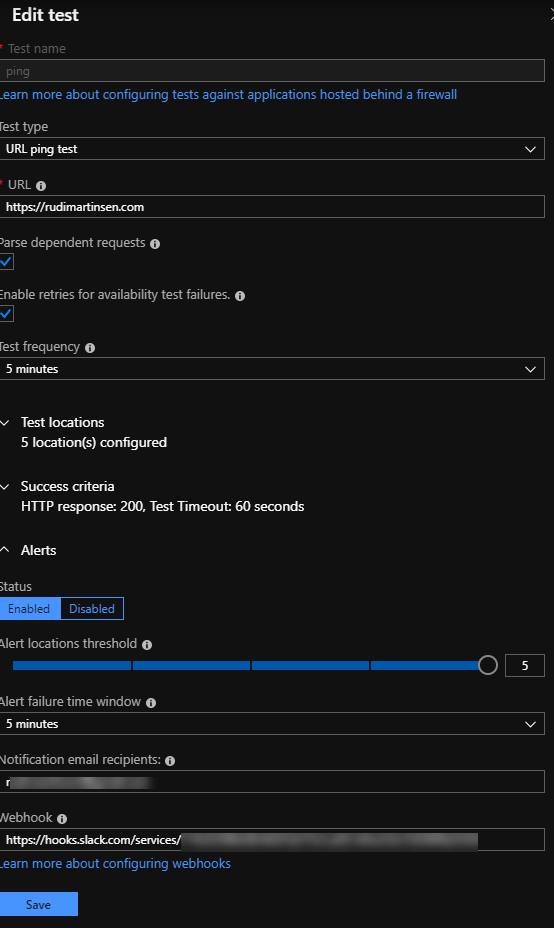
The setup is easy, you create an Application Insight Resource, create an availability test where you specify the endpoint URL, what kind of test (URL ping test), the locations that should run the test and the criterias and then Azure will run these tests for you. You can also configure alerting to email or a webhook. I've configured both in my example.
\
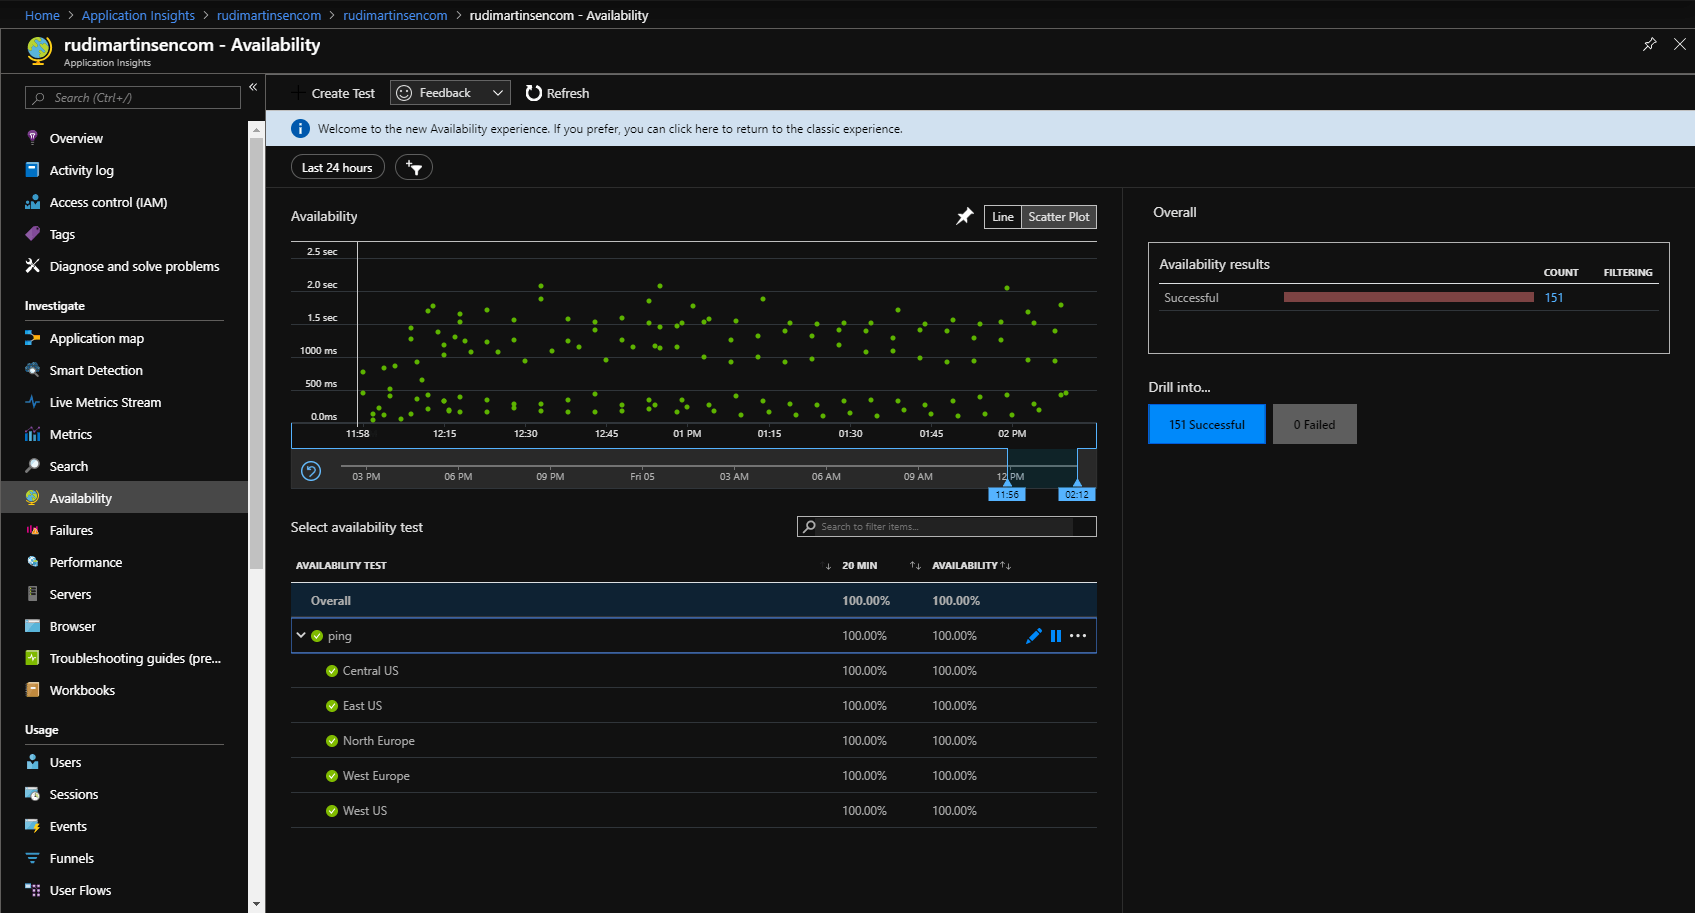
After a little while you'll have a dashboard with your results available to you where you also can drill down in to each probe for more details.
\
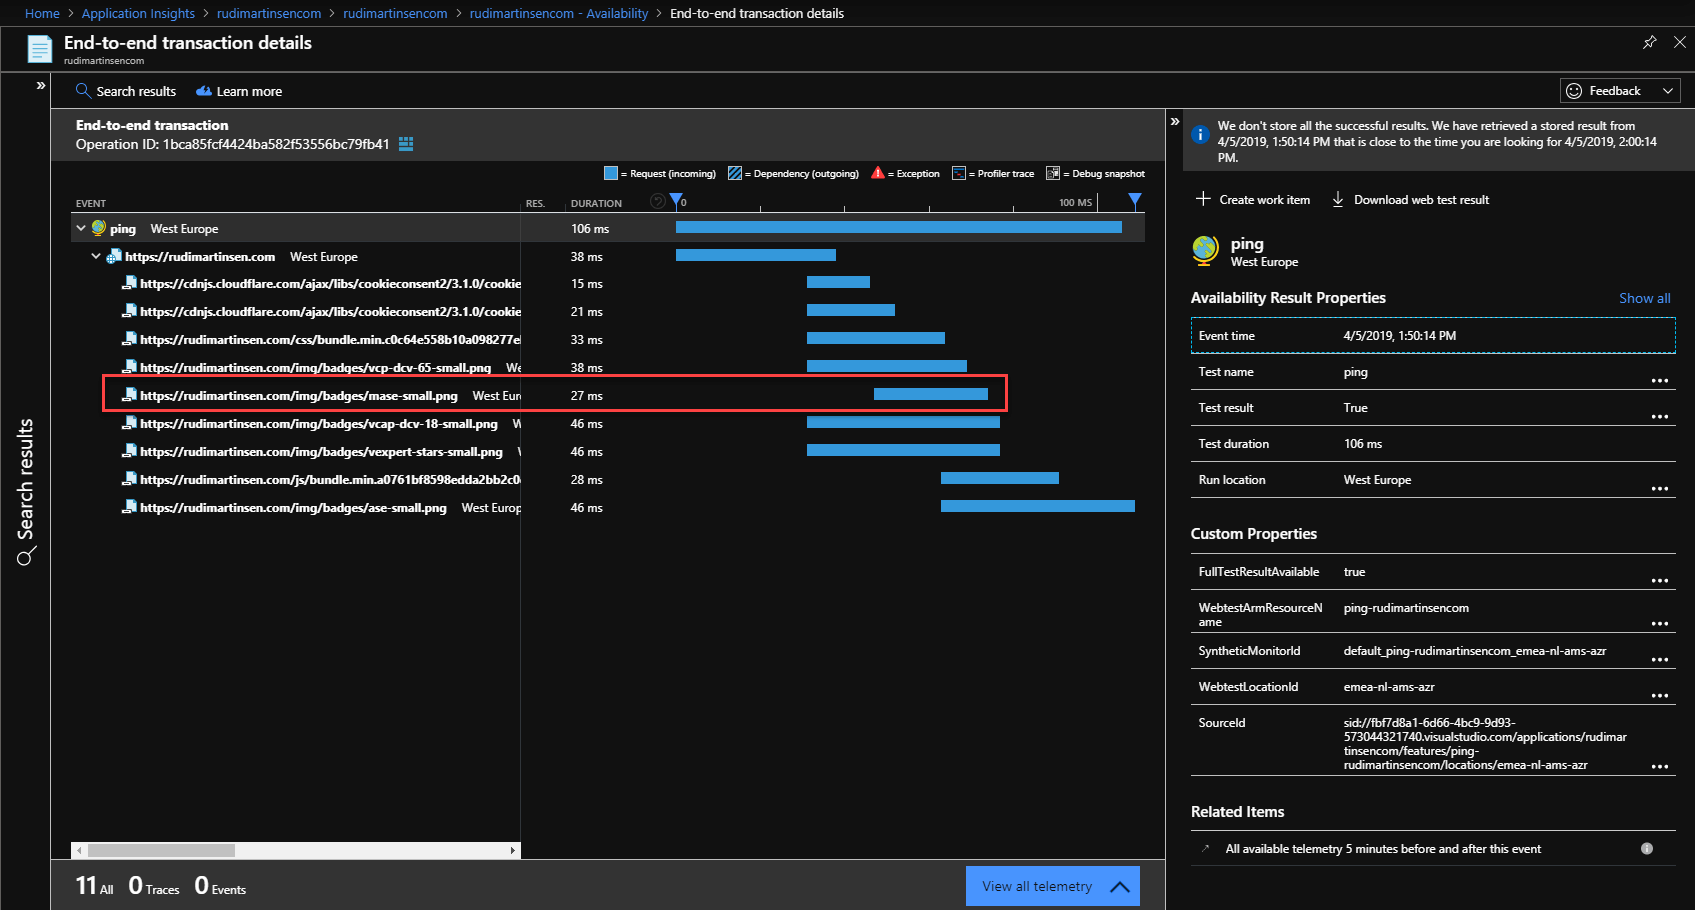
With the telemetry data collected I found something interesting, namely some images that loaded slower than others. I did a optimization of my images during the migration process, but seems I forgot some of them.
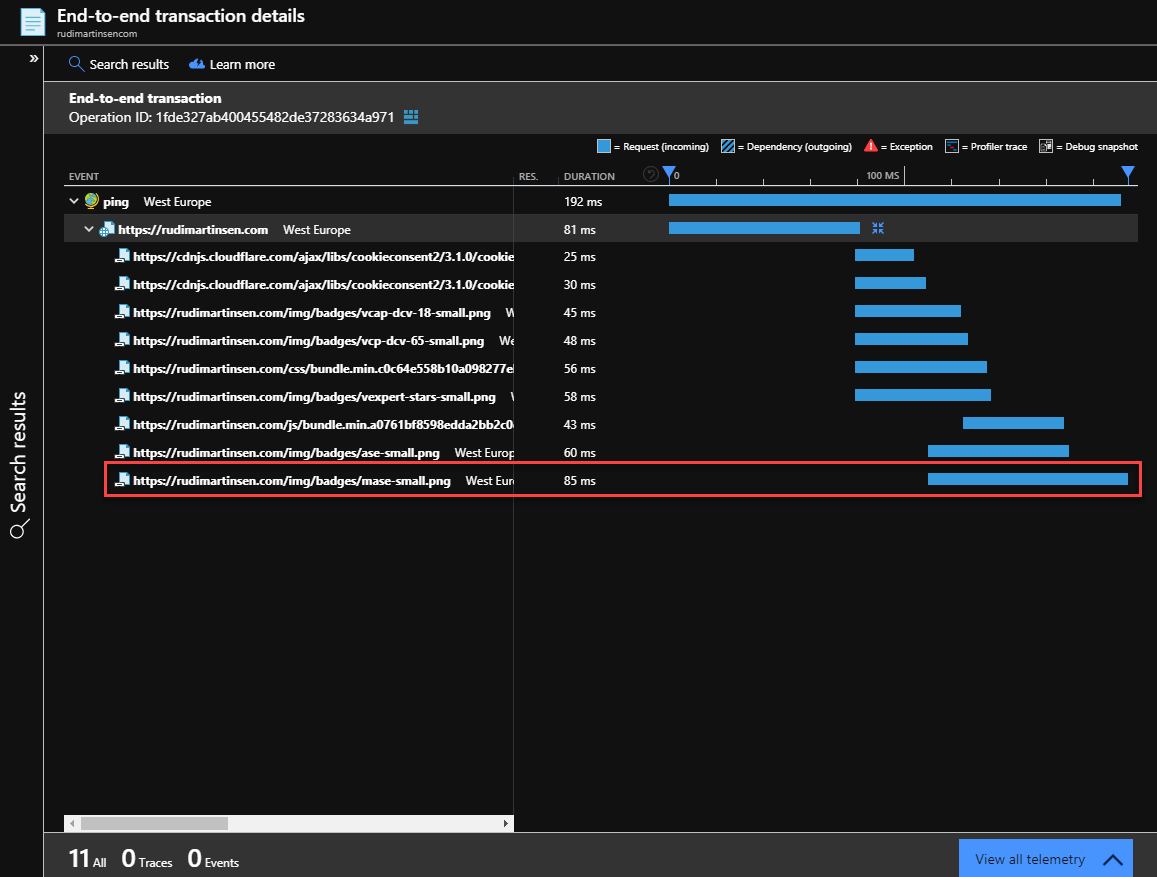
\
After optimizing them and publishing, it loaded faster. Even though we are talking milliseconds here, everything counts.
Summary
I really enjoy my current setup with Hugo as the content platform and the hosting on Netlify. Hopefully I will never experience any issues with the availability, but now I at least have some alternatives that can help me monitor it.
I hope this post has shown a few of the alternatives available and given you some ideas on how to configure your own solution.
If you have any questions, comments or suggestions feel free to reach out to me on Twitter!