Deploy Prometheus and Grafana on a Tanzu Community Edition cluster
Update 2022-10-21: After just one year in the wild VMware announced on Oct 21 2022 that they would no longer update or maintain the TCE project and that by end of 2022 the Github project will be removed. For more information check out my blog post here
Most of the things mentioned in this post (outside of installing TCE) should still be valid for other Kubernetes distributions
Over a few posts lately I've worked with Tanzu Community Edition
- Deploy Tanzu Community Edition clusters
- Use MetalLB as a Load Balancer in Kubernetes
- Deploy Contour on a TCE cluster
In this post we'll use the Tanzu Package repository to deploy a Prometheus time series database for collecting metrics in our cluster, and a Grafana server for visualizing the metrics.
For more information on how to work with the Tanzu Package Repository check out the documentation
Deploy Prometheus
We'll start with Prometheus, and the process for deploying it with the Package is documented here
Note that we'll install Prometheus with Ingress enabled so we'll need to have Contour, and cert-manager installed on the target cluster. Check out this post for more information on how I've deployed that.
First we'll list the available versions for Prometheus
1tanzu package available list prometheus.community.tanzu.vmware.com

Now let's see the possible configuration values
1tanzu package available get prometheus.community.tanzu.vmware.com/2.27.0 --values-schema
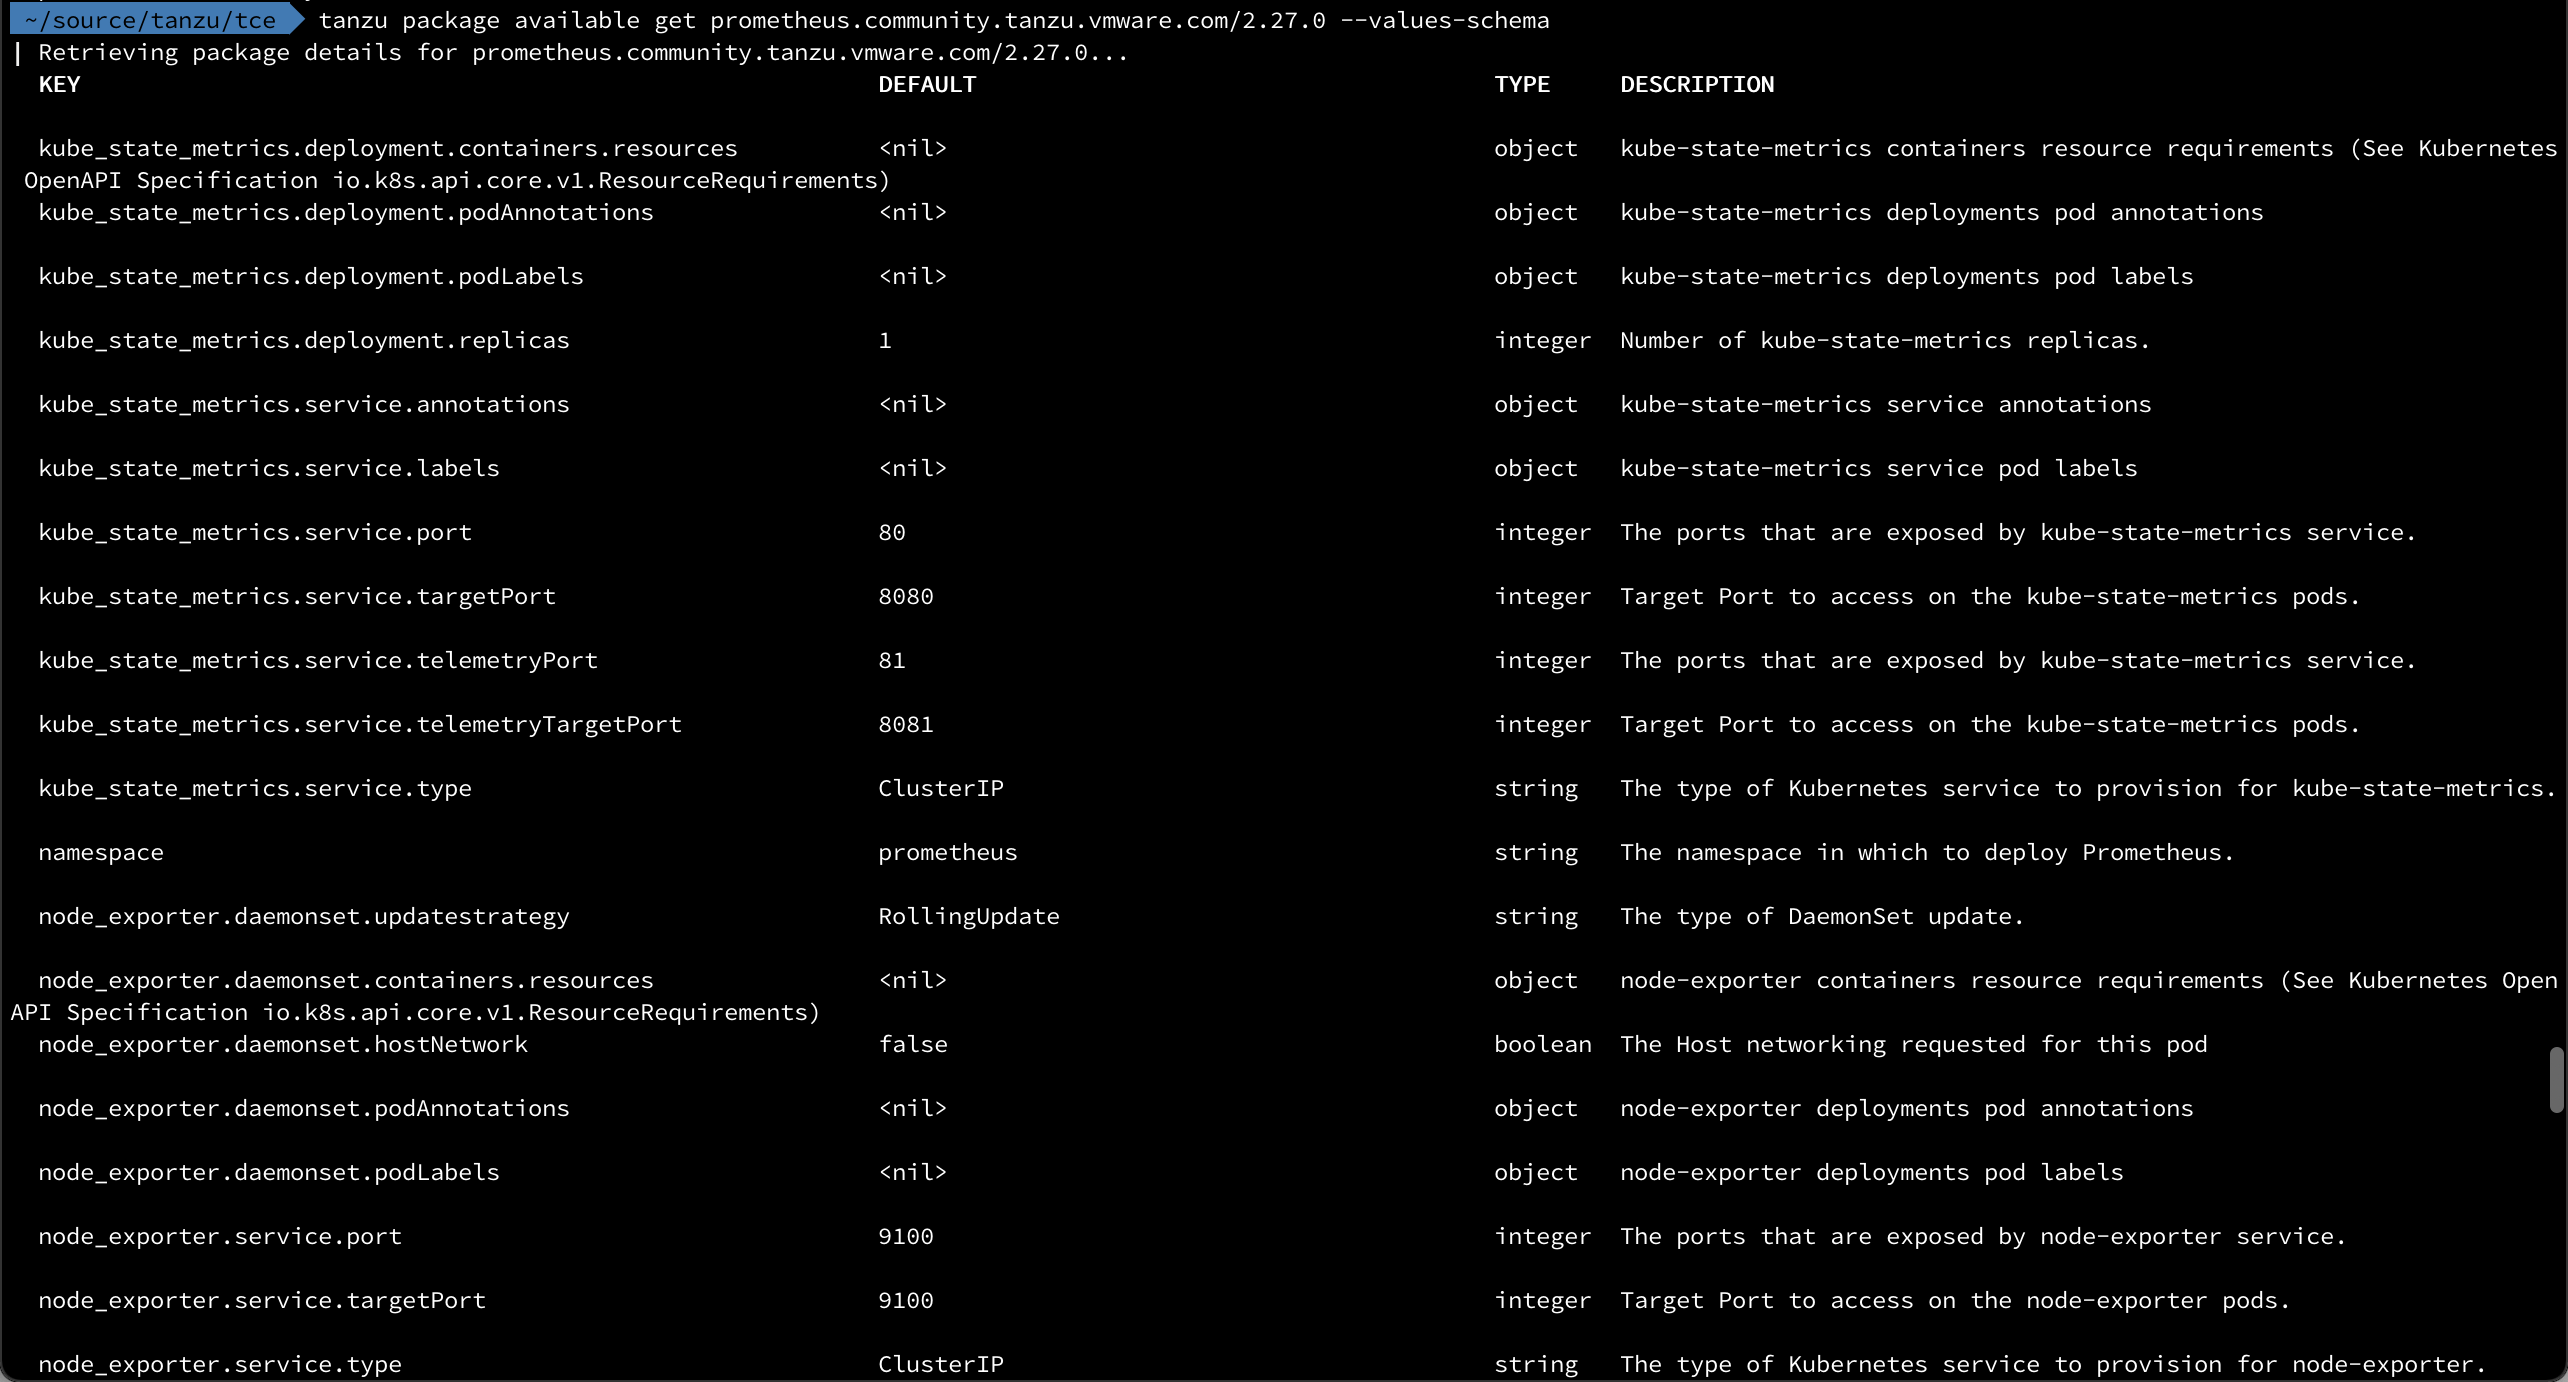
There's a lot of values available, an overview with an explanation can be found here
For this installation we'll only enable Ingress and set the hostname
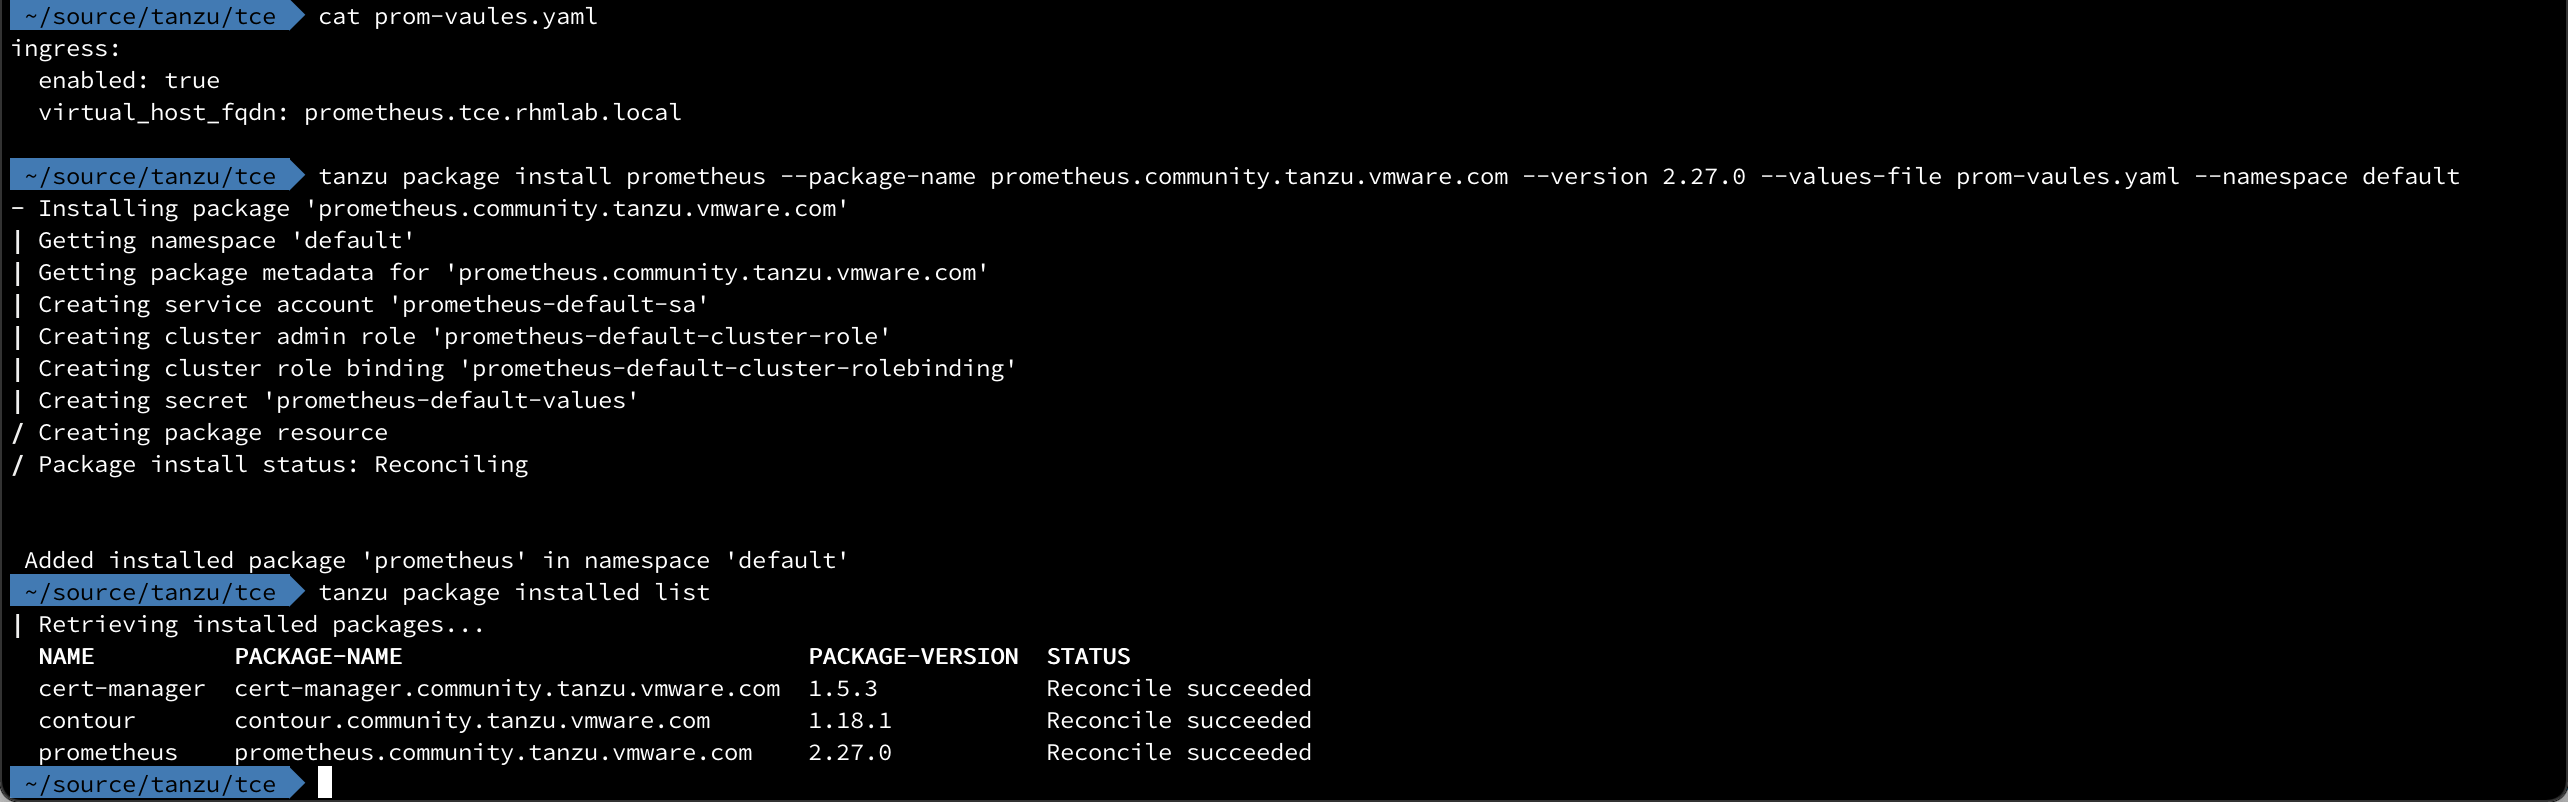
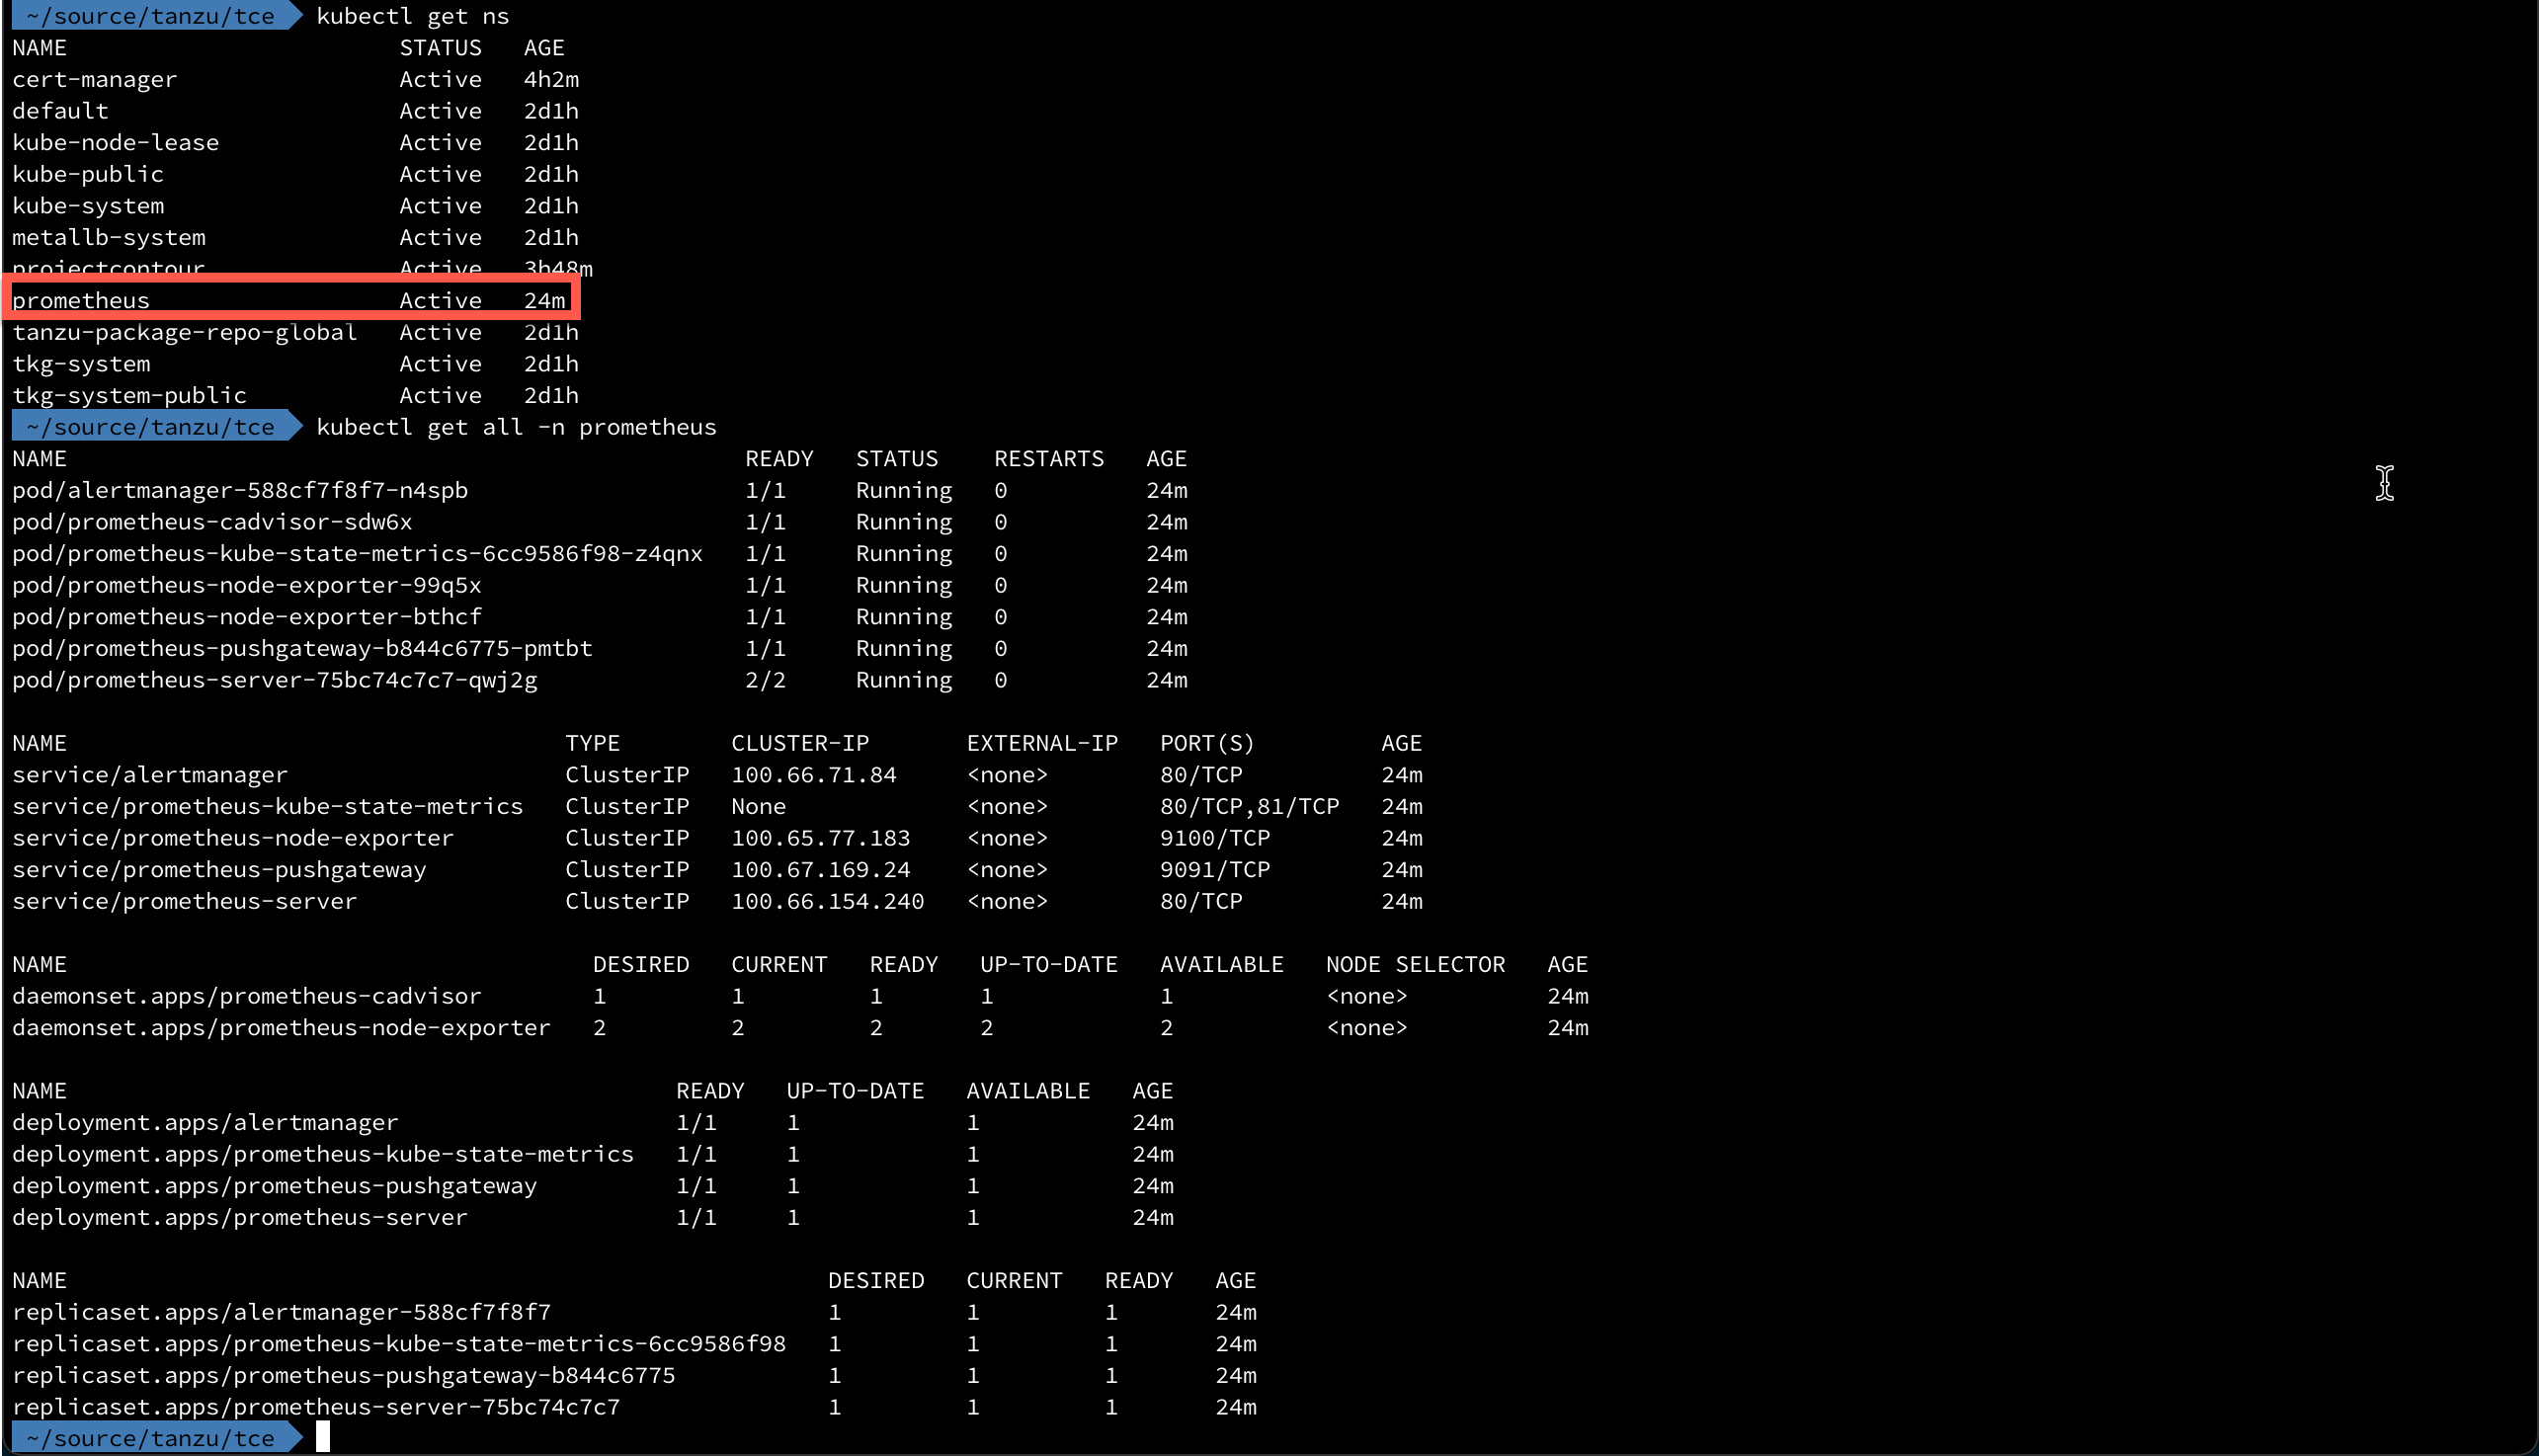
By default Prometheus is deployed to it's own Kubernetes namespace. Let's check out the resources deployed
Since we've specified that we wanted to use Ingress let's take a look at the HTTPProxies, and the Envoy load balancer IP
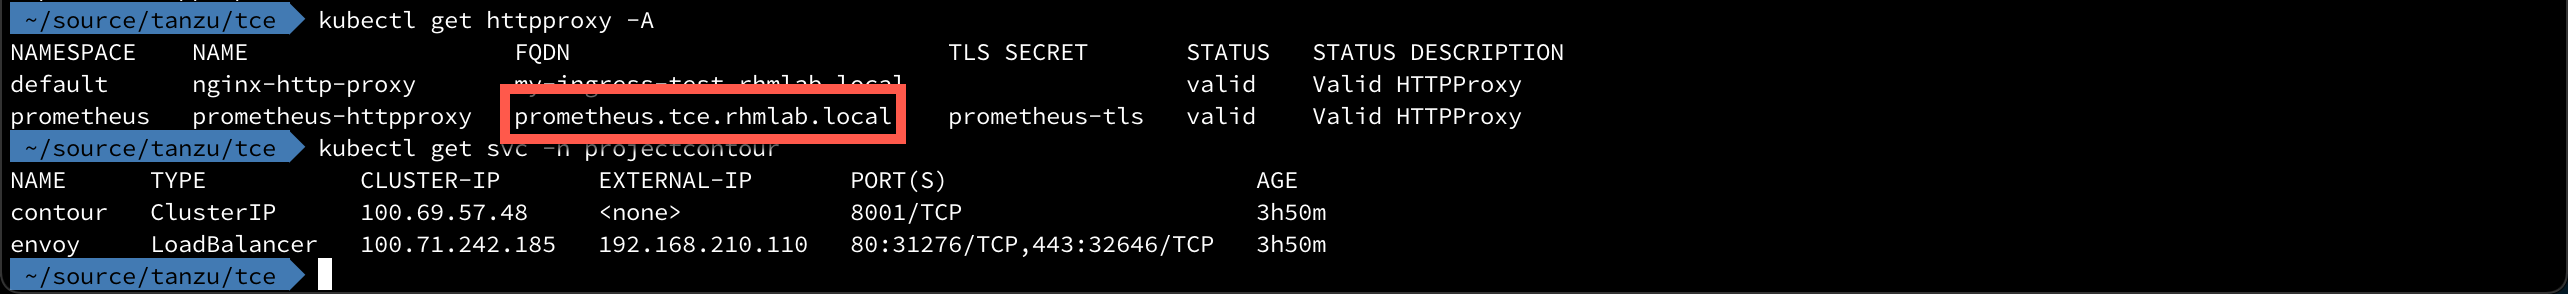
To be able to reach Prometheus on the specified hostname we need to somehow map that name to the IP with DNS (or with a shortcut in the hosts file as I've done for now)
Let's see if we can access Prometheus
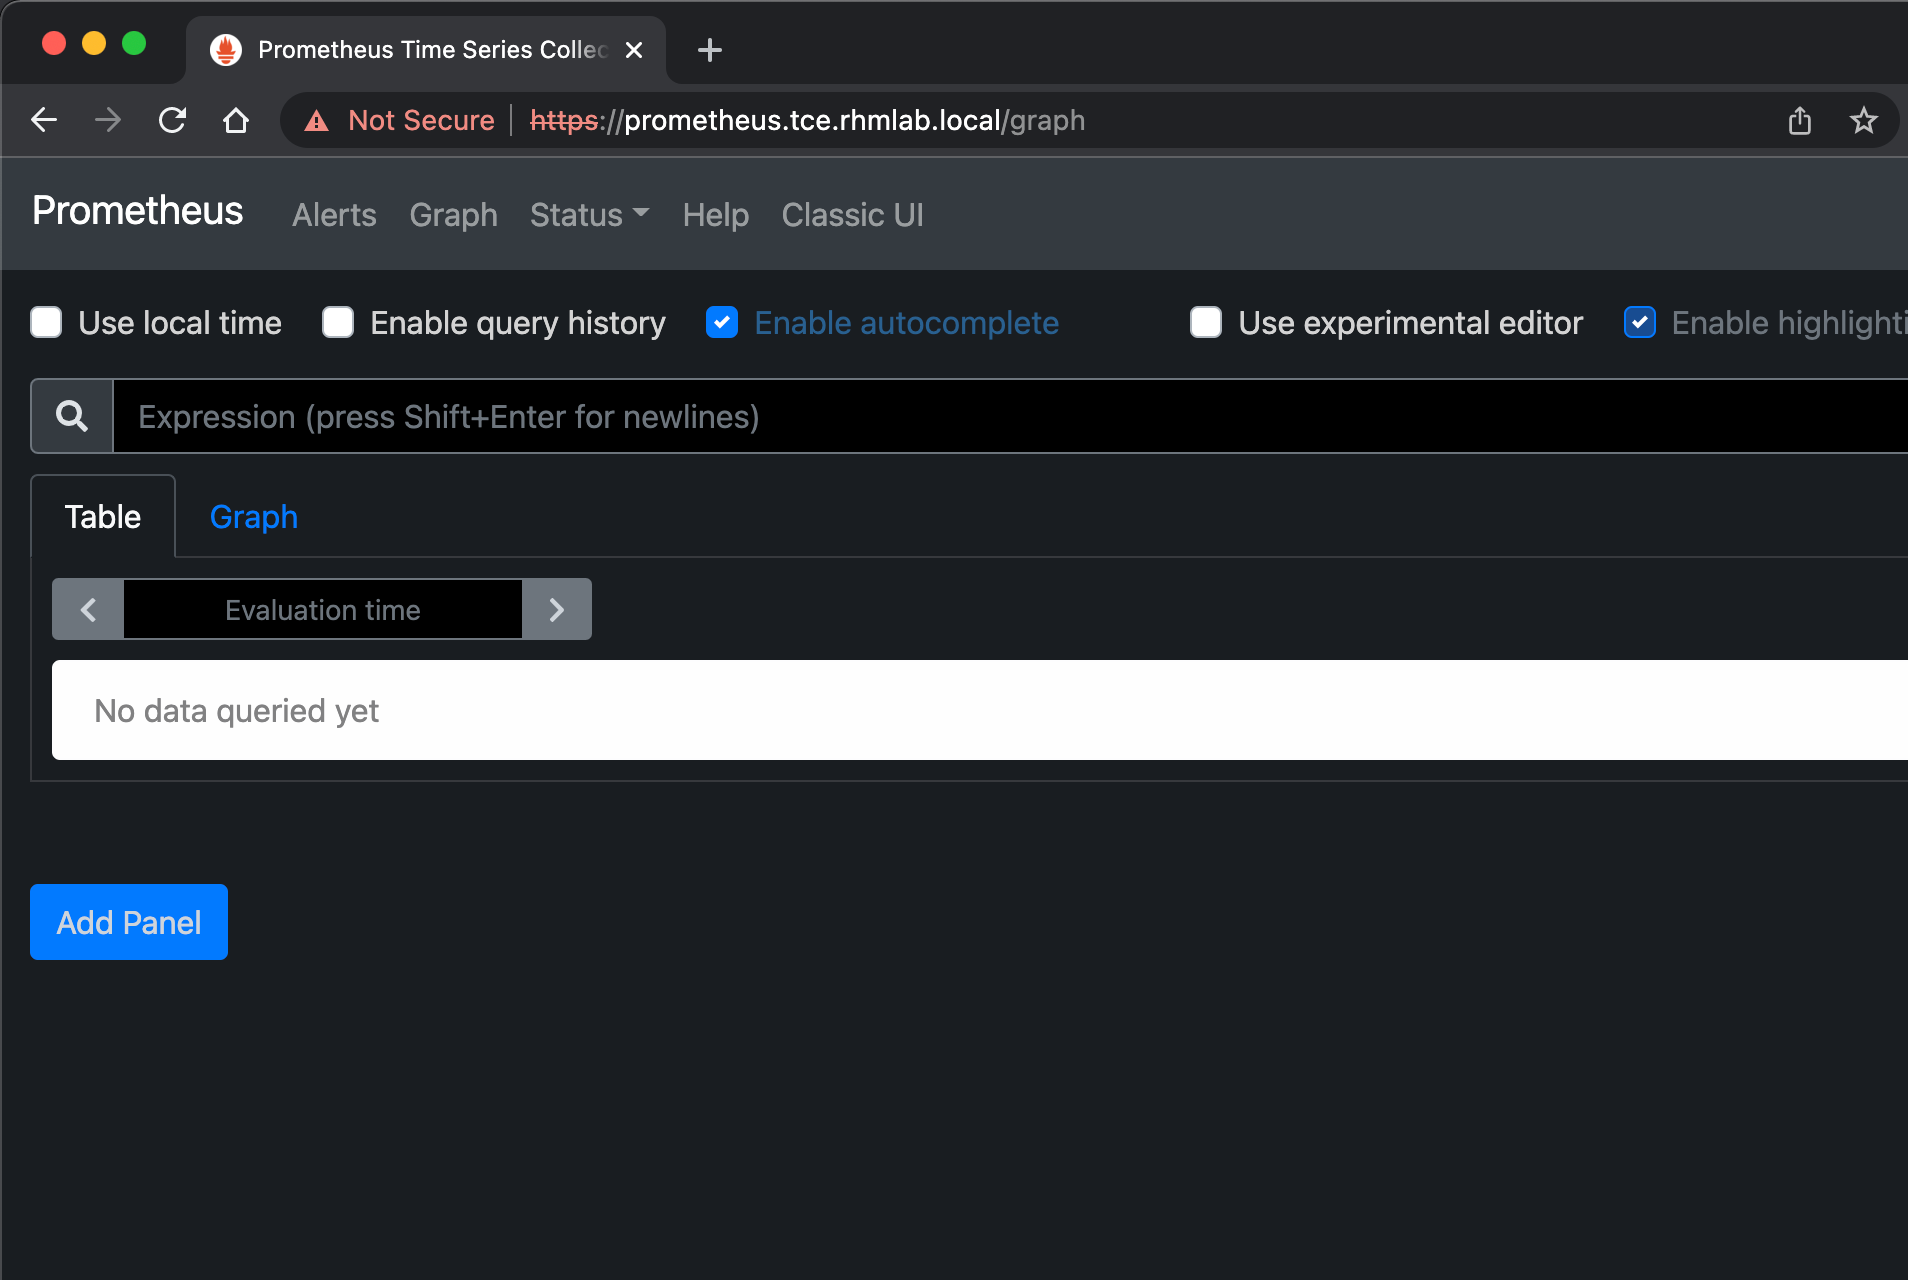
Great stuff. Let's continue with deploying Grafana.
Deploy Grafana
Listing the available Grafana versions and the values available, again we can see that there are a lot of configuration that can be done
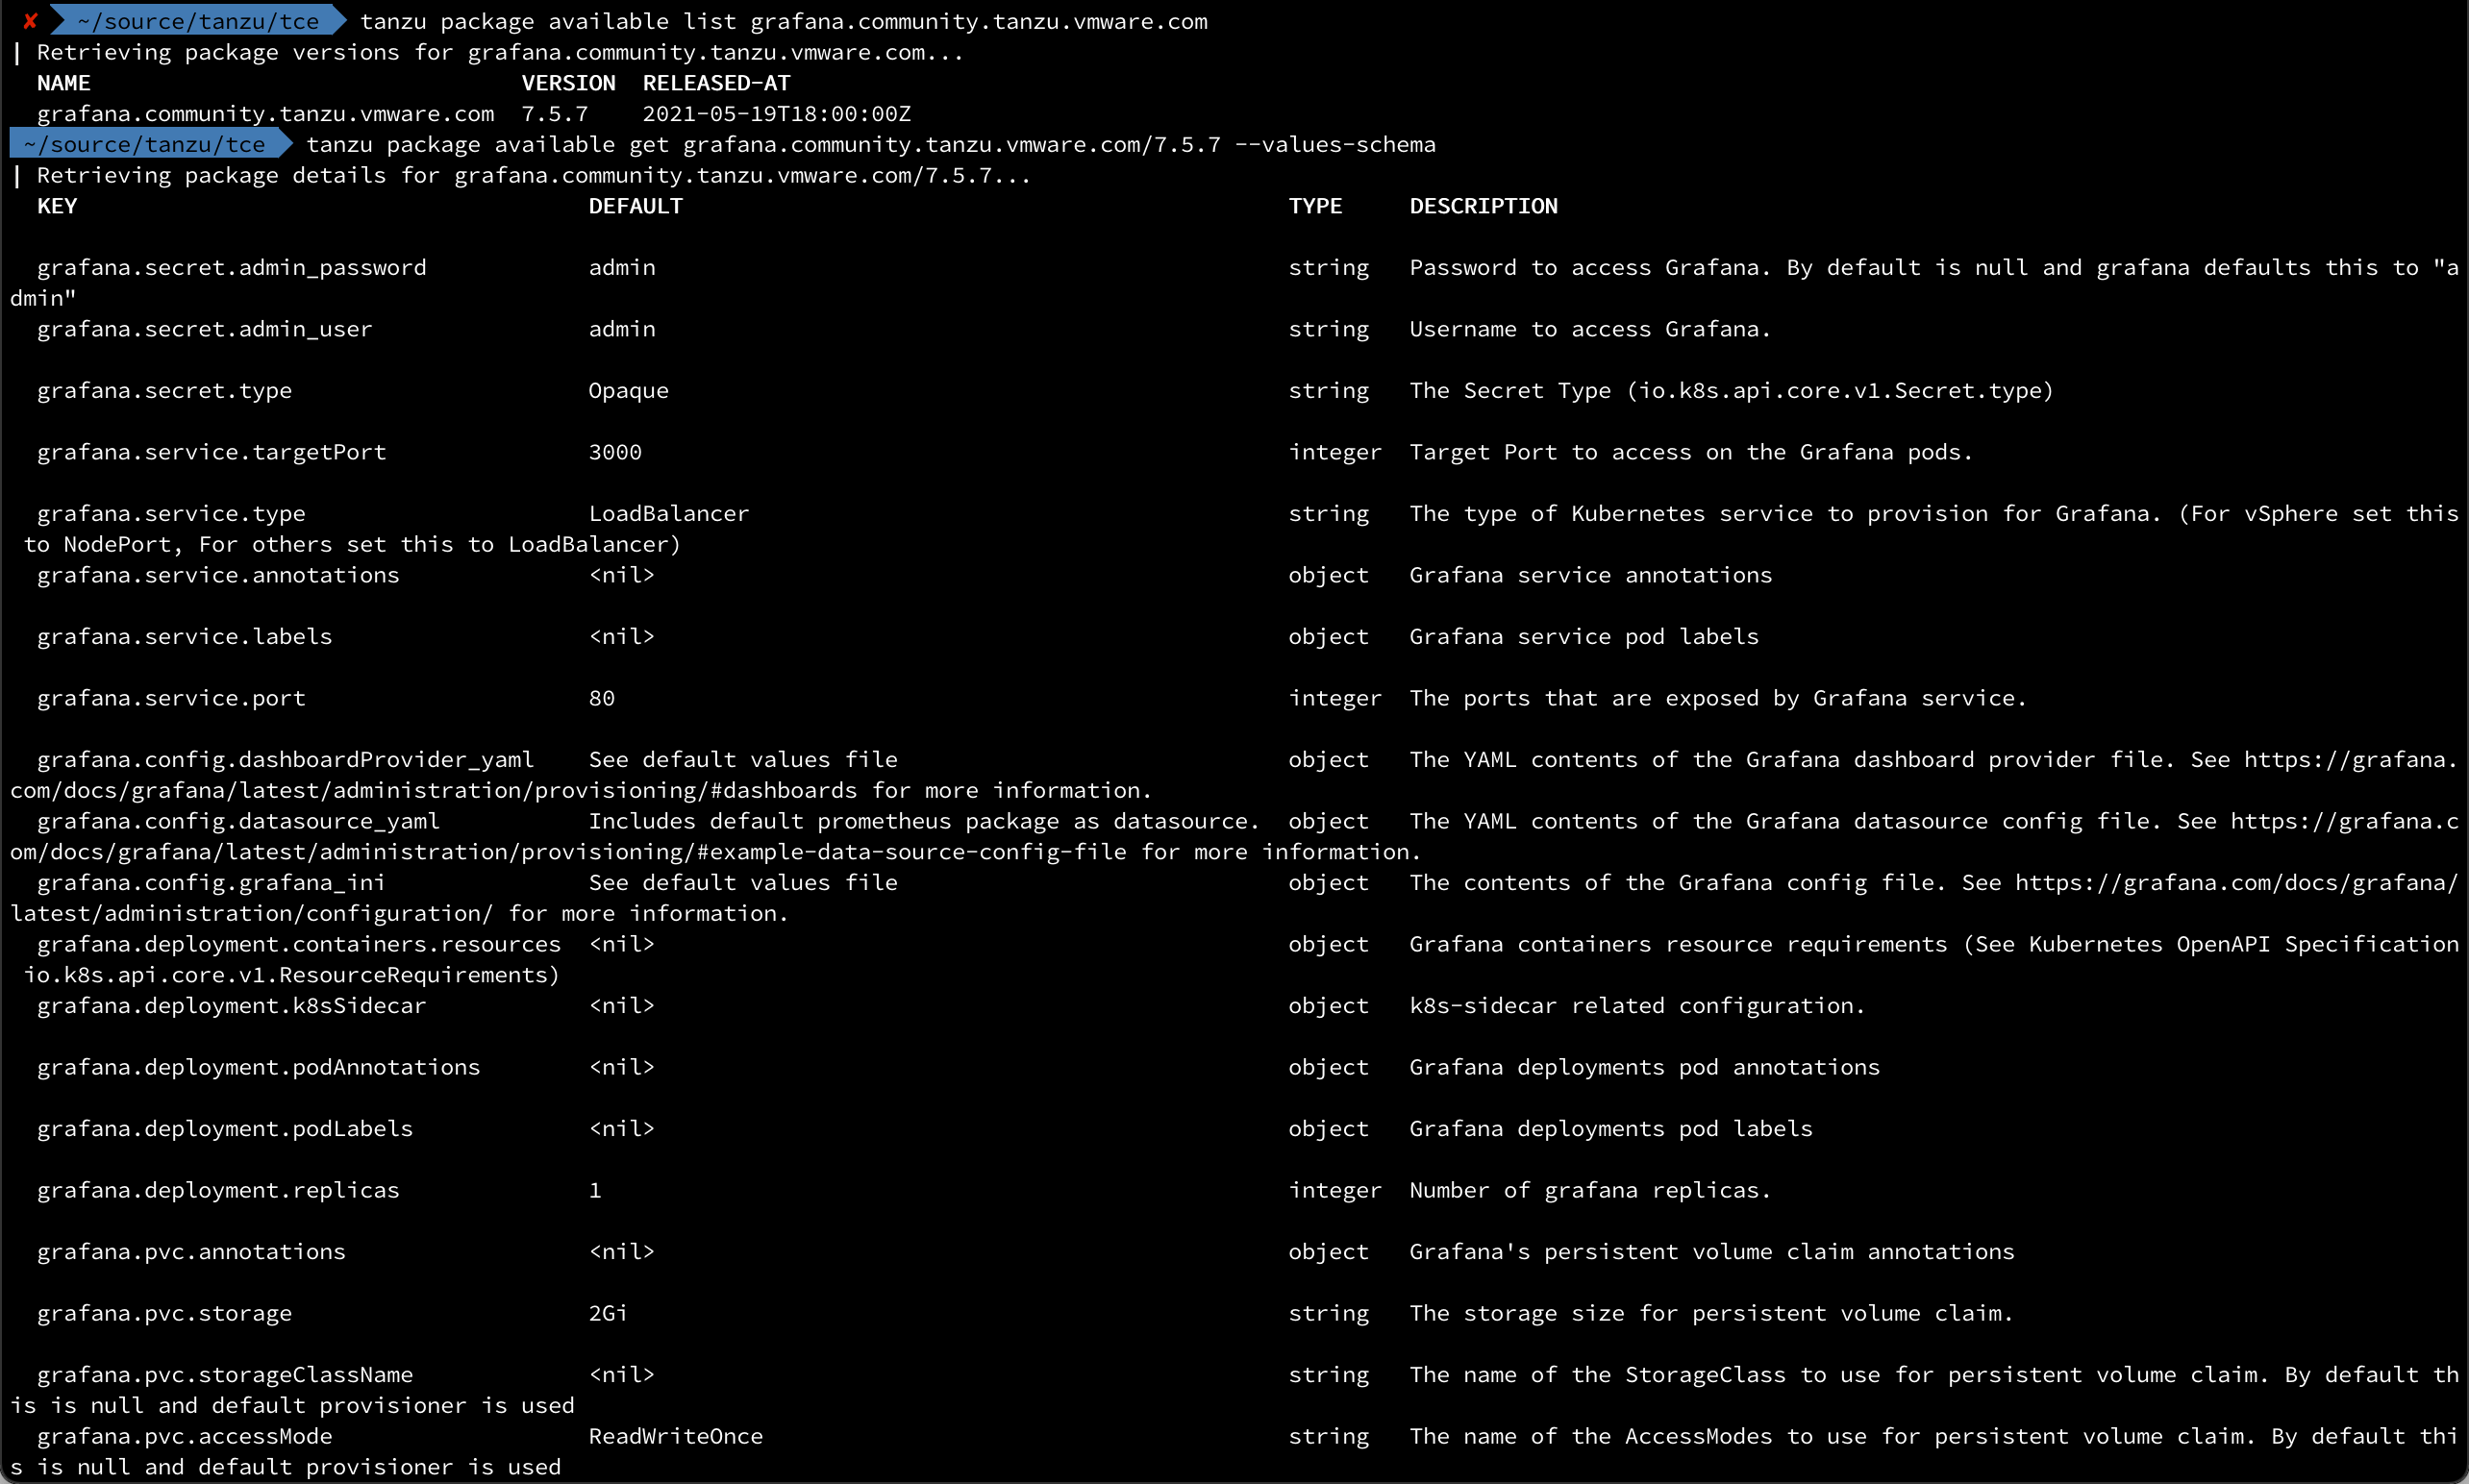
As for Prometheus, there's not a whole lot of configuration we'll have to do here either. If we wanted we could leave it with enabling Ingress and setting the virtual hostname as before, but we'll also make use of the Provisioning capabilities in Grafana to automatically set up a datasource for our Prometheus data.
We'll need to know how to reach the Prometheus server from the Grafana server so we'll list the services deployed in the Prometheus namespace

We can reference the prometheus server by
 1ingress:
 2  enabled: true
 3  virtual_host_fqdn: grafana.tce.rhmlab.local
 4config:
 5  datasource_yaml: |-
 6      apiVersion: 1
 7      datasources:
 8        - name: Prometheus
 9          type: prometheus
10          url: prometheus-server.prometheus.svc.cluster.local
11          access: proxy
12          isDefault: true
1tanzu package install grafana --package-name grafana.community.tanzu.vmware.com --version 7.5.7 --values-file grafana-values.yaml
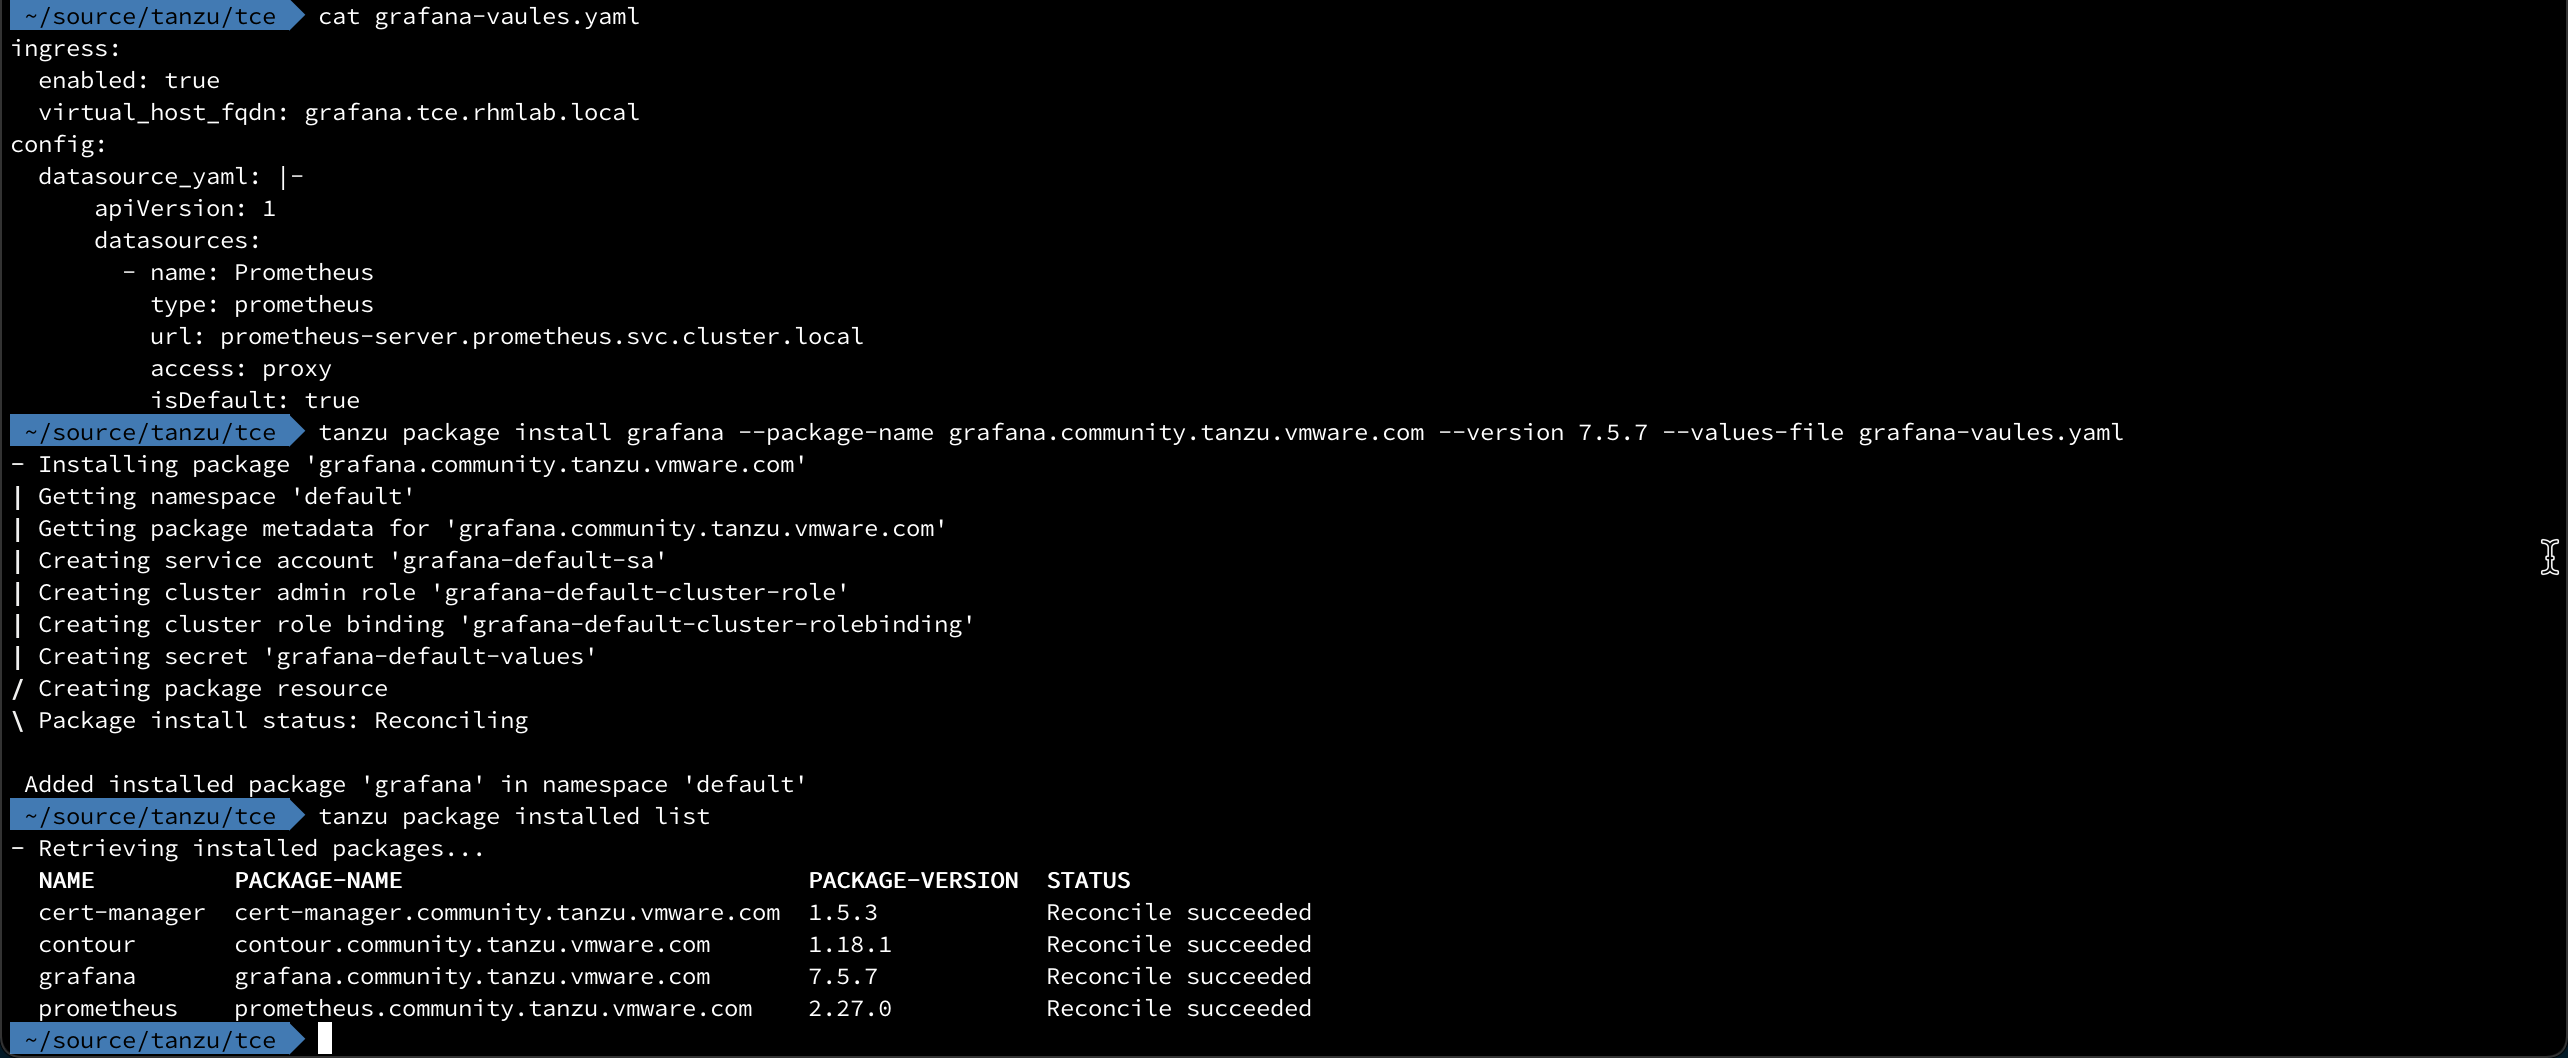
And we can check the resources deployed as well as confirm the HTTPProxy
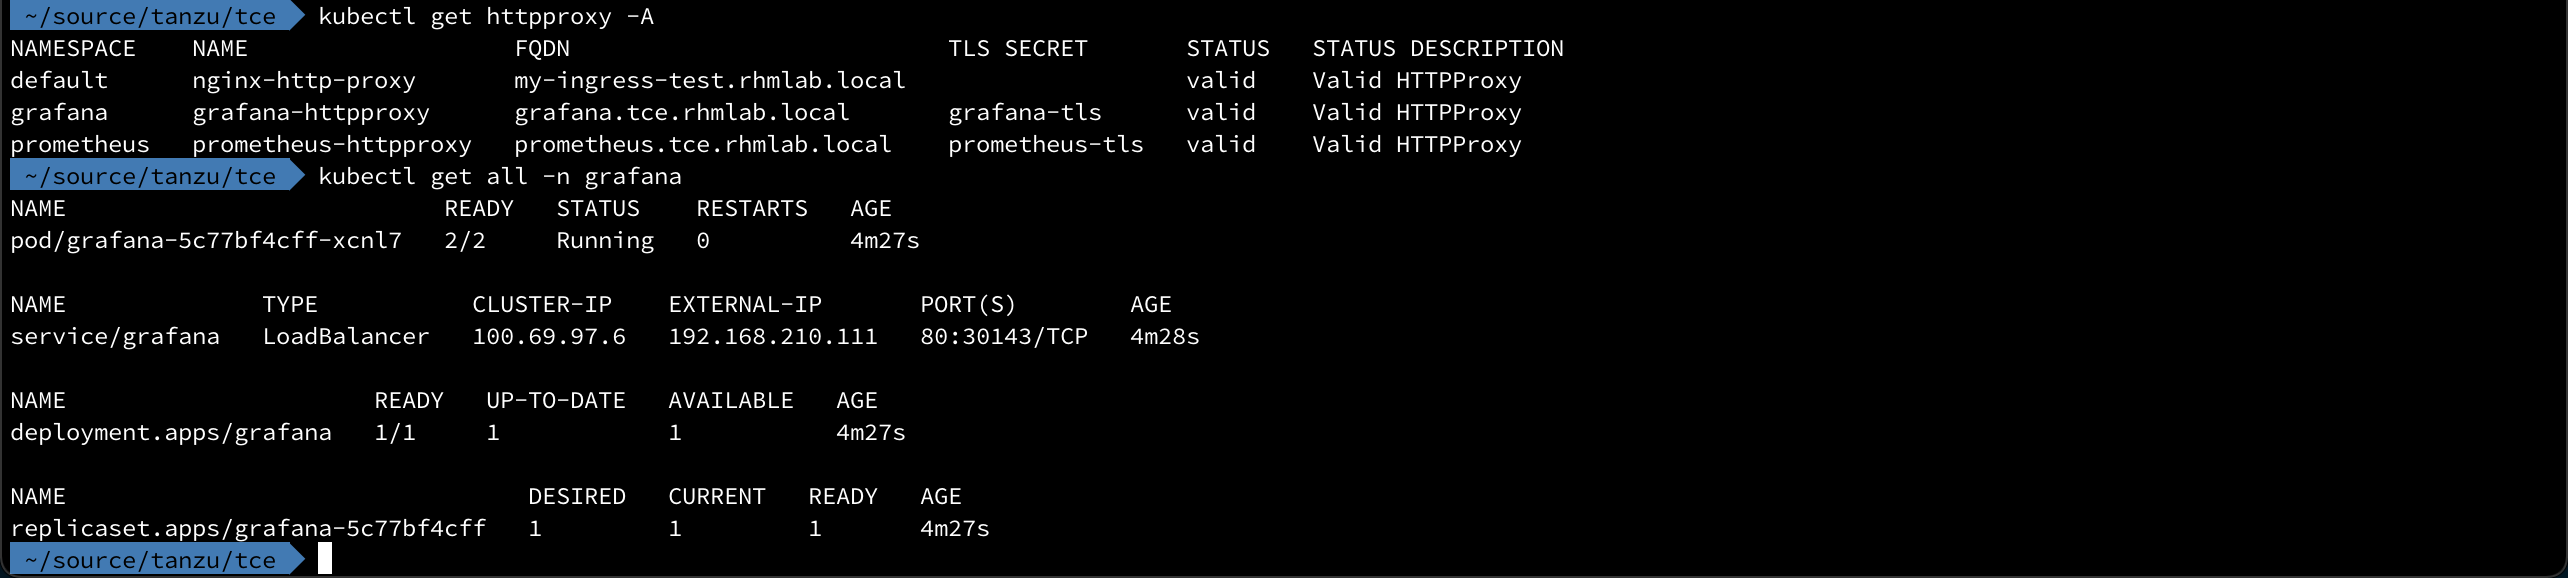
And we can verify that we reach our virtual host name
Verify Grafana installation
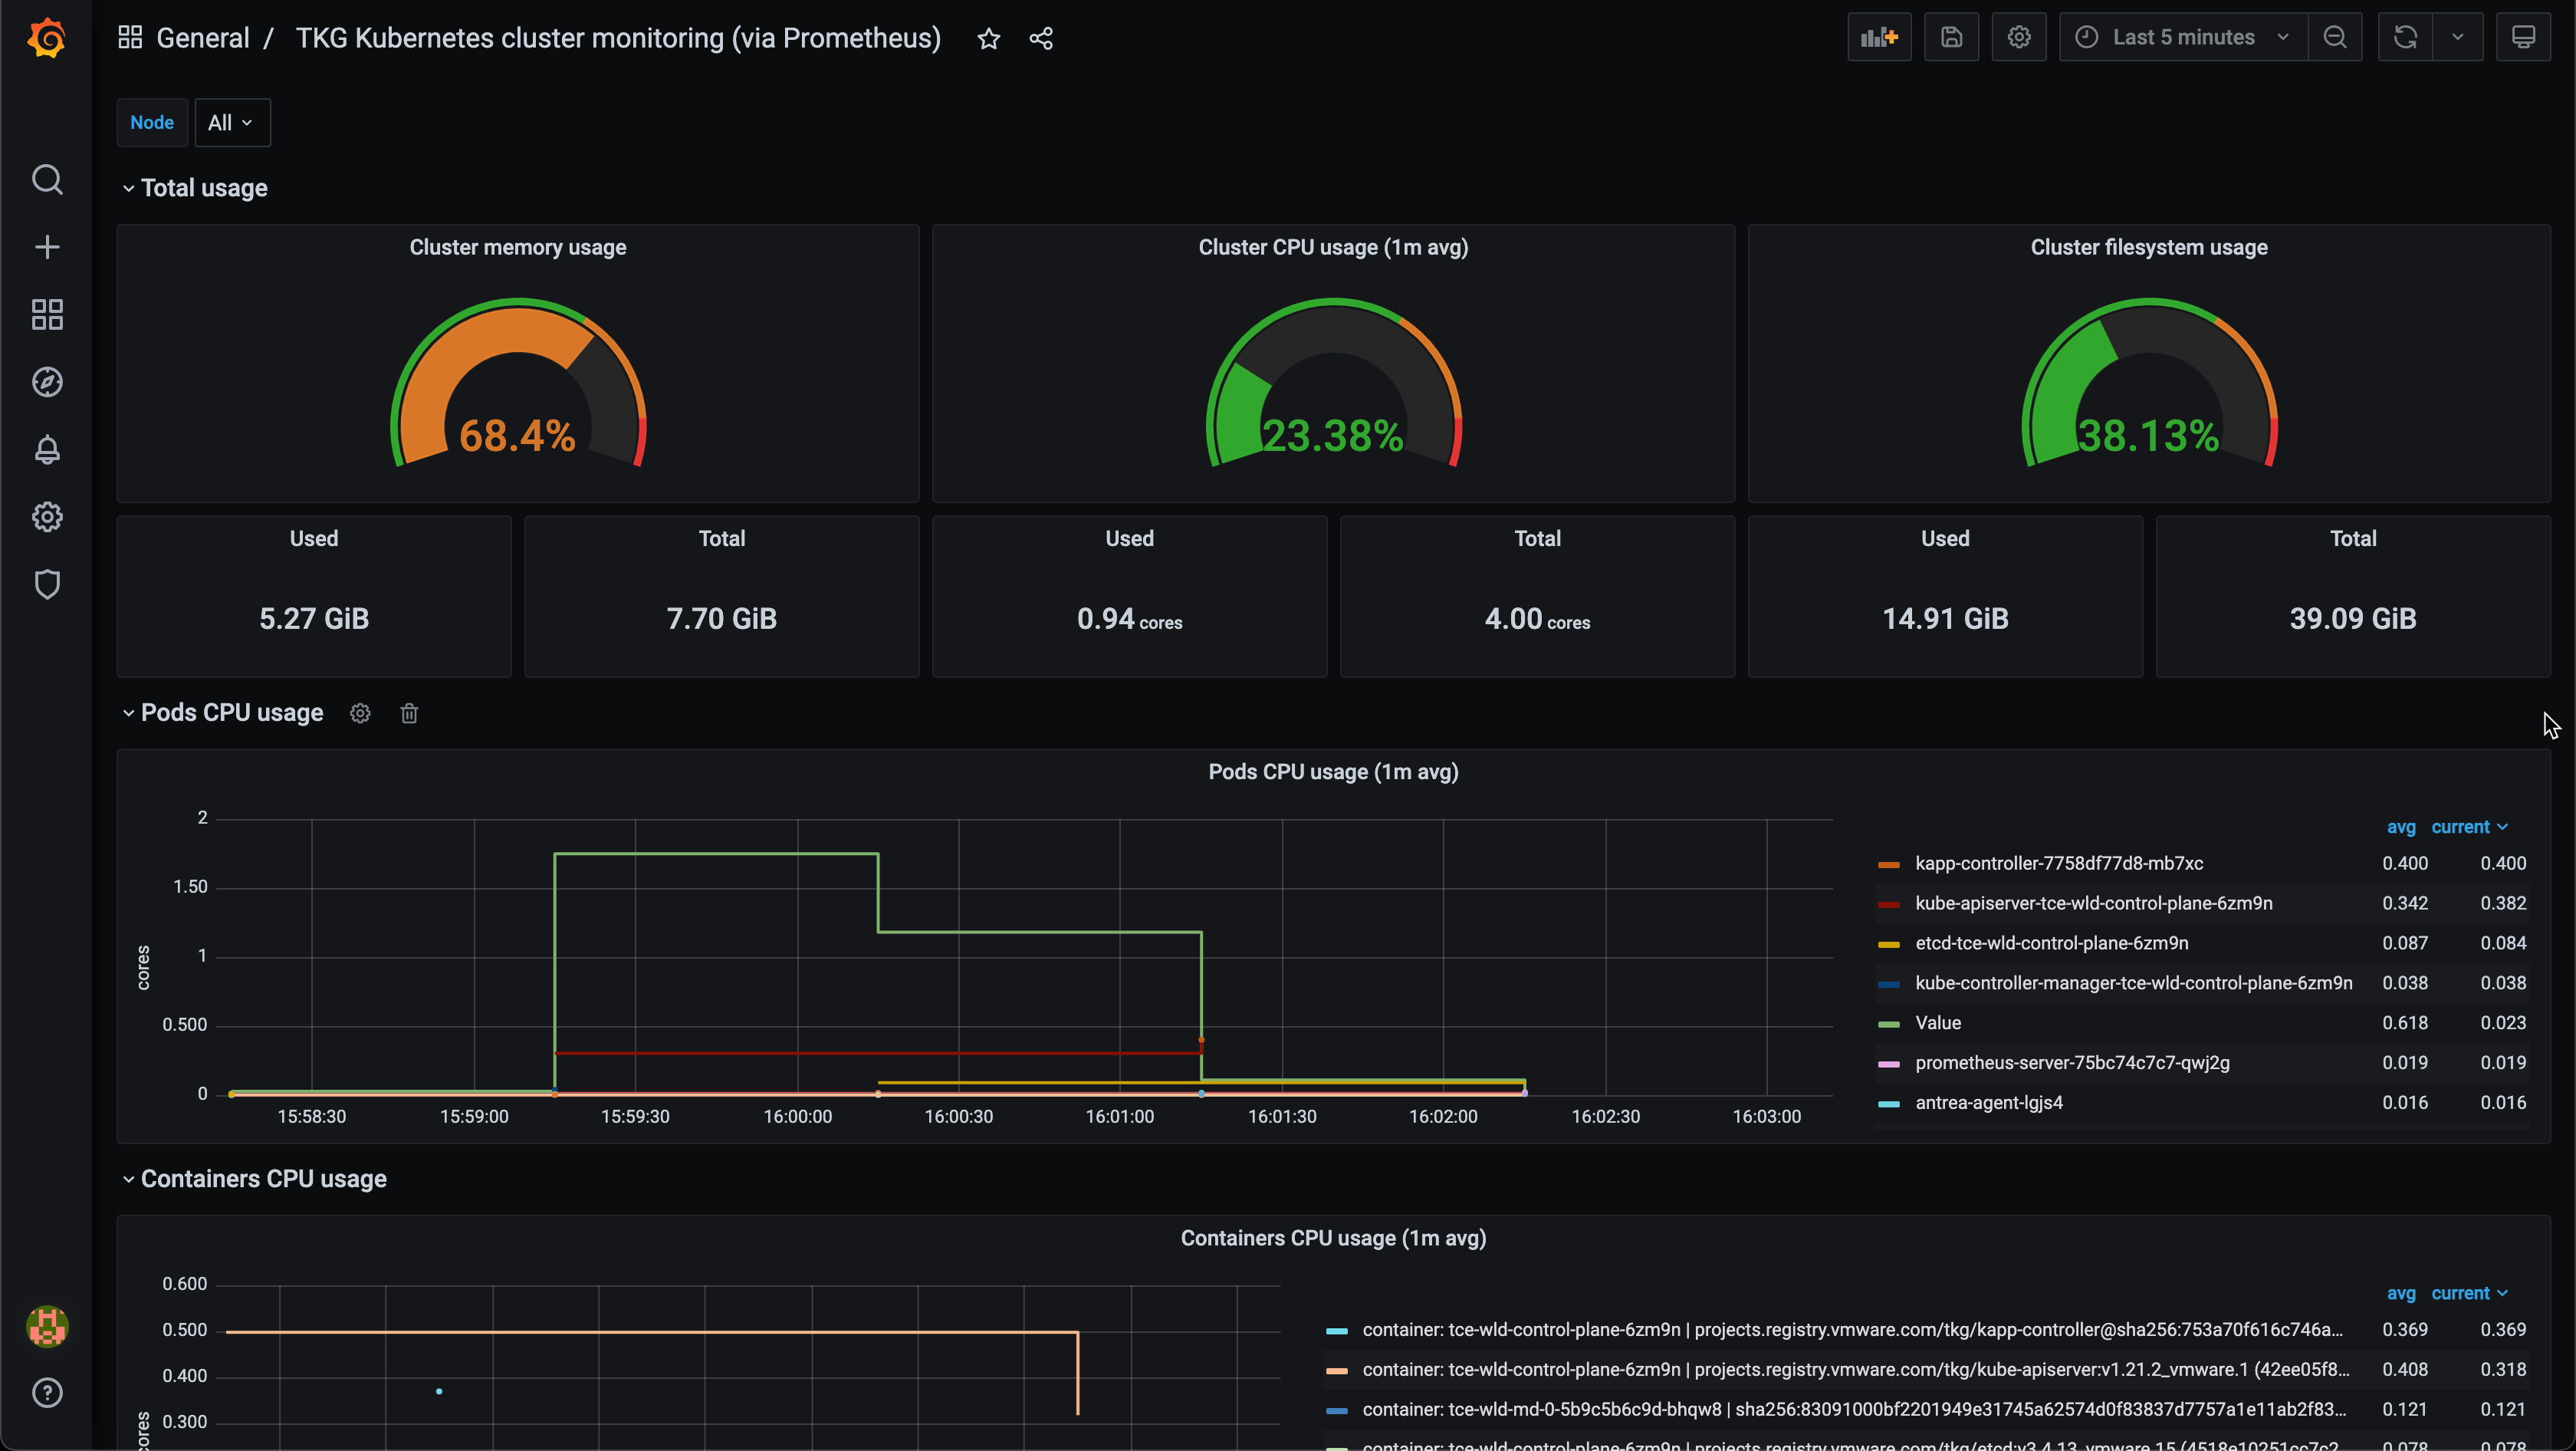
Now that we have both Prometheus and Grafana installed let's see if we can make use of it.
First we'll verify that our Prometheus data source has been added
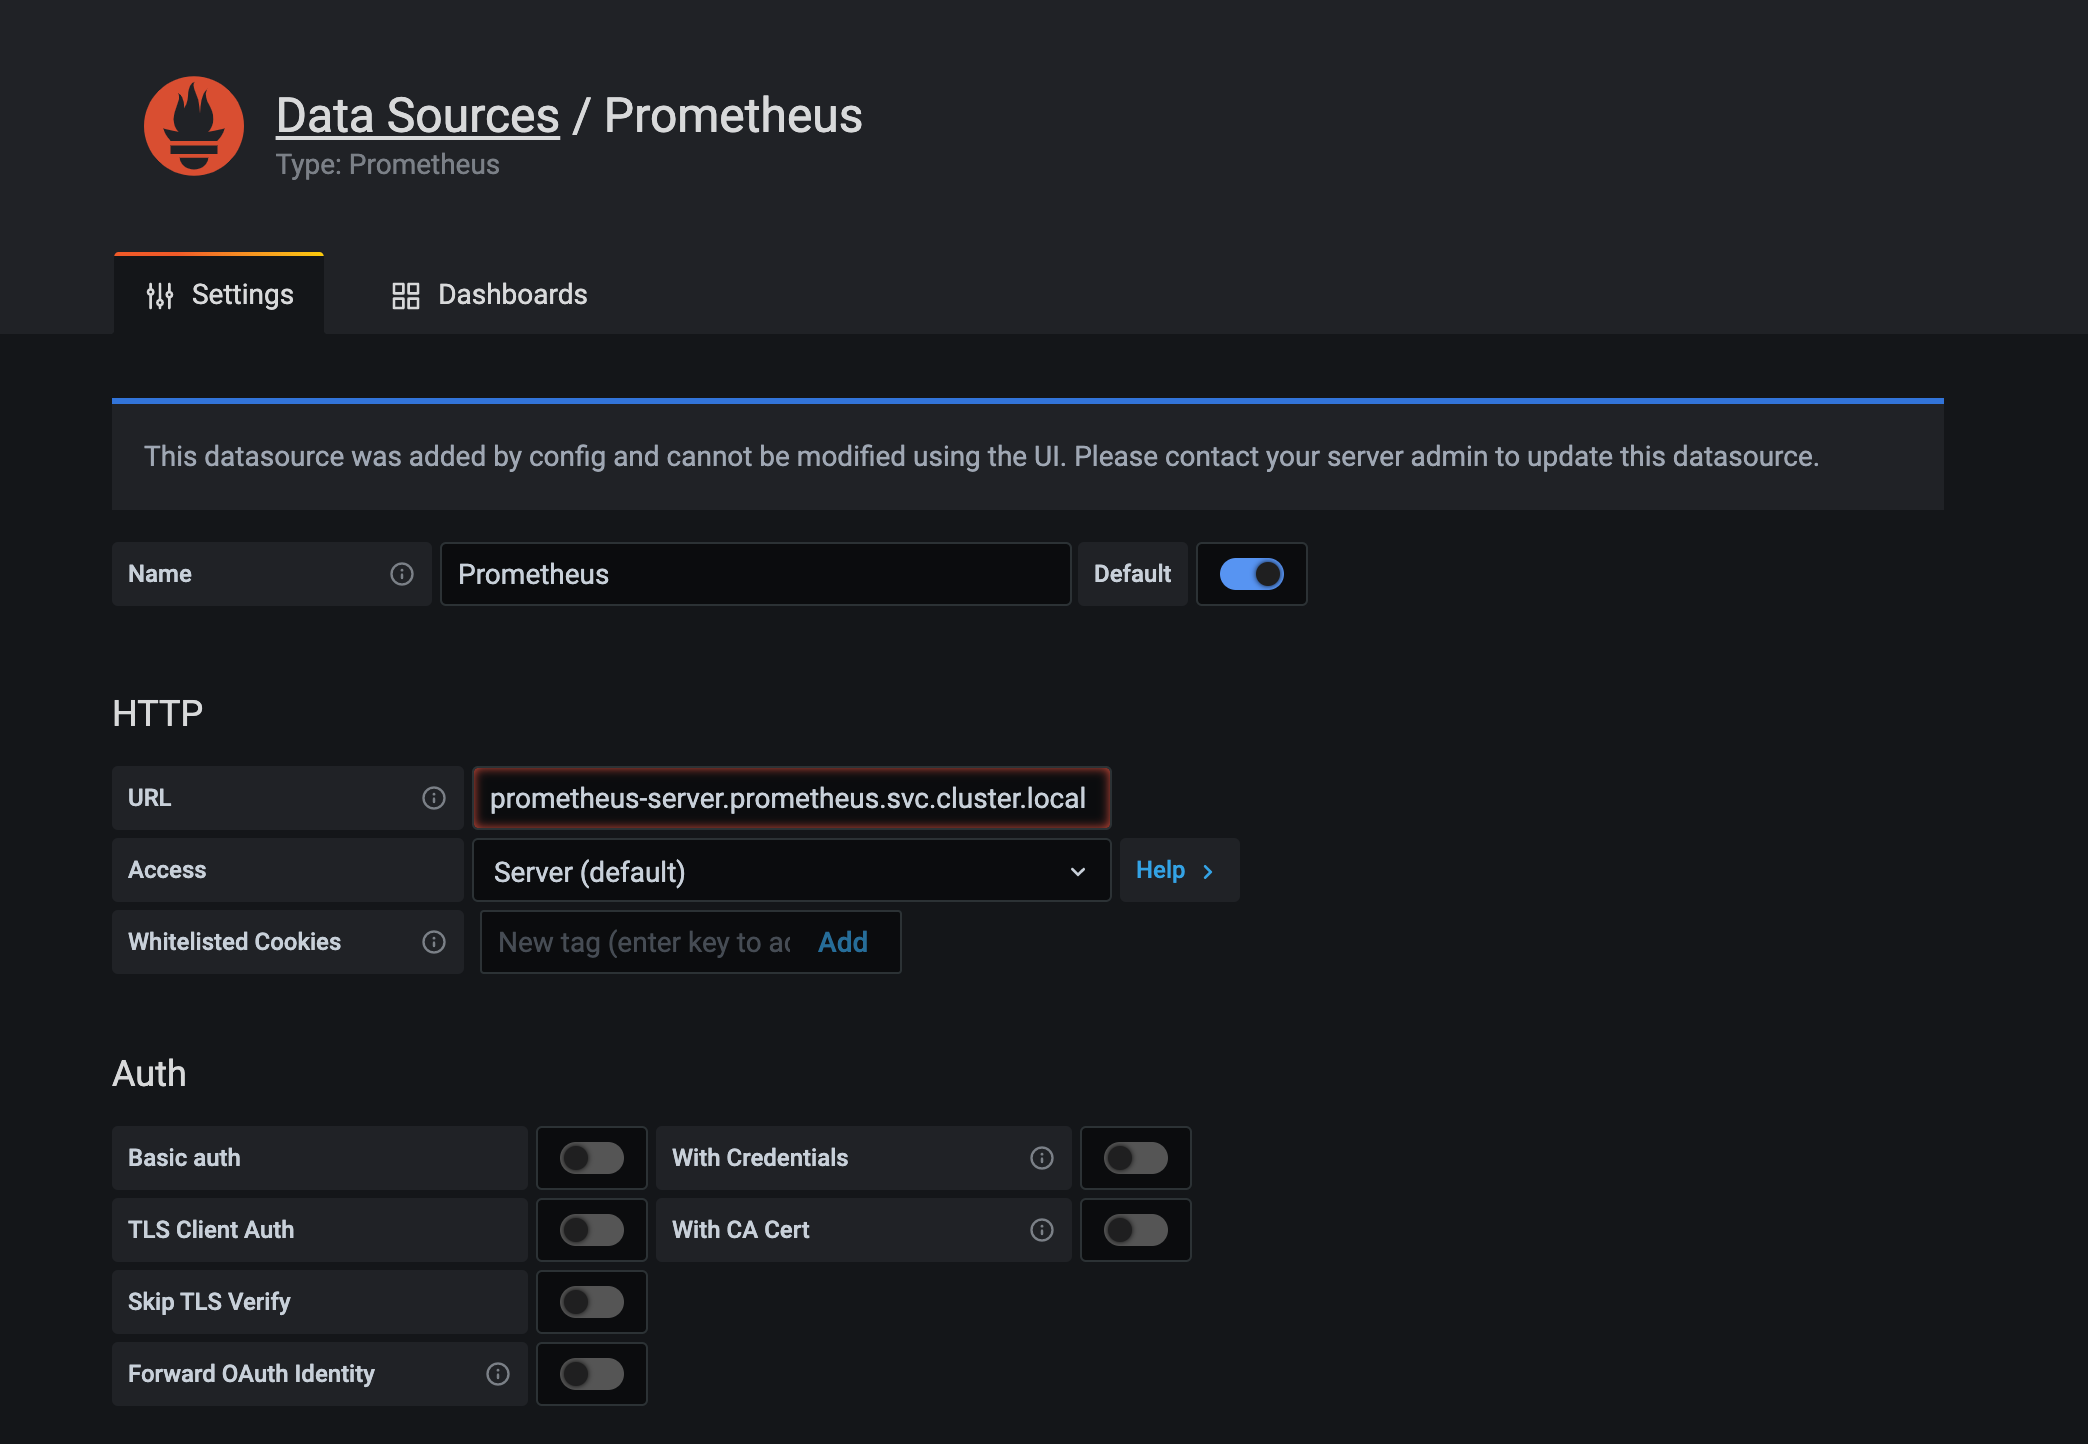
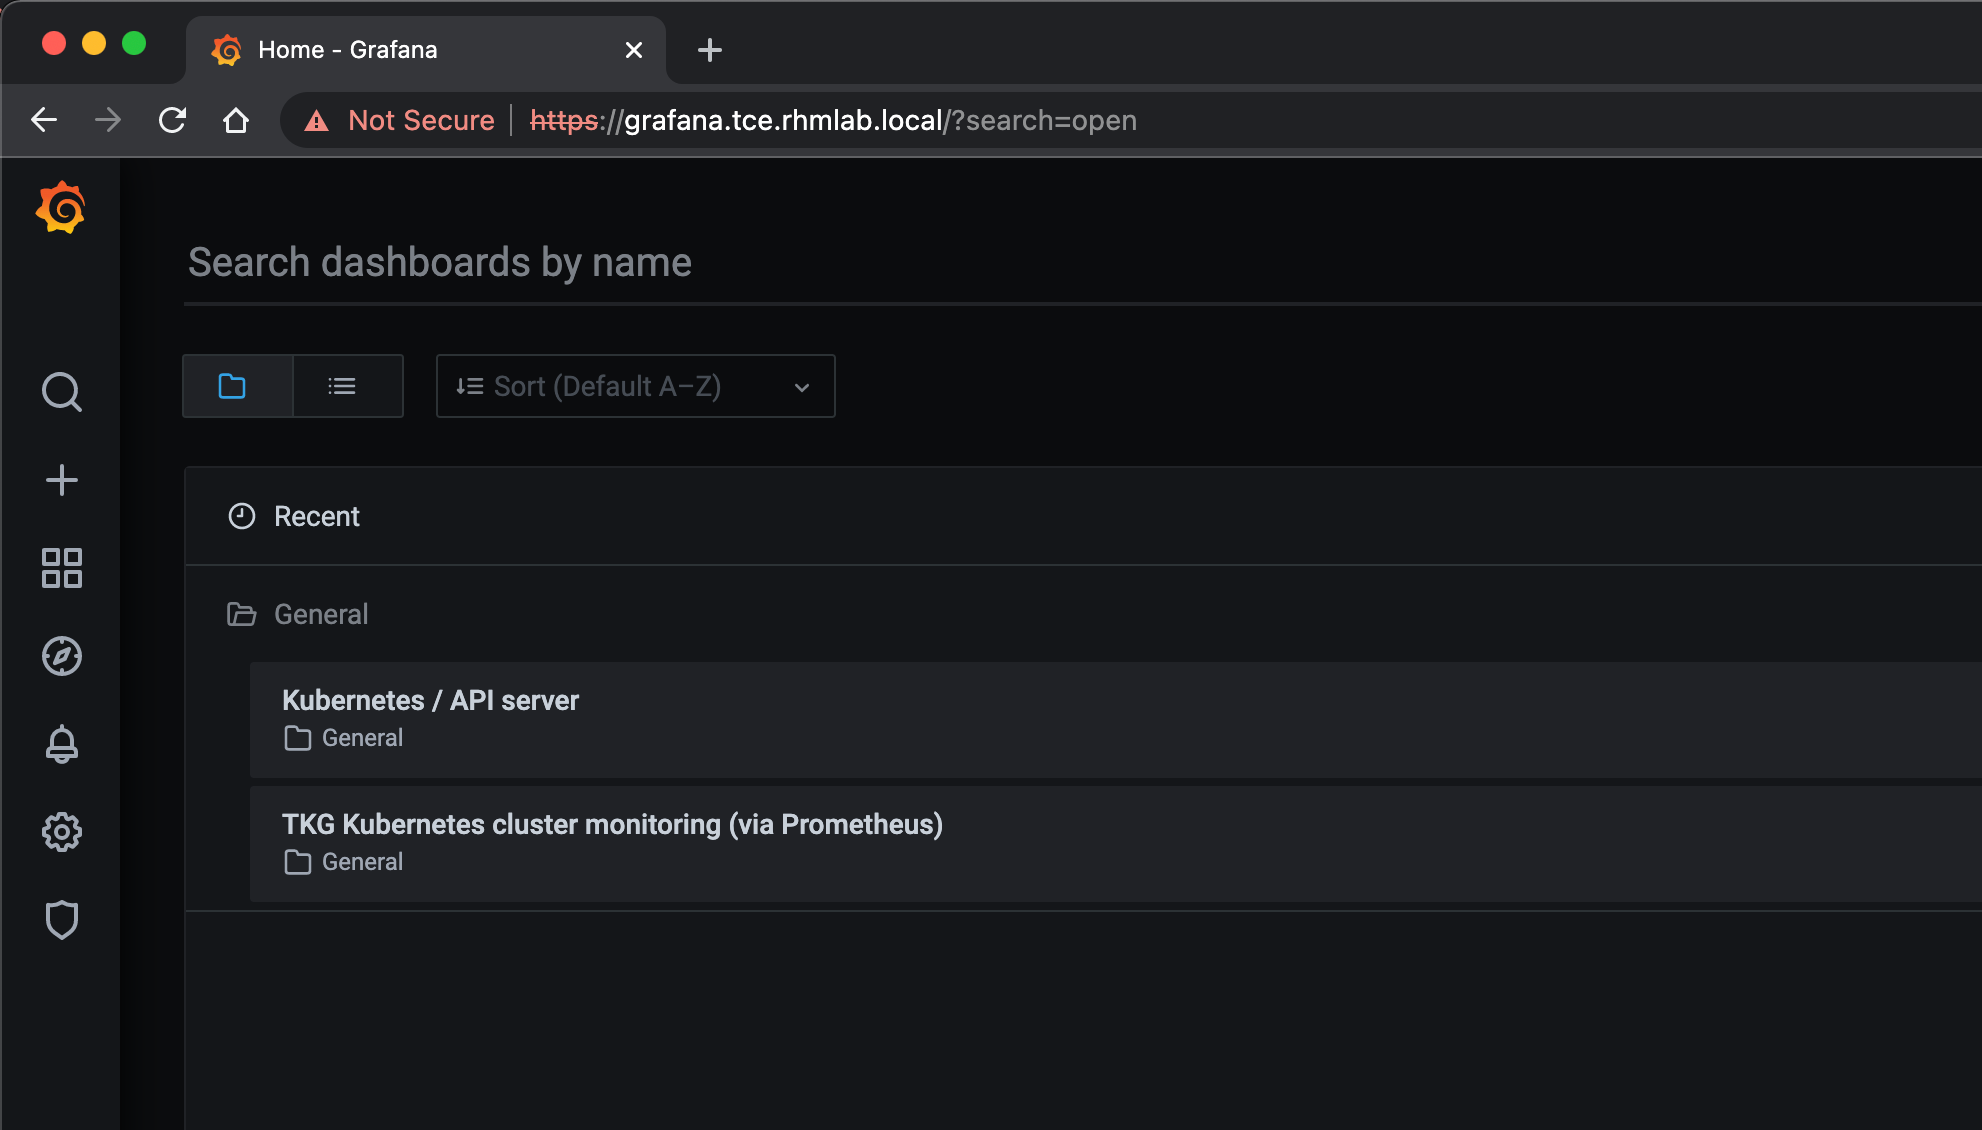
Now, if we head over to the Dashboards menu we can see that the package comes with a couple of pre-built dashboards out of the box.
A note on persistence
Note that we have not configured any persistent volumes for either of the deployed services so if and when the pods or cluster is restarted any additional configuration and historical data is lost
Summary
That concludes this post on how to quickly get Prometheus and Grafana up and running in a TCE cluster. There are other deployment possibilities of course, but for Tanzu platforms I would encourage you to check out the Tanzu packages first.
Thanks for reading!