Monitoring FreeNAS with InfluxDB and Grafana
At work I have done some monitoring projects which I've done many blog posts about. At home I have a small vSphere environment serving partially as a Lab but it also runs some services we use at home. Of course I do monitoring of this environment as well, and I use both InfluxDB and Grafana as we do at work.
One of my VMs runs Plex Media Server and recently I moved my media library to a separate box running FreeNAS. I've used FreeNAS as a part of my lab earlier as an ISCSI target and serving storage for VMs, but it's now only serving my media files to the Plex VM.
FreeNAS monitoring
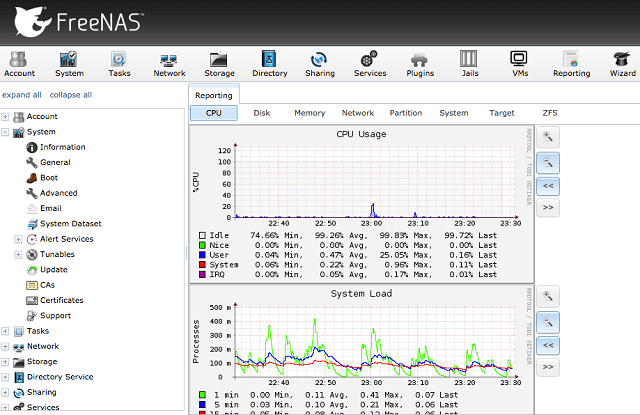
FreeNAS builtin monitor
The FreeNAS has it's own performance monitoring available through the Web GUI, but of course I have wanted to incorporate it in my own monitoring solution. I'm not very familiar with the FreeBSD OS which FreeNAS runs on, and I wasn't very keen on installing any agents on it.
I came across the sexigraf.fr project recently and it turns out that they have a solution for pulling the FreeNAS data as FreeNAS supports an external Graphite target for it's performance metrics since version 9.10. Inspired by the sexigraf project I looked into how I could extend my Influx and Grafana solution to include data from FreeNAS.
As mentioned FreeNAS can send data to a Graphite target, and this is also one of the components behind the covers of the sexigraf project.
Graphite is something I've wanted to check out and Grafana supports it as a datasource, but as I know that InfluxDB also can serve as a Graphite target I thought I'd use that as a start.
InfluxDB
To get Influx accepting Graphite metrics you enable it through the config file.
[[graphite]]
  # Determines whether the graphite endpoint is enabled.
  enabled = true
  database = "graphite2"
  retention-policy = ""
  bind-address = ":2003"
  protocol = "tcp"
  consistency-level = "one"
After updating the configuration you need to restart InfluxDB and allow the Graphite data through your firewall (this depends on your OS setup).
systemctl restart influxdb
firewall-cmd --add-port=2003/tcp --zone=public --permanent
firewall-cmd --reload
This should be all for having your InfluxDB accepting and processing Graphite data from the FreeNAS.
Over in your FreeNAS GUI you need to go to the System tab, then select Advanced. To the end of that page you'll have a setting for specifying your Remote Graphite Server Hostname.
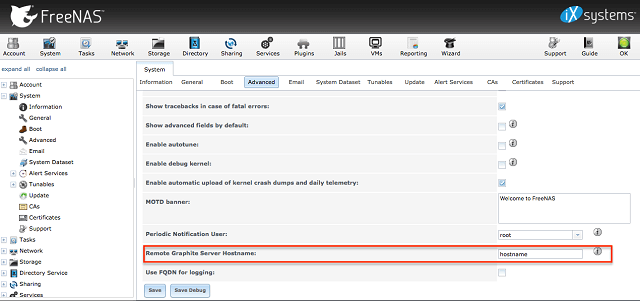
FreeNAS setting
With that you should have some Freenas metrics over in your InfluxDB!
One thing to be ware of is that with no additional configuration the metrics will come in in the format such as: servers."freenas_hostname".aggregation-cpu-sum.cpu-system. While this works this creates lots of measurements with long names, and the points are written without any tags. This means that if you have multiple FreeNAS hosts you want to pull metrics from you'll have separate sets of measurements for them.
Influx supports Templating where you can do some matching to extract tags from the metric name. For now I've only done some basic matching to extract the hostname, but you can find more details over at the InfluxDB documentation.
In my InfluxDB config file I've uncommented the Templates section in the Graphite settings and added the line "servers.* hostname.resource.measurement*"
templates = [
  "*.app env.service.resource.measurement",
  "servers.* .host.resource.measurement*",
  # Default template
  #"server.*",
]
Note that I also had to comment the "server.*" line or else the InfluxDB wouldn't start.
This template does what I need it to, it extracts the hostname from the measurements and it removes the "servers" prefix. Ideally you'll want to do some more adjusting, maybe for some specific metrics to extract a bit more.
As an example, with the current template the measurement "s__ervers.hostname.df-mnt-media.df_complex-free" translates to the measurement "df_complex_free" with the "df-mnt-media" as a tag with the key "resource" and the "hostname" as a tag with the key "host". This means I have one free space measurement for all the different volumes which can be separated by the resource** tag.**
On the other hand the measurement "servers.freenas_rhmlab_net.geom_stat.geom_busy_percent-ada0" translates to the measurement "geom_busy_percent-ada0" with the "geom_stat" as a resource tag together with the hostname as a host tag.
I will look into this going forward, but for now I'm happy with things as they are so let's create some graphs!
Grafana
I won't go in to much detail on how to get started with building dashboards in Grafana. I've written about it earlier, and you should also check out the documentation.
For my FreeNAS box I've built a dashboard containing several panels/graphs. At the top we have some "singlestat" panels containing the current status on different metrics. You'll also see some graphs on the CPU usage and System load. Notice at the top left that we have a dropdown where you can select which host you want to focus on. In my environment there's only one.
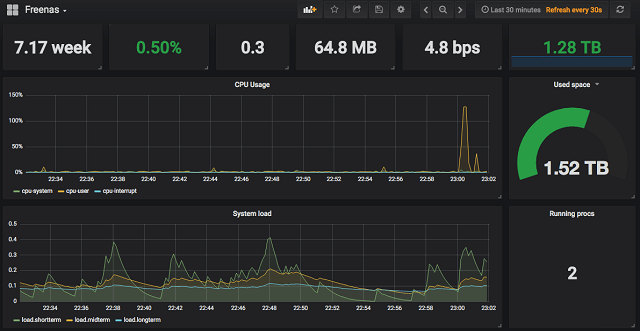
Grafana dashboard
Next there's some graphs for disk metrics, I've selected Disk Ops, latency and busy as my key metrics concerning disks.
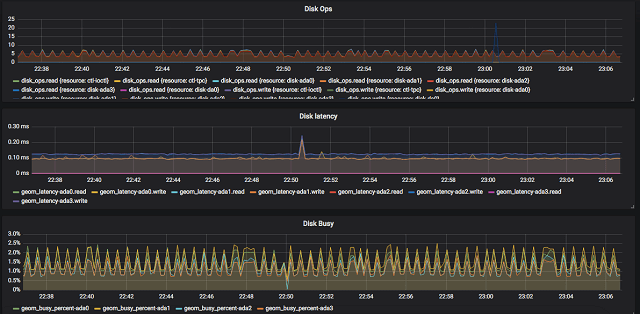
Disk metrics
The dashboard finishes of with the CPU temperature, the Network interface usage and the Disk usage.
Note that the CPU temperature from the FreeNAS box is reported as Kelvin and it's multiplied with 10. In Grafana I've added a math operator to the value which extracts 2731.5 from the value which should give you the Celcius value multiplied with 10 (as of now you can't do multiple math functions).
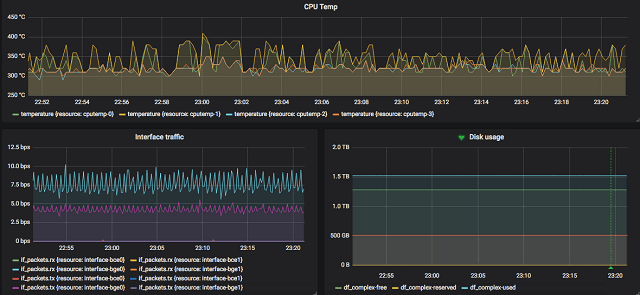
Freespace and network
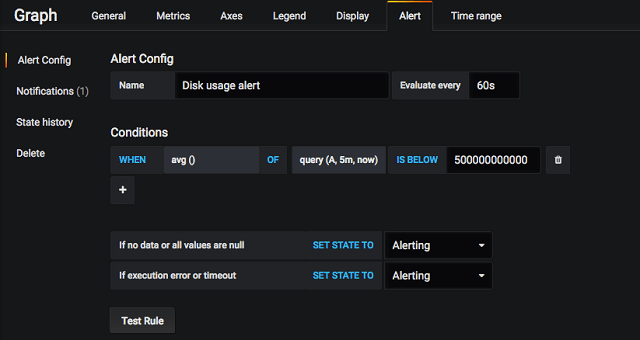
For Disk usage I've also added some alerting (notice the Heart symbol on the bottom right graph). Here I'm specifying a threshold for the disk freespace, and if Grafana notices that the average value is below that for 5 minutes it will send an alert to a Slack workspace. Grafana has many builtin notification channels. Check out their documentation for what's available and how to set it up
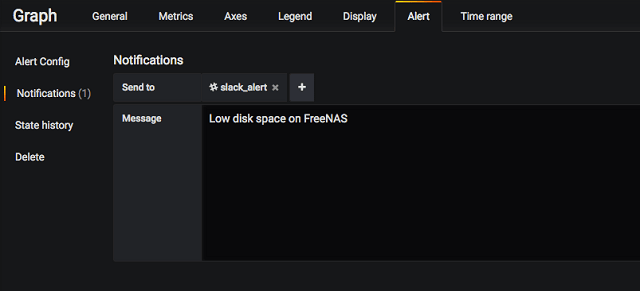
An alert in Slack would look something like this.
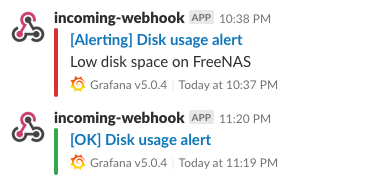
Slack alert
Note that you cannot use variables in the query you are alerting on, so I've hardcoded the hostname in that query.
The dashboard json file is available on GitHub
Summary
Finally I can have some insights in to my FreeNAS box without having to log in to the GUI. It's really exiting to see the strength of Open source tools like InfluxDB and Grafana and that ease of building your solutions around them.
Happy monitoring!