vSphere Performance - Telegraf, InfluxDB and Grafana 7 - Configure InfluxDB Authentication and https
Overview
Intro
This is the eleventh part of a blog series about Telegraf, InfluxDB and Grafana where we use vSphere performance data as our metric data.
In the last post we discussed a few dashboards I've created that makes use of the features we've discussed so far in this series.
In this post we'll focus more on InfluxDB it self, and how to set up some authentication.
The posts in this series build on each other, but you should hopefully be able to use them as reference if you're just jumping in to a specific post. I am using vSphere performance data from an InfluxDB database pulled by Telegraf for my examples.
InfluxDB security
By default, when you install InfluxDB there will be no authentication set up on the database, and it uses http as the protocol.
Although this makes it very easy to get up and running, it might be wise to set up authentication and authorization on your InfluxDB instances.
Be aware that even though the authentication is enabled through the [http] section of Influx's configuration it also affects the CLI as this uses the http API behind the scenes.
In addition to enabling authentication it's wise to enable https for InfluxDB so that the communication through the API is encrypted. Let's start with the certificates.
Enable SSL
In this example I'll create a self-signed certificate on the VM running InfluxDB. Normally you'll request and get the certificate from a central PKI.
1openssl req -x509 -newkey rsa:4096 -keyout /etc/ssl/key.pem -out /etc/ssl/cert.pem -days 365 -nodes
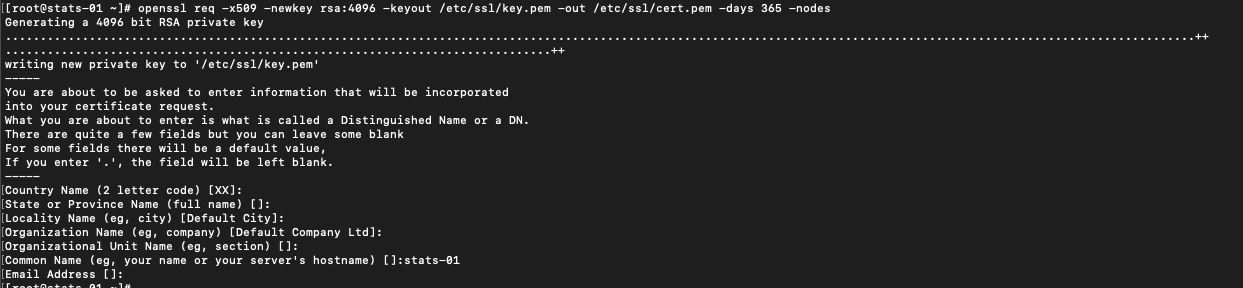
Note that I'm not setting any passphrase for the key.
Now let's make use of these in Influx. We'll open up the InfluxDB configuration file
1vi /etc/influxdb/influxdb.conf
We'll scroll down to the [http] section, and change the following lines
1  # Determines whether HTTPS is enabled.
2    https-enabled = true
3
4  # The SSL certificate to use when HTTPS is enabled.
5    https-certificate = "/etc/ssl/cert.pem"
6
7  # Use a separate private key location.
8    https-private-key = "/etc/ssl/key.pem"
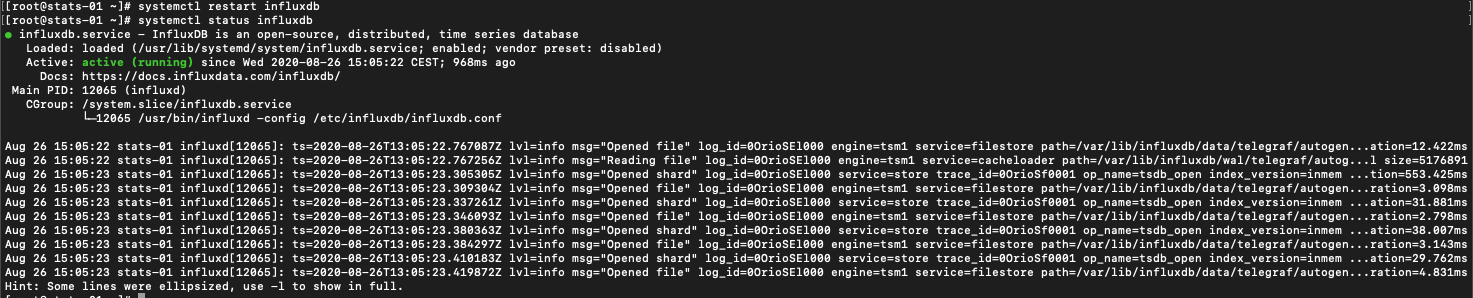
Now save the file, and restart the InfluxDB service, and also check that the service is running after the restart
1systemctl restart influxdb
2
3systemctl status influxdb
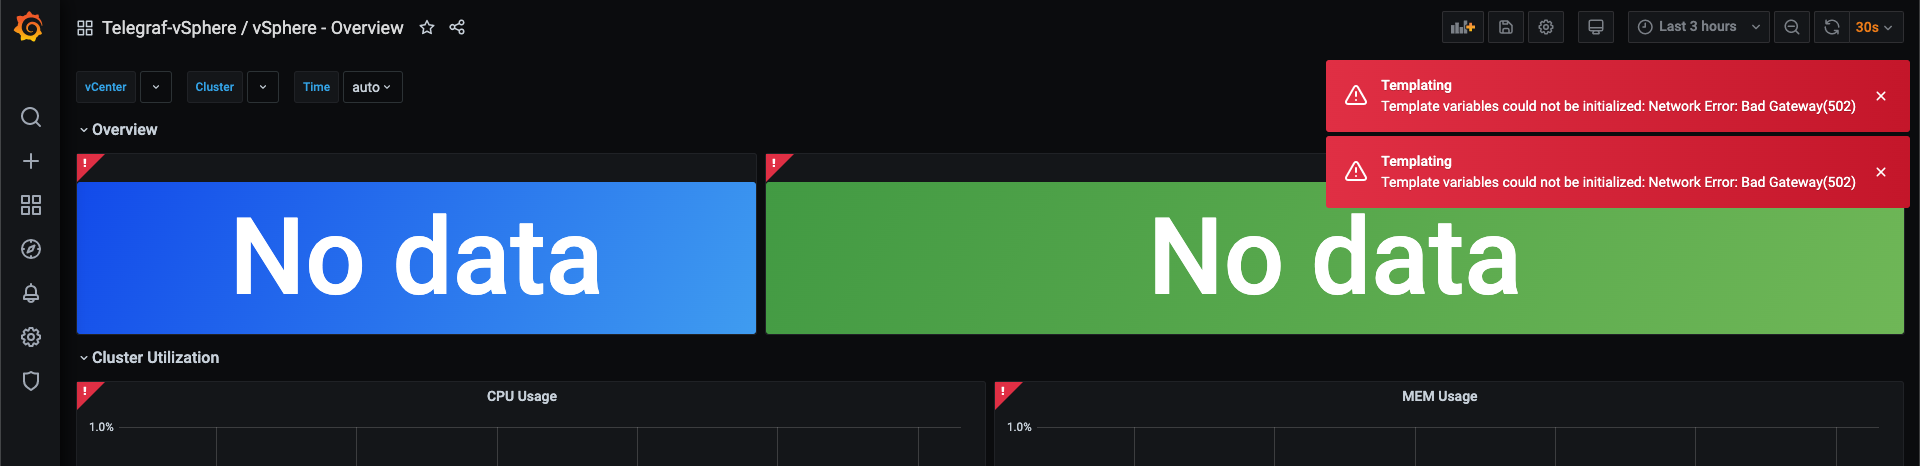
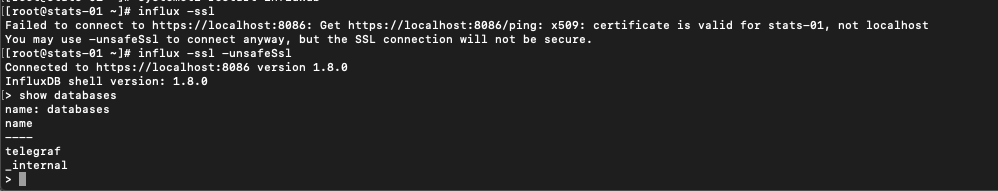
Remember that I mentioned that the influx CLI is using the API behind the scenes? If I try to access the CLI without specifying anything I should get a message stating that the connection is refused
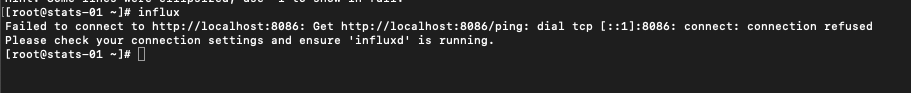
This is now also affecting Grafana, and Telegraf that collects data.
Before fixing Grafana and Telegraf, let's verify that SSL is working through the CLI. We'll start the CLI with the -ssl parameter. You might also need to add the -unsafeSsl parameter like in my example
1influx -ssl -unsafeSsl
Configure Telegraf to use SSL
Now that Influx is working through https we need to update the Telegraf config to reflect this.
We'll have to edit /etc/telegraf/telegraf.conf and the [[outputs.influxdb]] section. First we'll edit the urls option to use https (note that if you're running Telegraf on the same server as InfluxDB this might be commented), and we will also change the insecure_skip_verify option to true if we're using self-signed certificates
 1[[outputs.influxdb]]
 2  ## The full HTTP or UDP URL for your InfluxDB instance.
 3  ##
 4  ## Multiple URLs can be specified for a single cluster, only ONE of the
 5  ## urls will be written to each interval.
 6  # urls = ["unix:///var/run/influxdb.sock"]
 7  # urls = ["udp://127.0.0.1:8089"]
 8   urls = ["https://127.0.0.1:8086"]
 9
10  -----
11
12   insecure_skip_verify = true
Now restart the Telegraf agent to update the configuration
1systemctl restart telegraf
Configure Grafana to use SSL
Over in the Grafana UI we will go to our Datasource configuration and find our InfluxDB datasource. Edit the URL and optionally enable the Skip TLS Verify
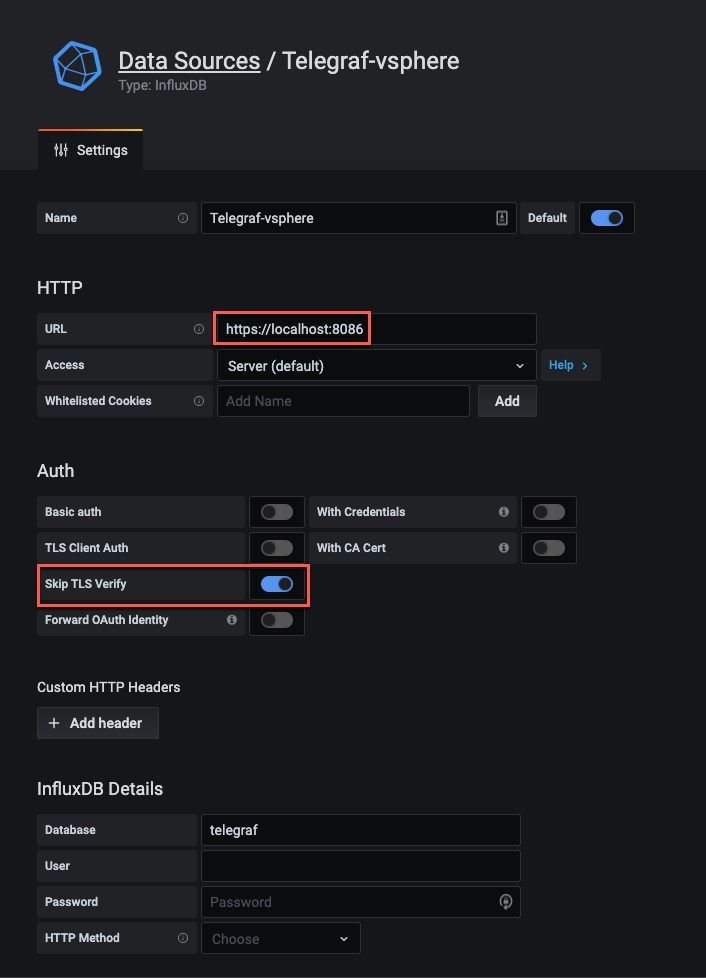
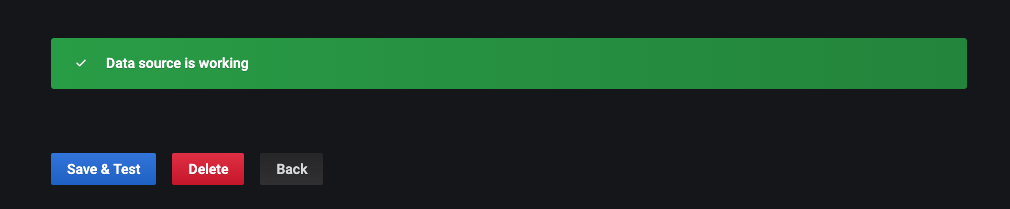
Click Save & Test to verify that the datasource is working
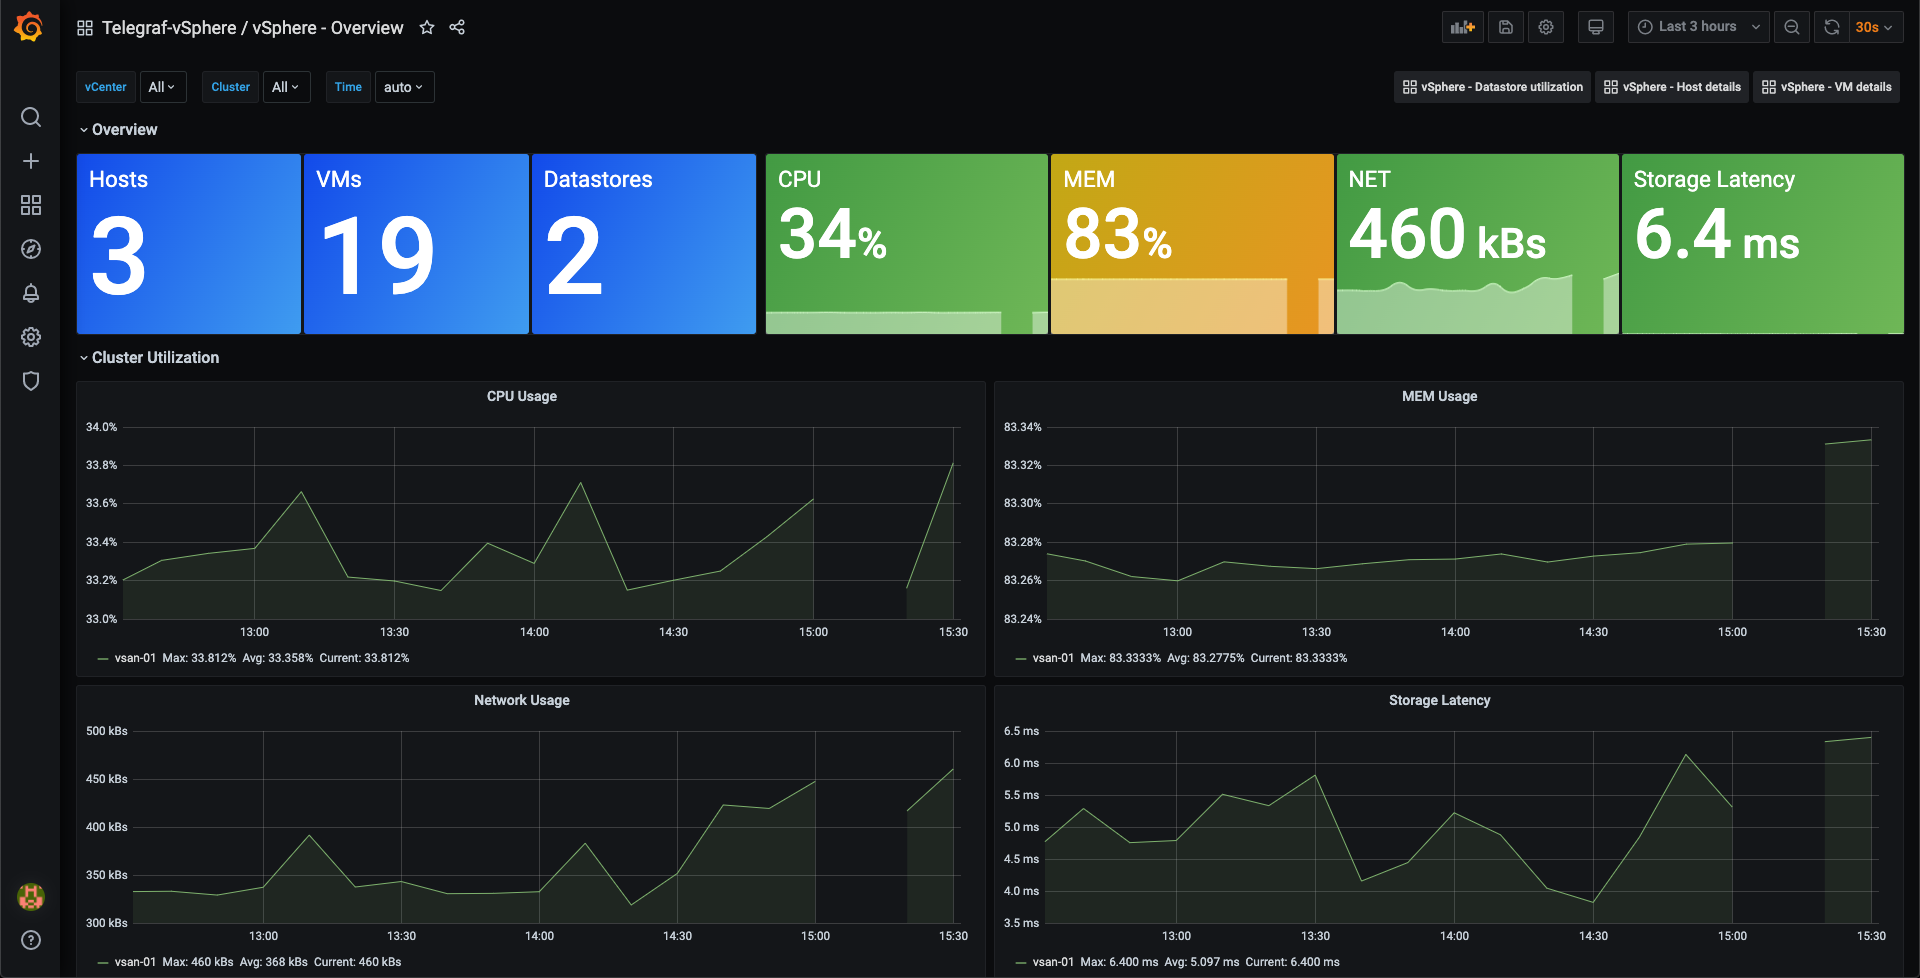
Finally verify that our dashboards is yet again showing data. Note that there are a small gap in our graphs, this is the time when Telegraf wasn't able to access Influx through the API
So, we have InfluxDB configured to use SSL, and both Telegraf and Grafana is updated to contact Influx with the new configuration.
Now let's add some authentication to InfluxDB.
Authentication
Before enabling authentication in InfluxDB it's a good idea to read through the documentation on that topic. Both to learn the available roles, and also to note that Influx expects you to create atleast one admin user before enabling authentication
In my setup I will create three InfluxDB users:
- One admin user for administrative tasks
- A user for writing data
- A user for reading data.
If you have multiple databases in your setup you might want to add more users and separate access on the individual databases.
Create user accounts
The process of creating user accounts is documented here
Users are created with the CREATE USER command, and privileges granted with the GRANT [READ, WRITE, ALL] command. The admin user will get it's privileges granted upon creation
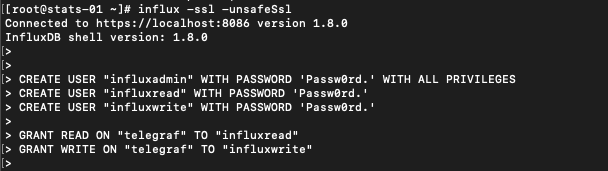
In my case I'll create the admin user first, then the read and write users, and finally give the privileges on the Telegraf database
1CREATE USER "influxadmin" WITH PASSWORD 'Passw0rd.' WITH ALL PRIVILEGES
2CREATE USER "influxread" WITH PASSWORD 'Passw0rd.'
3CREATE USER "influxwrite" WITH PASSWORD 'Passw0rd.'
4
5GRANT READ ON "telegraf" TO "influxread"
6GRANT WRITE ON "telegraf" TO "influxwrite"
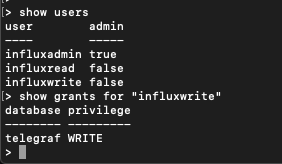
We can verify that our users have been created and the grants given
Enable authentication
Now it's time for enabling authentication in the InfluxDB configuration file. The option to change is the auth-enabled which needs to be set to true
1auth-enabled = true
Now restart the InfluxDB service
1systemctl restart influxdb
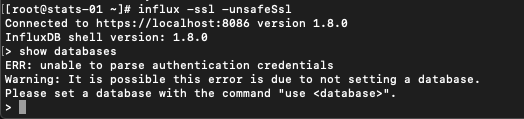
If we now start the Influx CLI we can see that we can start it, but as soon as we try to run a command we get an error stating that we're not authenticated
Let's run the auth command inside the CLI and specify our admin credentials
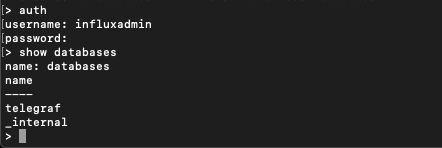
Now we can run our commands.
Note that you can login to the CLI while starting it. Check the documentation for more information
Configure Telegraf to use authentication
Now, we need to tell Telegaf to use our write user when writing to InfluxDB. We'll modify the username and password options under the [[outputs.influxdb]] section in /etc/telegraf/telegraf.conf
1## HTTP Basic Auth
2username = "influxwrite"
3password = "Passw0rd."
In this example I'm putting the credentials in the config file itself. Please note that this is a security risk
Again, restart Telegraf to make the configuration change
1systemctl restart telegraf
Note. If you, like in my example, create a non admin user for writing to InfluxDB you also need to specify skip database creation in the Telegraf config
It seems that Telegraf will try to create the database even though it already exists, hence you'll get an error message
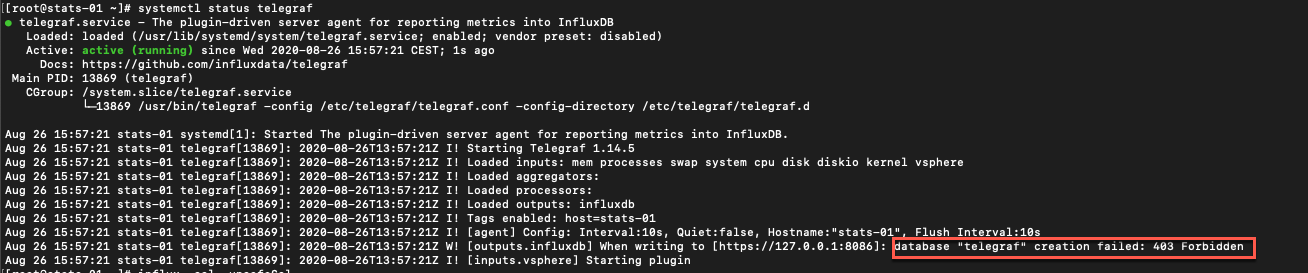
Change the skip_database_creation option in the Telegraf [[outputs.influxdb]] section to true and restart Telegraf, and you should be fine
Configure Grafana to use authentication
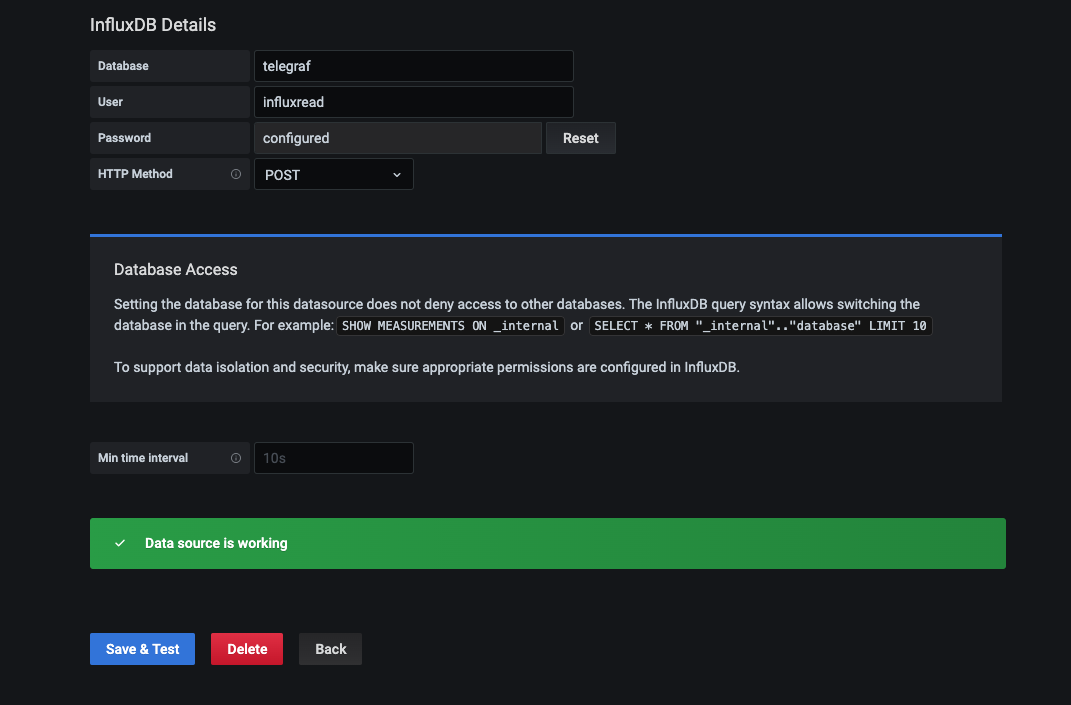
Now, let's update our Grafana datasource to use authentication for InfluxDB so that our dashboards works.
Note that I'm now using the Read user
Summary
This post was all about how to get https on our InfluxDB server and how to set up InfluxDB authentication. We saw how to specify different authorization levels on InfluxDB users and then how we configured Telegraf and Grafana to use those users when connecting to Influx.
Thanks for reading, and as always, feel free to reach out if you have any questions or comments