Running Plex on a Tanzu Community Edition Kubernetes Cluster
Update 2022-10-21: After just one year in the wild VMware announced on Oct 21 2022 that they would no longer update or maintain the TCE project and that by end of 2022 the Github project will be removed. For more information check out my blog post here
Most of the things mentioned in this post (outside of installing TCE) should still be valid for other Kubernetes distributions
As part of the VMware vExpert Applicaton Modernization group I was invited to be a part of a Tanzu Challenge this month. The task was to get a Plex solution up and running on Tanzu Community Edition (TCE) cluster. The solution should be "production grade", including both management and protection of the data and configuration, monitoring, logging and recovery/high availability.
As I wanted to get my hands dirty with TCE this was a golden opportunity and something I was happy to take on.
The work towards delivering on the challenge has resulted in many different blog posts
- TCE Cluster on vSphere
- Using MetalLB as a load balancer in a Kubernetes cluster
- Installing Contour on a Tanzu Community Edition cluster
- Deploy Prometeheus and Grafana on a Tanzu Community Edition cluster
- Deploying Harbor registry with Tanzu Packages
- Deploy ExternalDNS on TCE and integrate with a Microsoft DNS server
- Deploy Velero for backup and restore in a Tanzu Community Edition (TCE) cluster
Getting Plex to run on Docker in general and Kubernetes in particular was not an easy task and there's still things I'd want to get in place for this solution, like more security measures for the pods and other Kubernetes resources (network policies, service accounts etc), SSL integrated with Vault or an external PKI like Let's encrypt, some kind of a pipeline to orchestrate the deployment of the solution, etc.
Please note that when I'm talking about the struggles to get this up and running I'm primarily thinking of how to have the PMS, Plex Media Server, running on Kubernetes accessing my own media. The Plex web server works just fine from the Docker image and can stream online content
In my case I can summarize my struggles with one word, Plex account (ok that's actually two words I guess). Or at least I think this is what made me pull my hair the last couple of days. To tell the truth, I've tested so much back and forth that there might a few things I've forgot and/or misunderstood in the process. I'll discuss that shortly.
Let's first take a look at how I've set up the environment where I'll run my solution
Solution
All yaml and config files mentioned below can be found on this GitHub repository
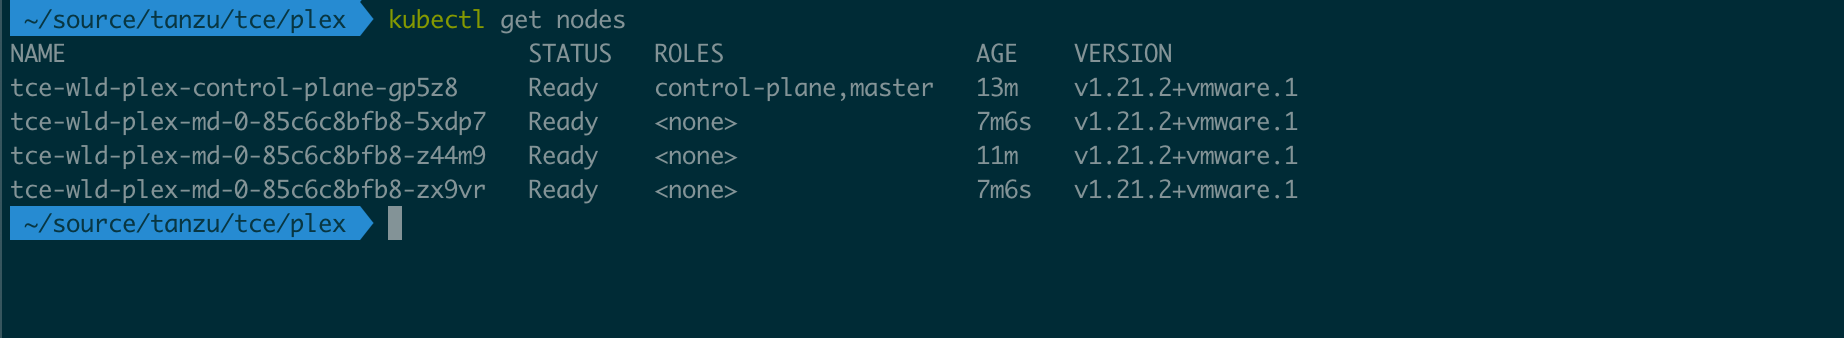
Kubernetes environment
The Kubernetes environment will be running as a Tanzu Community Edition cluster as the challenge dictated. TCE can be deployed on both public cloud, vSphere and even in Docker.
I decided to deploy it on vSphere which I've written about here. In short we'll have a Management cluster deployed and from this Management cluster we can deploy multiple Workload clusters.
My management cluster is set up as a dev cluster with one control plane node and one worker node to save resources in my lab, the workload cluster is also deployed with the Dev plan giving us one control plane nodes, but I have explicitly specified that I want three worker nodes. For a real production cluster we would obviously have three control plane nodes as well, but since this is my lab I need to save where I can.
Network
The network setup for the environment is quite simple. The physical hosts are running on a management VLAN, while the Kubernetes nodes are run on another specific VLAN. Check out my previous post on how to deploy TCE on vSphere for details.
Storage
Storage is a common struggle in Kubernetes and there's a myriad of both options, guides and walkthroughs out there. I have previously worked with NFS storage in Kubernetes, and of course utilized vSAN when working with vSphere with Tanzu.
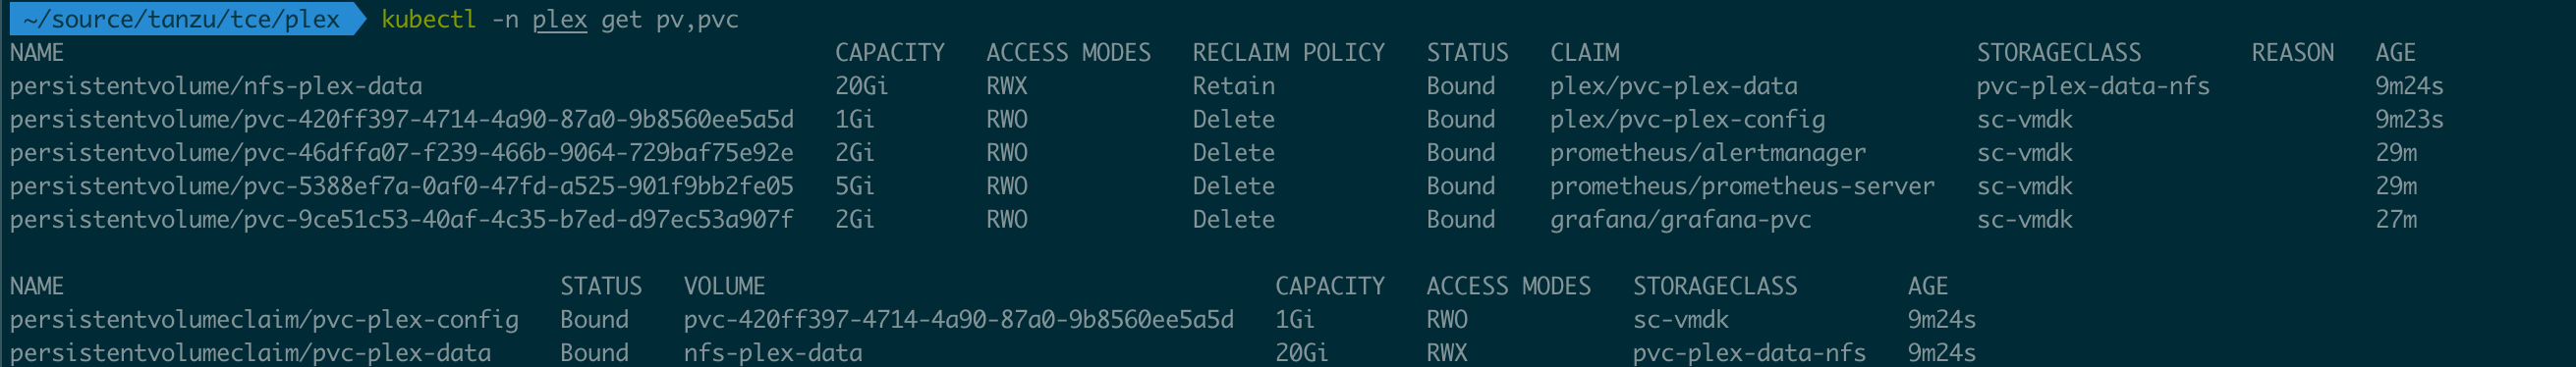
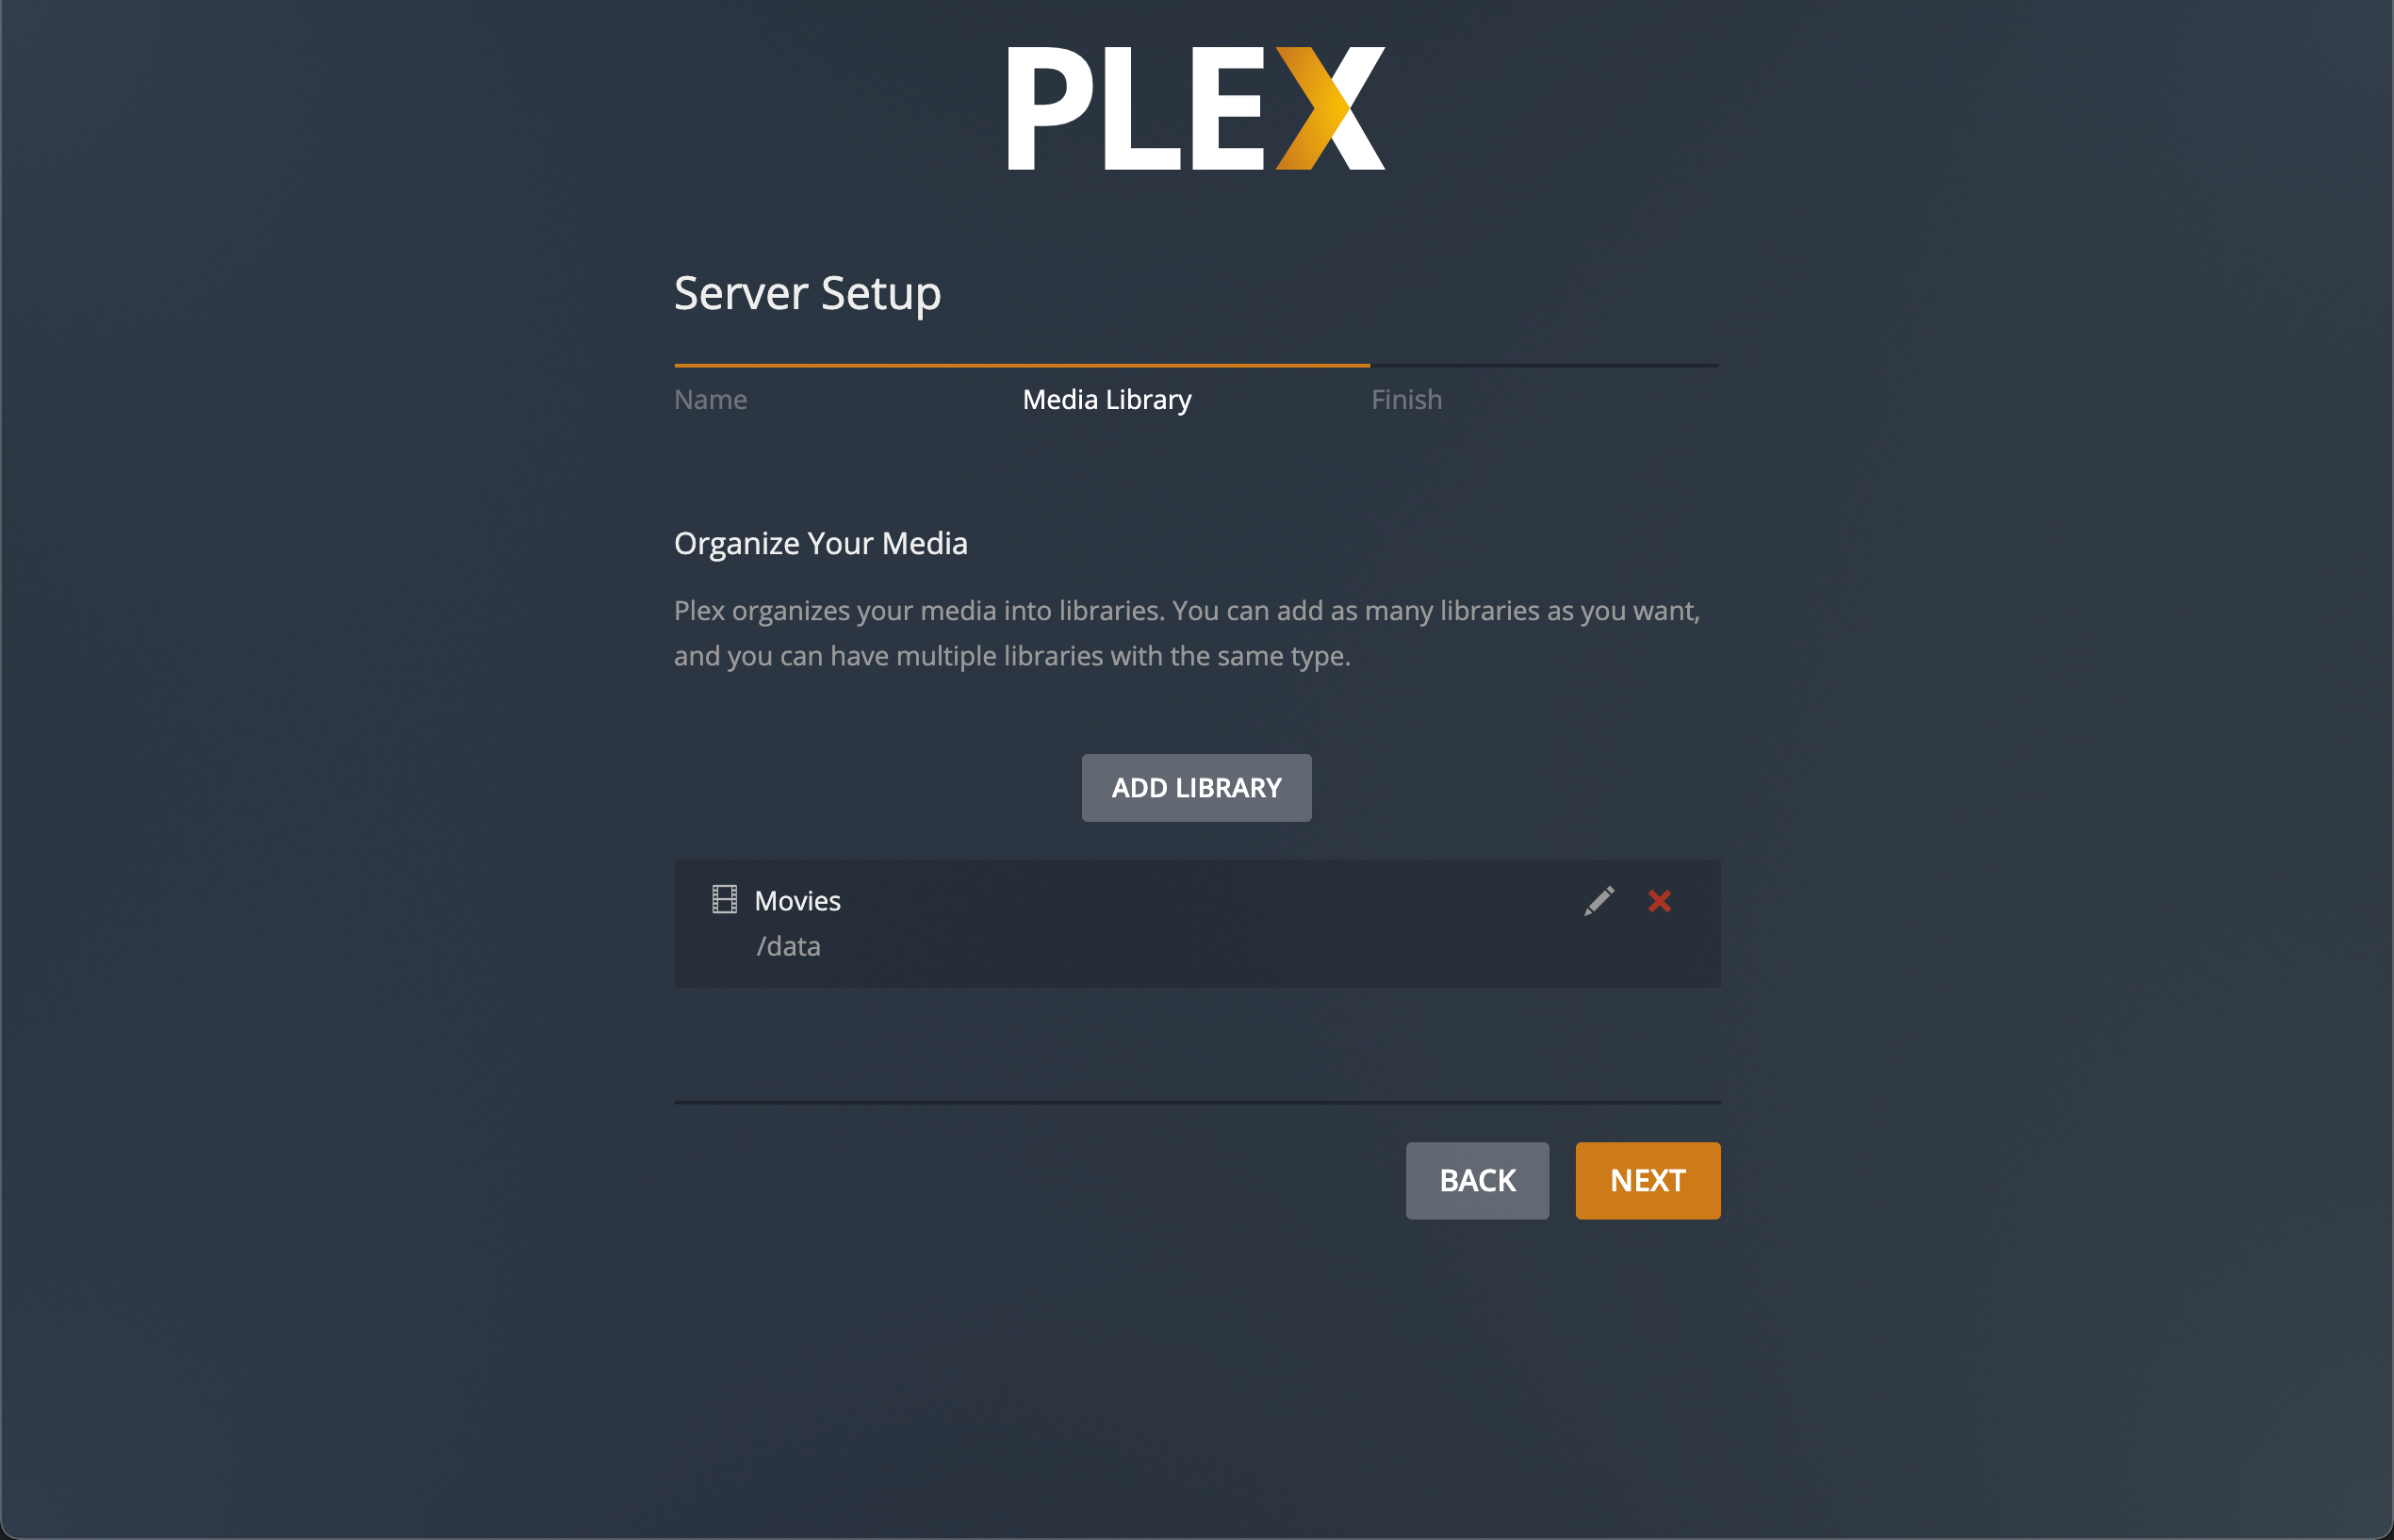
For Plex you need at least two volumes, one for the configuration and database, /config, and one for the media files, /data. There is a third volume in play for transcoding, but I've not set that up in my solution.
The media files in my solution are delivered from a separate NAS server which shares the files through NFS.
Initially I tried to get Plex running on multiple replicas, and with a ReadWriteMany volume. I couldn't get this in my current vSphere environment and I wanted to set up something other than a plain old NFS server, but after a lot of trying and failing I gave up. I found that Plex didn't work out that well with multiple replicas so I decided to revert to a vSphere volume for the config directory, and to use the CSI that get's deployed for TCE when deploying on vSphere.
There is a clusterized Plex community solution out there, ClusterPlex, which you might want to check out if you really want to have Plex running as a proper cluster
For the supporting software discussed below we'll also use vSphere storage in the cases where persistent volumes are required. Although there's a default storage class created at deployment time I've created a specific one pointing to a specific datastore
1kind: StorageClass
2apiVersion: storage.k8s.io/v1
3metadata:
4  name: sc-vmdk
5  annotations:
6    storageclass.kubernetes.io/is-default-class: "false"
7provisioner: csi.vsphere.vmware.com
8parameters:
9  datastoreurl: "ds:///vmfs/volumes/618d662e-9ab79b60-16ee-1c697a01b903/"
With this we can create PVC's pointing to the name of the storage class and the vSphere CSI driver will create a PVC backed by vSphere automatically.
With this said and as mentioned already, storage in Kubernetes can be difficult and this is where a solution like vSphere with Tanzu and vSAN really helps out. This is one of the strongest learning points from this whole thing, having a platform with an easy way to integrate storage saves a lot of time and is something that'll let your developers focus on other things.
Supporting software
One of the cool things with TCE (and the other Tanzu platforms) is that we can utilize the Tanzu Package repository to deploy common supporting software. For our solution we'll use quite a few of these.
- cert-manager will be used to provide the ability to issue certificates
- Contour with Envoy will provide Ingress capabilities
- ExternalDNS will integrate with an external MS DNS server to register our services in DNS
- Prometheus will scrape metrics from the different parts of our environment
- Grafana will let us visualize the metrics in dashboards
- FluentBit will be used to push logs to an external syslog server
- Velero will be used to provide backup and restore functionality
In addition we'll install
- MetalLB for providing load balancing services
I have individual posts created for setting up all of these, links can be found at the top of this blog post.
Note that I am also utilizing a Harbor image registry running outside of the TCE cluster, but for the examples following below I've used the Docker Hub image. For deploying Harbor on TCE check out my blog post here
The Plex solution
Now, let's discuss the Plex components, starting with the one thing I've spent most of my time on.
Plex.tv accounts, claims and advertised IP
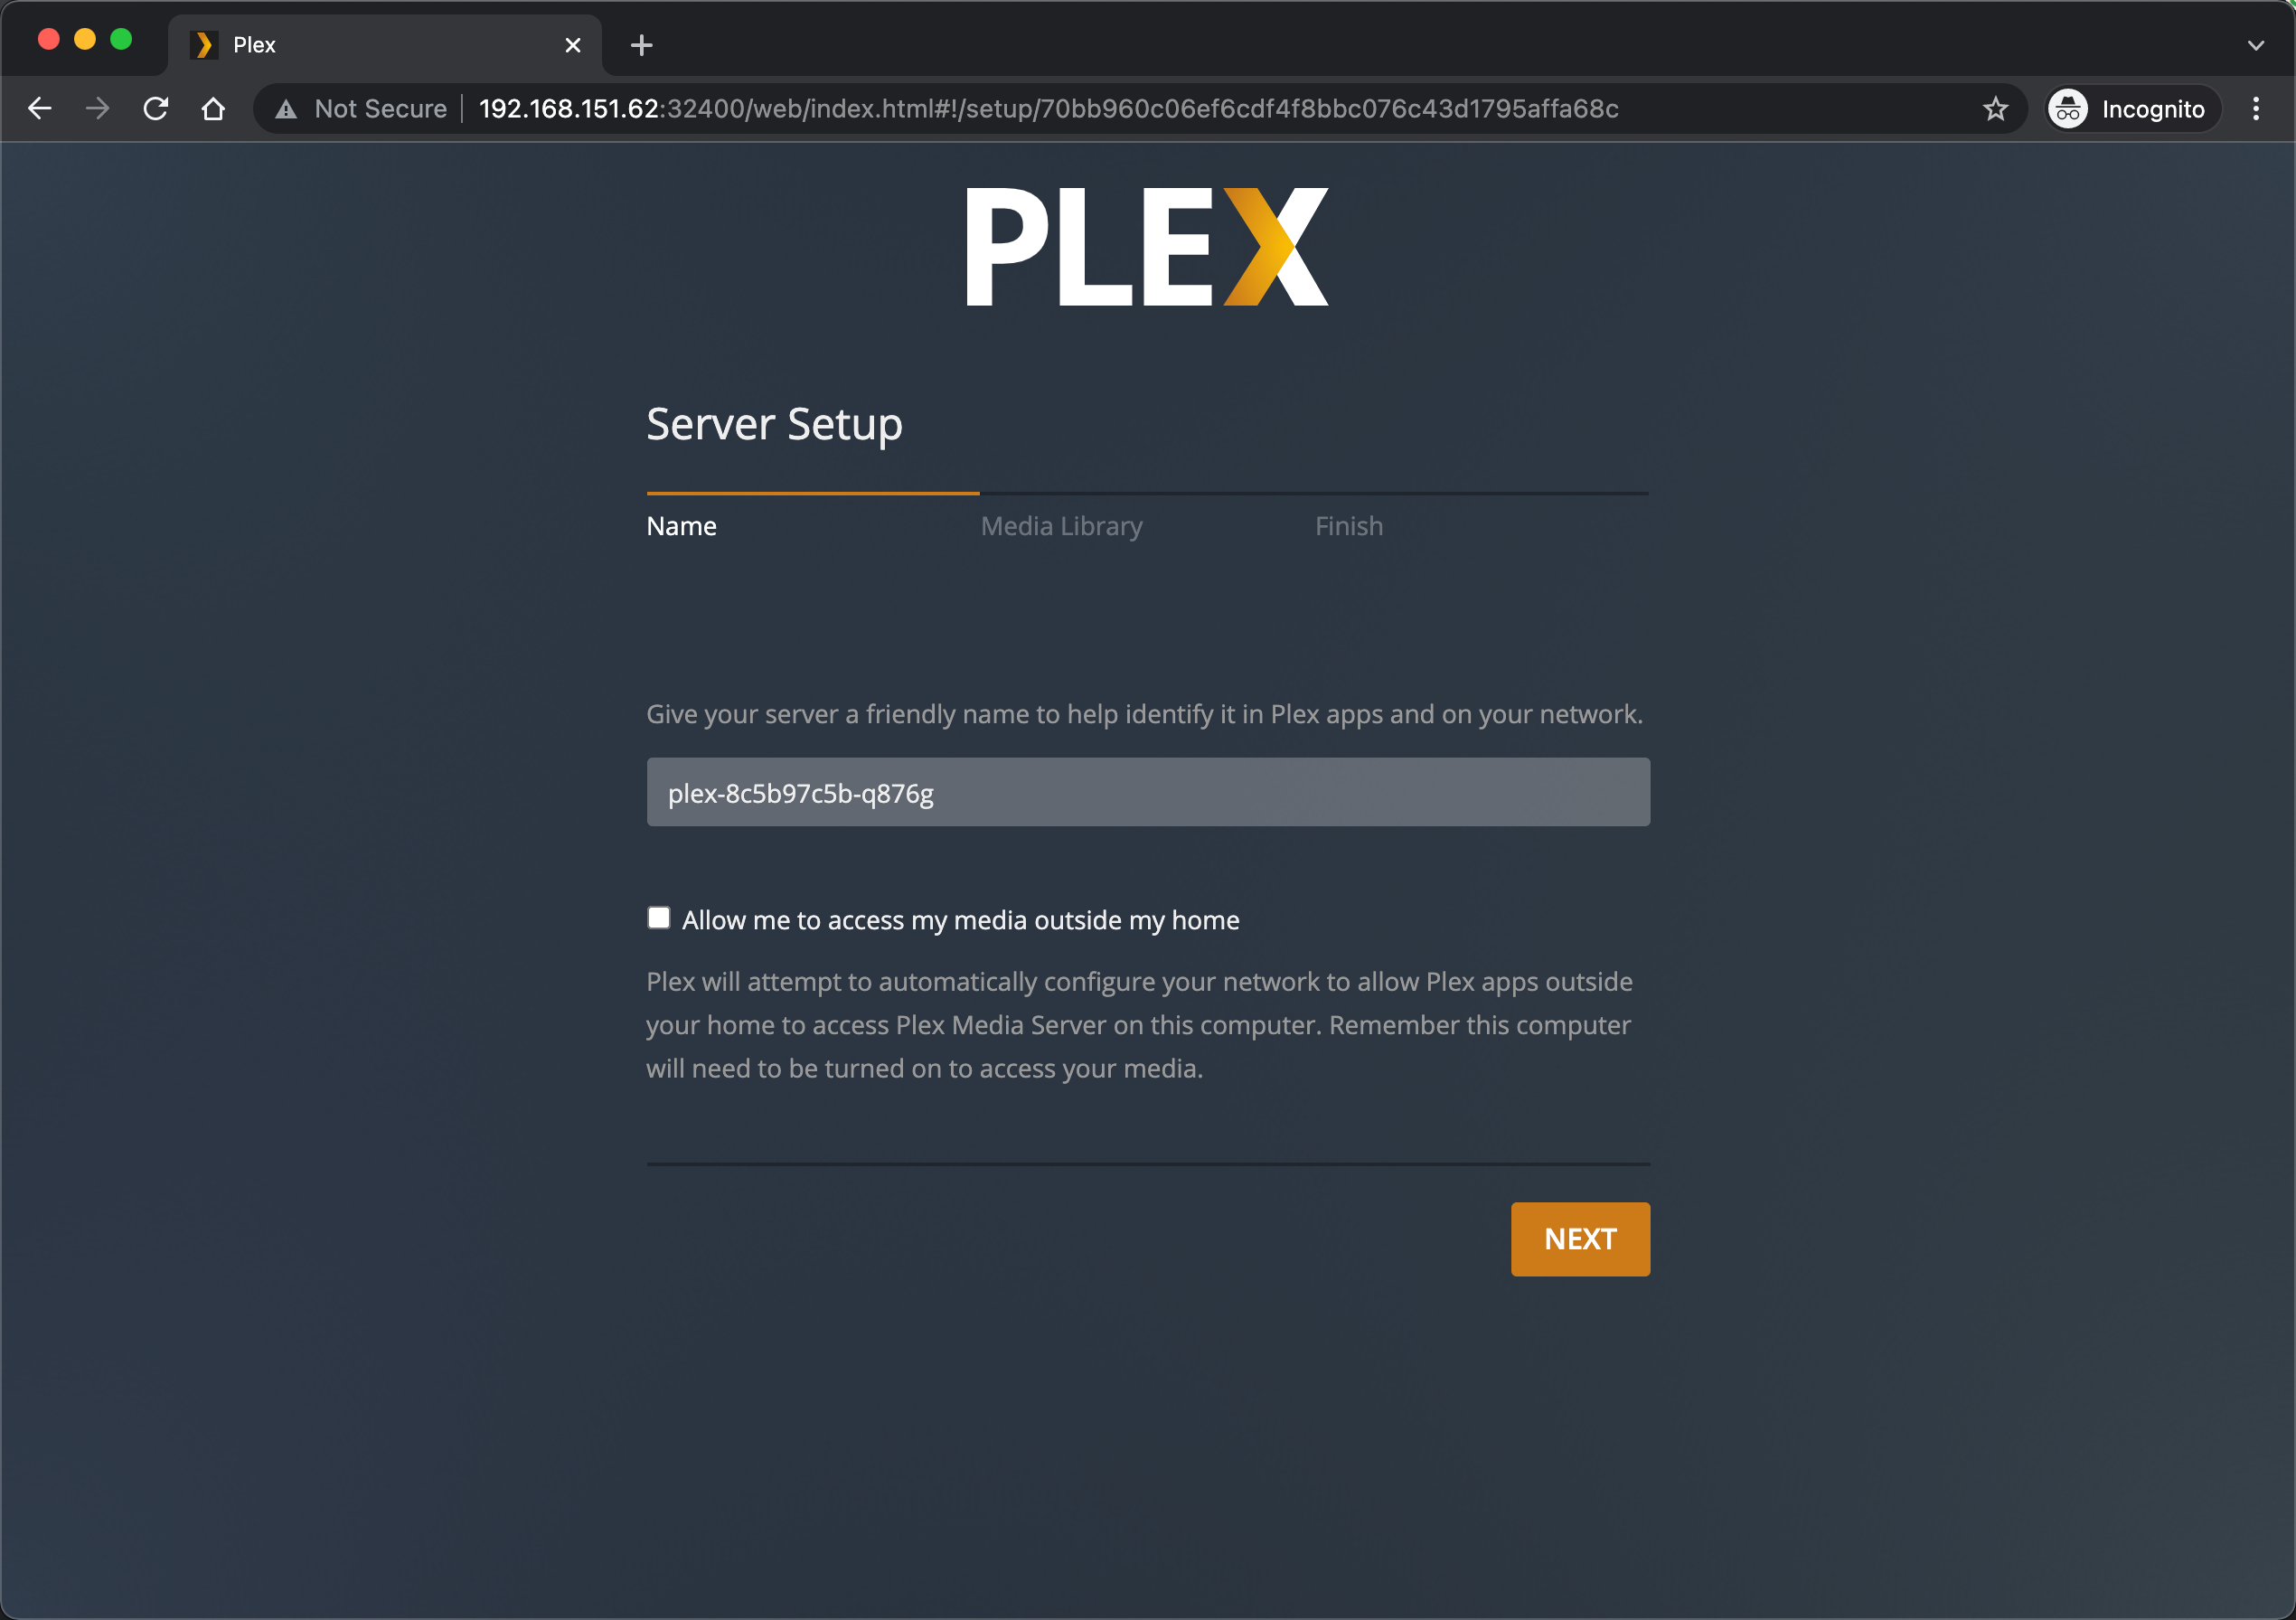
First things first. When you get Plex up and running you'll need to log in to the Plex Web server. This login is a plex.tv login and your account can be linked to multiple Plex Media Servers. This is all fine, I already have a plex.tv account (actually I have two, one for testing things like this setup) and was ready to use that.
In the specifics for the Plex Docker image there's a section for the recommended (but not mandatory) PLEX_CLAIM parameter. This parameter allows for the server to be automatically logged in.
In my many tests I've not come around having to specify this. But that's not all. There's one more parameter I've had to set to get it working, ADVERTISE_IP. And even though it says IP we actually have to specify both the http scheme and the media server port
One very important thing to note with the Plex claim is that it's only valid for four - 4 - minutes.
Persistent volumes
As mentioned we need two persistent volumes. One of which will be the reference to my already existing share of media files.
For this I've created a Persistent volume mounting the NFS share, and a corresponding Persistent Volume claim which the Plex Pod can mount
The second volume is for the /config directory, and this will be created dynamically through the previously mentioned Storage class
 1apiVersion: v1
 2kind: Namespace
 3metadata:
 4  name: plex
 5---
 6apiVersion: v1
 7kind: PersistentVolume
 8metadata:
 9  name: nfs-plex-data
10spec:
11  storageClassName: "pvc-plex-data-nfs"
12  capacity:
13    storage: 20Gi
14  accessModes:
15    - ReadWriteMany
16  nfs:
17    path: /nfs/plex/tce/data
18    server: x.x.x.x
19    readOnly: false
20---
21apiVersion: v1
22kind: PersistentVolumeClaim
23metadata:
24  name: pvc-plex-config
25  namespace: plex
26spec:
27  storageClassName: sc-vmdk
28  accessModes:
29    - ReadWriteOnce
30  resources:
31    requests:
32      storage: 1Gi
33---
34apiVersion: v1
35kind: PersistentVolumeClaim
36metadata:
37  name: pvc-plex-data
38  namespace: plex
39spec:
40  storageClassName: pvc-plex-data-nfs
41  volumeName: nfs-plex-data
42  accessModes:
43    - ReadWriteMany
44  resources:
45    requests:
46      storage: 20Gi
After creating the storage resources we should have them ready to use for our Plex deployment. Again, note that the config PVC was created with the storage class which created a Persistent volume for us
Plex configuration
We've already discussed the PLEX_CLAIM and the ADVERTISE_IP parameters. There's a couple more to set, again they are optional according to the Plex documentation. Most of them are only used at first start of the container, building out the Plex database backed by the /config volume.
Depending on how you'll connect to, and from what device, the Plex server you'll have to open and make available a few ports. I've used both the Plex docker image reference and this blog post for getting a list of ports to define. There are ports I've omitted, for intance for Roku devices which I don't have. If the ports won't be used they shouldn't be available.
What I've ended up with is the following deployment spec
 1apiVersion: apps/v1
 2kind: Deployment
 3metadata:
 4  name: plex
 5  namespace: plex
 6  labels:
 7    app: plexserver
 8spec:
 9  replicas: 1
10  selector:
11    matchLabels:
12      app: plexserver
13  template:
14    metadata:
15      labels:
16        app: plexserver
17      annotations:
18        backup.velero.io/backup-volumes: plex-config
19    spec:
20      volumes:
21      - name: plex-config
22        persistentVolumeClaim:
23          claimName: pvc-plex-config
24      - name: plex-data
25        persistentVolumeClaim:
26          claimName: pvc-plex-data
27      containers:
28      - name: plex
29        image: plexinc/pms-docker
30        imagePullPolicy: Always
31        resources:
32          requests:
33            cpu: 1
34            memory: 512Mi
35        ports:
36        - containerPort: 32400 #PMS
37          name: plex
38        - containerPort: 32400
39          name: plex-udp
40          protocol: UDP
41        - containerPort: 32469 #Plex DLNA
42          name: plex-dlna
43        - containerPort: 5353
44          name: plex-discovery
45          protocol: UDP
46        - containerPort: 1900 #Plex DLNA
47          name: plex-dlna-udp
48          protocol: UDP
49        env:
50        - name: UID
51          value: "\x31\x30\x30\x33" #Corresponds to user id on NFS server (ascii)
52        - name: GID
53          value: "\x31\x30\x30\x33" #Corresponds to group id on NFS server
54        - name: PLEX_CLAIM
55          value: <plex.tv/claim>
56        - name: ADVERTISE_IP
57          value: https://plex-p.tce.rhmlab.local
58        - name: HOSTNAME
59          value: plex-p.tce.rhmlab.local
60        - name: ALLOWED_NETWORKS
61          value: 192.168.0.0/16,100.96.0.0/11
62        - name: TZ
63          value: Europe/Oslo
64        volumeMounts:
65        - mountPath: /config
66          name: plex-config
67        - mountPath: /data
68          name: plex-data
Note the annotation specifying which volume to include for Velero snapshot backup. I'm only specifying the /config volume since the media files are sitting on an external NFS server which has it's own backup.
Service
To connect to a Kubernetes deployment we have to use Services. And to connect to Plex we'll have to create a service for the previously mentioned ports. This blog post mentioned earlier helped a lot here. Note that we need to do a special thing here with the load balancer IP so that both the TCP and UDP service can use the same one.
 1kind: Service
 2apiVersion: v1
 3metadata:
 4  name: plex-udp
 5  namespace: plex
 6  annotations:
 7    metallb.universe.tf/allow-shared-ip: plexserver # annotation name to combine the Service IP, make sure it's same name as in the service UDP yaml
 8spec:
 9  selector:
10    app: plexserver
11  ports:
12  - port: 1900
13    targetPort: 1900
14    name: dlna-udp
15    protocol: UDP
16  - port: 5353
17    targetPort: 5353
18    name: discovery-udp
19    protocol: UDP
20  type: LoadBalancer
21  loadBalancerIP: 192.168.151.62
22---
23kind: Service
24apiVersion: v1
25metadata:
26  name: plex-tcp
27  namespace: plex
28  annotations:
29    metallb.universe.tf/allow-shared-ip: plexserver
30spec:
31  selector:
32    app: plexserver
33  ports:
34  - port: 32400
35    targetPort: 32400
36    name: pms-web
37    protocol: TCP
38  - port: 32469
39    targetPort: 32469
40    name: dlna-tcp
41    protocol: TCP
42  type: LoadBalancer
43  loadBalancerIP: 192.168.151.62
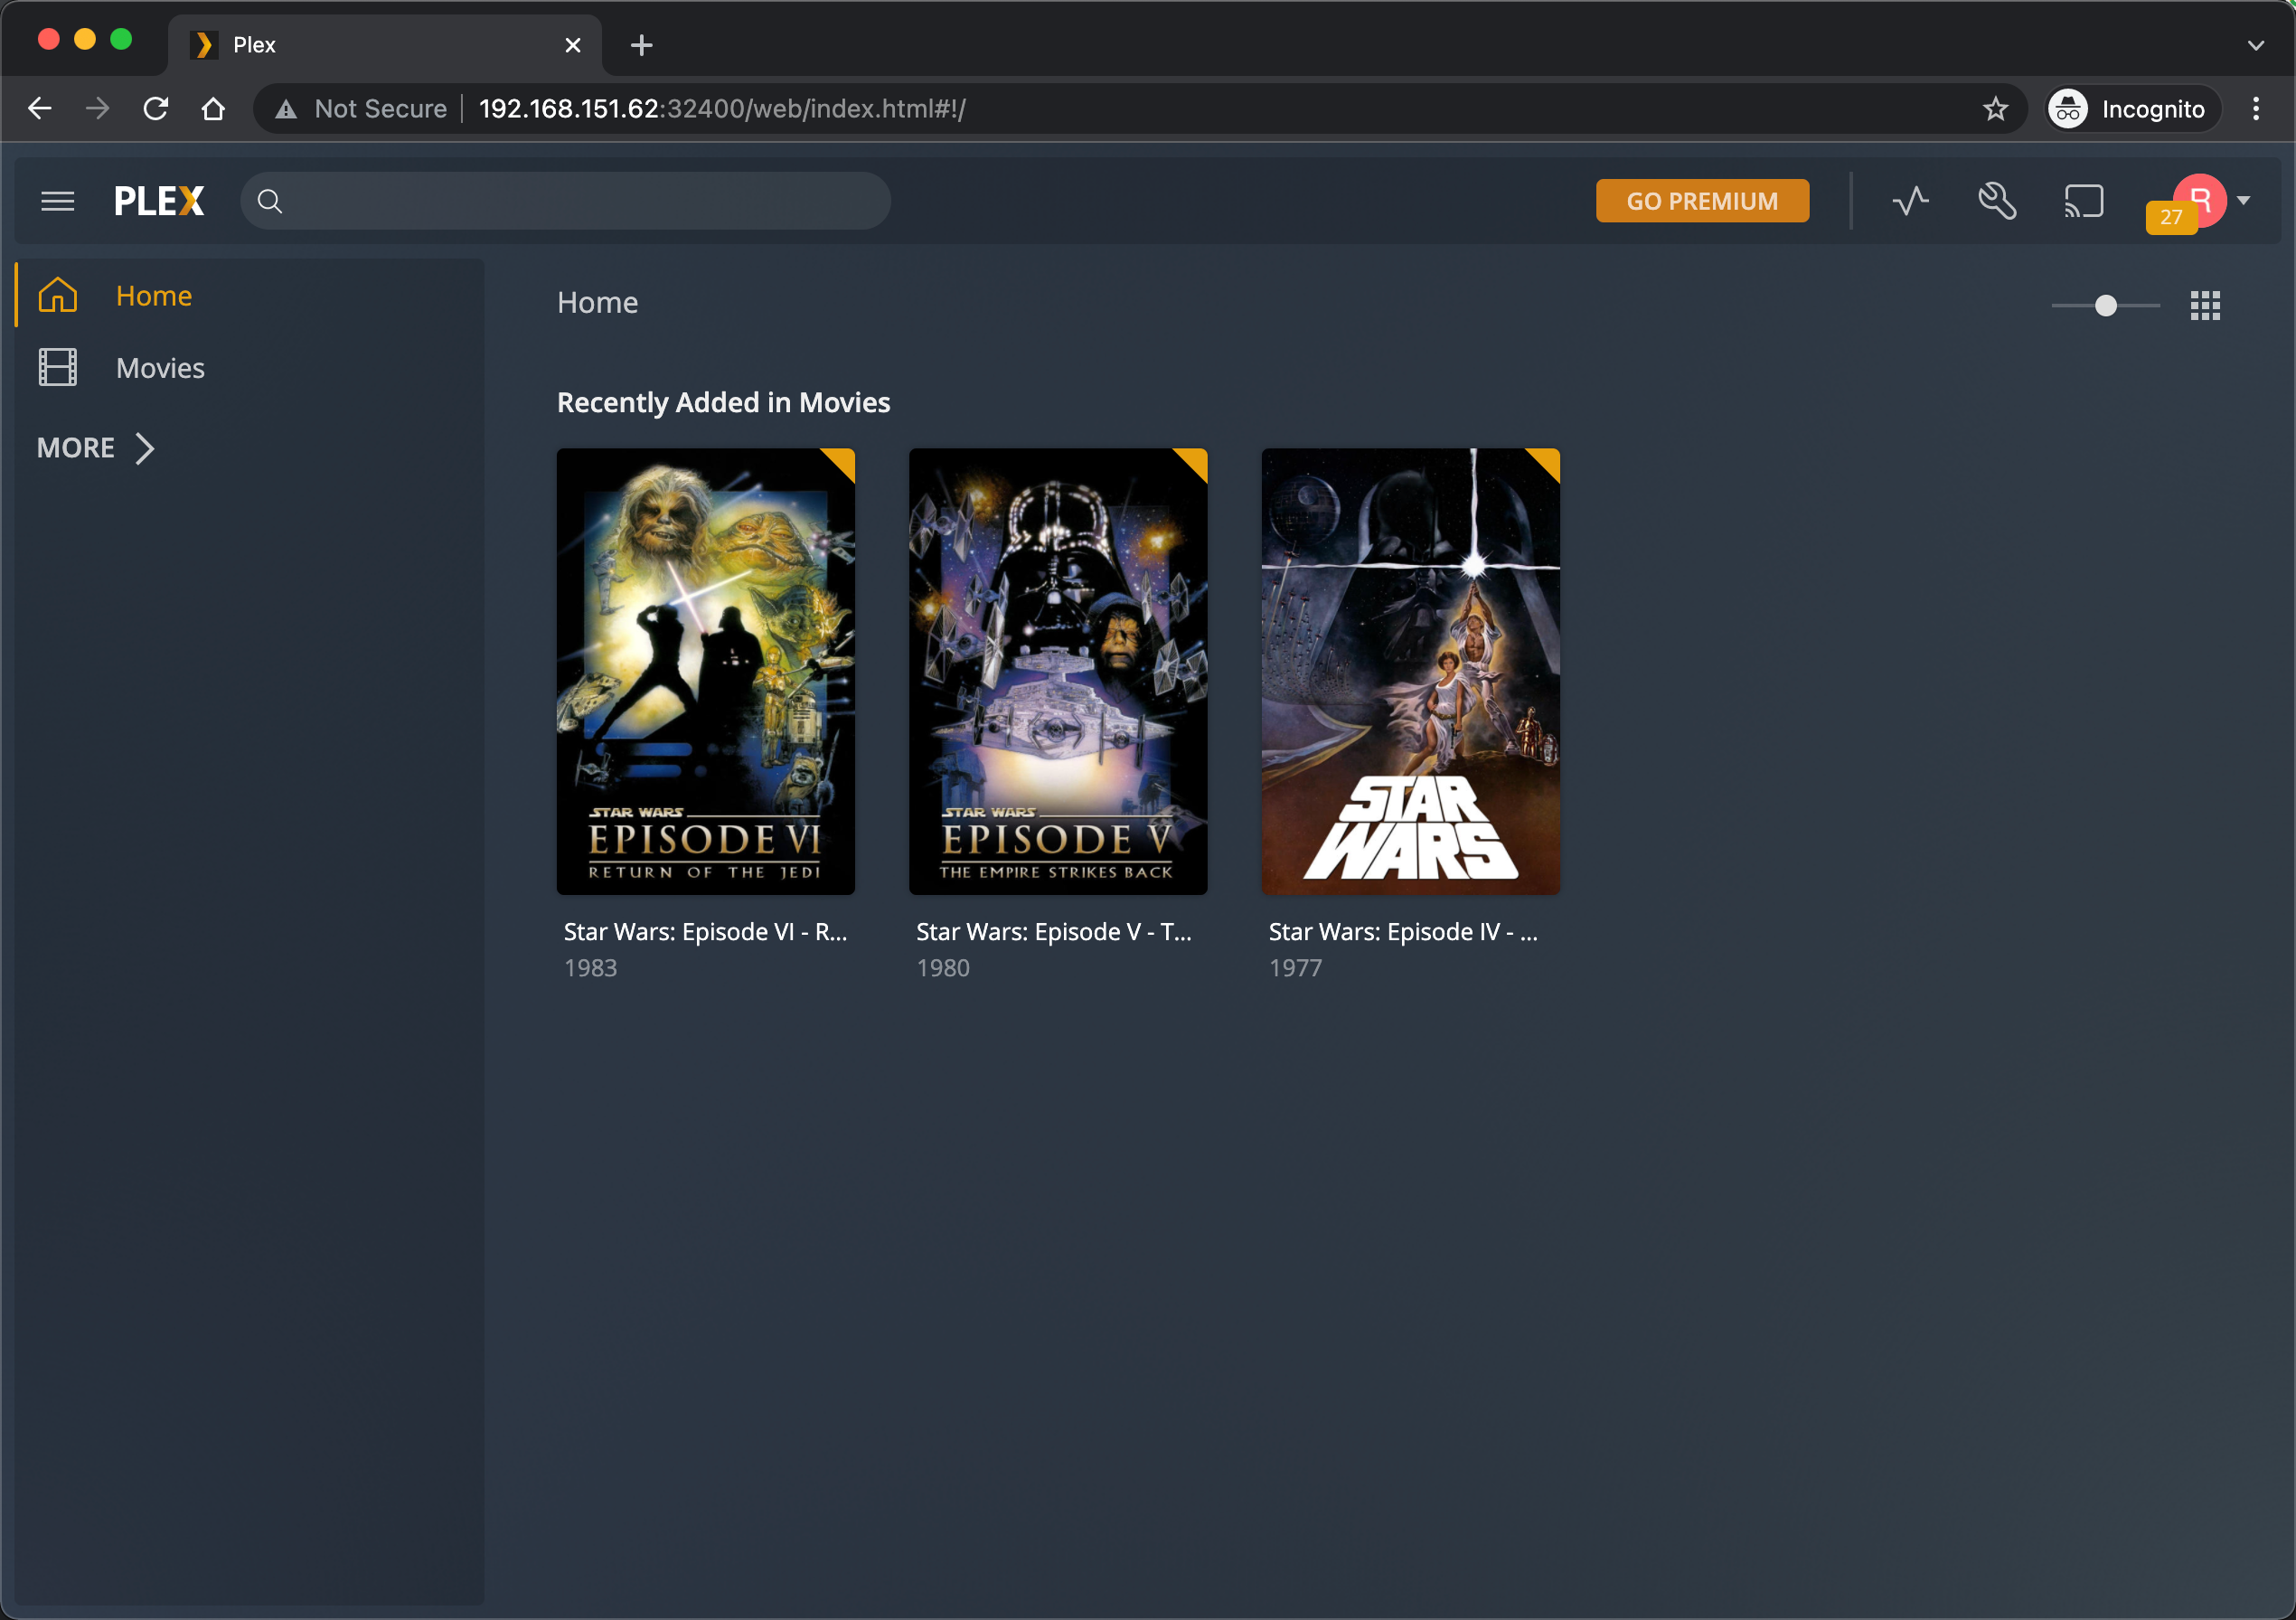
Now, we can access the Plex server by the IP address of the load balancer and on the port 32400 which are the default port. We'll do just that to see that things are working and do the initial configuration before proceeding
TLS certificate and HTTPProxy
Normally we want to be able to access the service by a DNS name and not having to specify the port. For that we'll use Contour and a HTTPProxy resource.
We'll also annotate this resource with annotations for ExternalDNS so we'll get it registered in the External DNS server and we'll specify it to use a certificate which we'll create in the same yaml.
Note that the certificate will be self-signed, but if we'd have an integration with an external service like Vault, or even better Let's Encrypt we could have easily had this create a trusted certificate for us.
 1apiVersion: cert-manager.io/v1
 2kind: Issuer
 3metadata:
 4  name: plex-issuer
 5  namespace: plex
 6spec:
 7  selfSigned: {}
 8---
 9apiVersion: cert-manager.io/v1
10kind: Certificate
11metadata:
12  name: plex-tls
13  namespace: plex
14spec:
15  secretName: plex-tls
16  duration: 2160h # 90d
17  renewBefore: 360h # 15d
18  subject:
19    organizations:
20      - rhmlab
21  isCA: false
22  privateKey:
23    algorithm: RSA
24    encoding: PKCS1
25    size: 2048
26  usages:
27    - server auth
28    - client auth
29  dnsNames:
30    - plex.tce.rhmlab.local
31  ipAddresses:
32    - 192.168.151.62
33  issuerRef:
34    name: plex-issuer
35    kind: Issuer
36    group: cert-manager.io
This gives us a self-signed certificate which we can reference in our HTTPProxy specification
 1apiVersion: projectcontour.io/v1
 2kind: HTTPProxy
 3metadata:
 4  annotations:
 5    external-dns.alpha.kubernetes.io/hostname: plex.tce.rhmlab.local.
 6  labels:
 7    app: plexserver
 8  name: plex-httpproxy
 9  namespace: plex
10spec:
11  routes:
12  - conditions:
13    - prefix: /
14    pathRewritePolicy:
15      replacePrefix:
16      - prefix: /
17        replacement: /
18    services:
19    - name: plex-tcp #corresponds to service object
20      port: 32400
21  virtualhost:
22    fqdn: plex.tce.rhmlab.local
23    tls:
24      secretName: plex-tls
This let's us access Plex with the specified FQDN and we have a certificate in place, albeit self-signed.
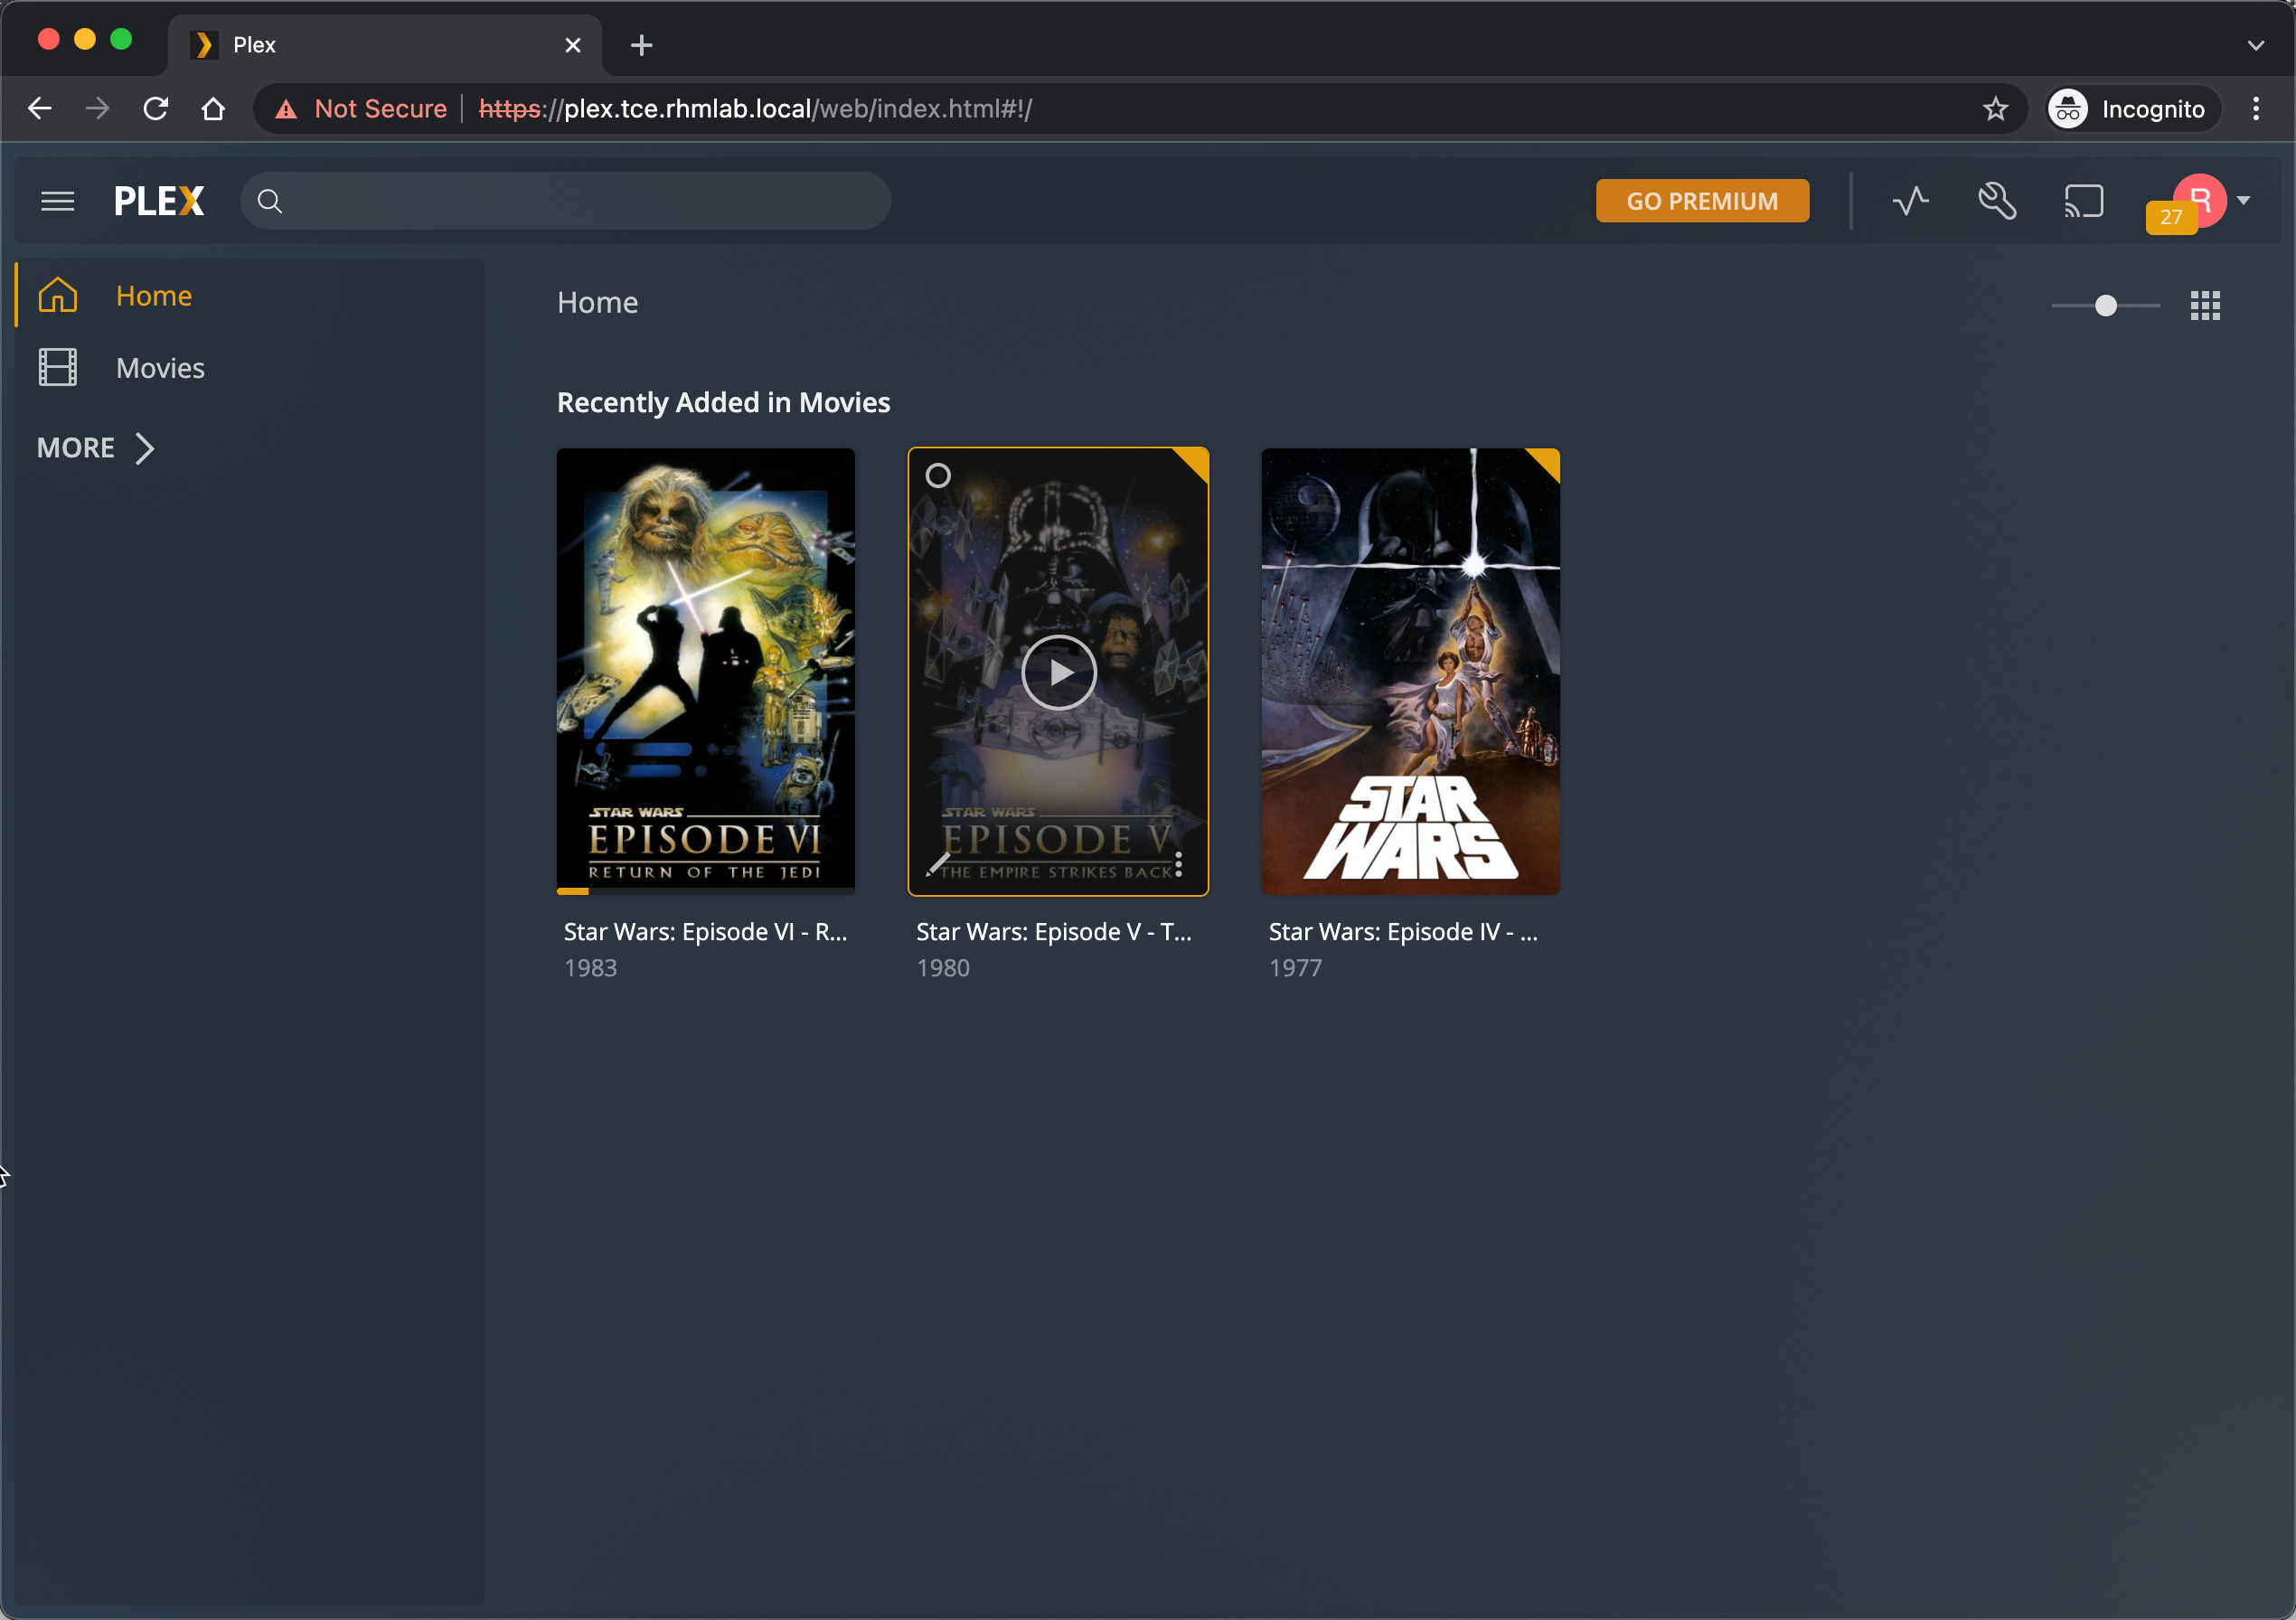
With this we actually have our Plex solution running and we can enjoy our media.
Now to mimic some kind of a production setting we'll add in a few additional capabilities from the supporting software discussed earlier.
Monitoring
In my TCE cluster I have already set up Prometheus and Grafana based on Tanzu packages. I've a blog post on how to set that up here
Plex doesn't offer any Prometheus metrics out of the box, but there are a few community exporters out there. I went with this image on the Docker Hub which is based on this project
This needs a config file which we'll present to the exporter through a Config map. You'll note that the token is inside the config map directly, ideally this should be a Secret. To get the token check out this Plex support article.
I couldn't get Autodiscovery to work but since this is Kubernetes we can at least reference the plex service with the Kubernetes service name
To have our Prometheus installation scrape these metrics we'll annotate the plex_exporter pod with the following
1prometheus.io/scrape: "true"
2prometheus.io/scheme: "http"
3prometheus.io/path: "/metrics"
4prometheus.io/port: "9594"
The full yaml for the plex_exporter deployment and service are here.
 1apiVersion: v1
 2kind: ConfigMap
 3metadata:
 4  name: plex-exporter
 5  namespace: plex
 6data:
 7  config.yaml: |
 8    address: ":9594"
 9    logLevel: "info"
10    logFormat: "text"
11    autoDiscover: false
12    token: "<your-token>"
13    servers:
14    - baseUrl: http://plex-tcp:32400
15---
16apiVersion: apps/v1
17kind: Deployment
18metadata:
19  name: plex-exporter
20  namespace: plex
21  labels:
22    app: plex-exporter
23spec:
24  replicas: 1
25  selector:
26    matchLabels:
27      app: plex-exporter
28  template:
29    metadata:
30      labels:
31        app: plex-exporter
32      annotations:
33        prometheus.io/scrape: "true"
34        prometheus.io/scheme: "http"
35        prometheus.io/path: "/metrics"
36        prometheus.io/port: "9594"
37    spec:
38      containers:
39        - name: plex-exporter
40          image: granra/plex_exporter:v0.2.3
41          imagePullPolicy: Always
42          ports:
43            - containerPort: 9594
44              name: metrics
45          volumeMounts:
46            - name: config
47              mountPath: /etc/plex_exporter/config.yaml
48              subPath: config.yaml
49      volumes:
50        - name: config
51          configMap:
52            name: plex-exporter
53---
54kind: Service
55apiVersion: v1
56metadata:
57  name: plex-exporter
58  namespace: plex
59spec:
60  selector:
61    app: plex-exporter
62  ports:
63  - port: 9594
64    name: metrics
65    protocol: TCP
66  type: ClusterIP #Change to LoadBalancer if you want to check out the metrics page directly
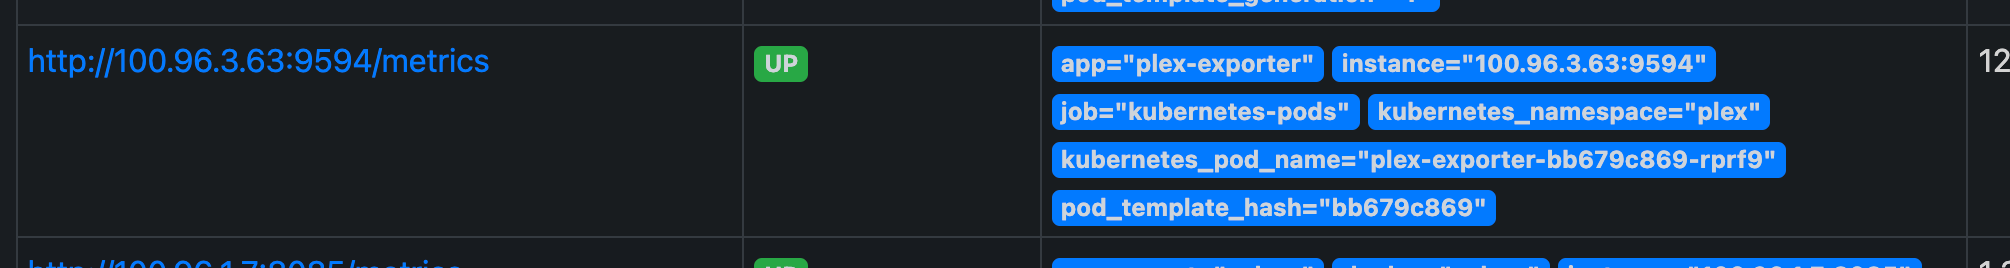
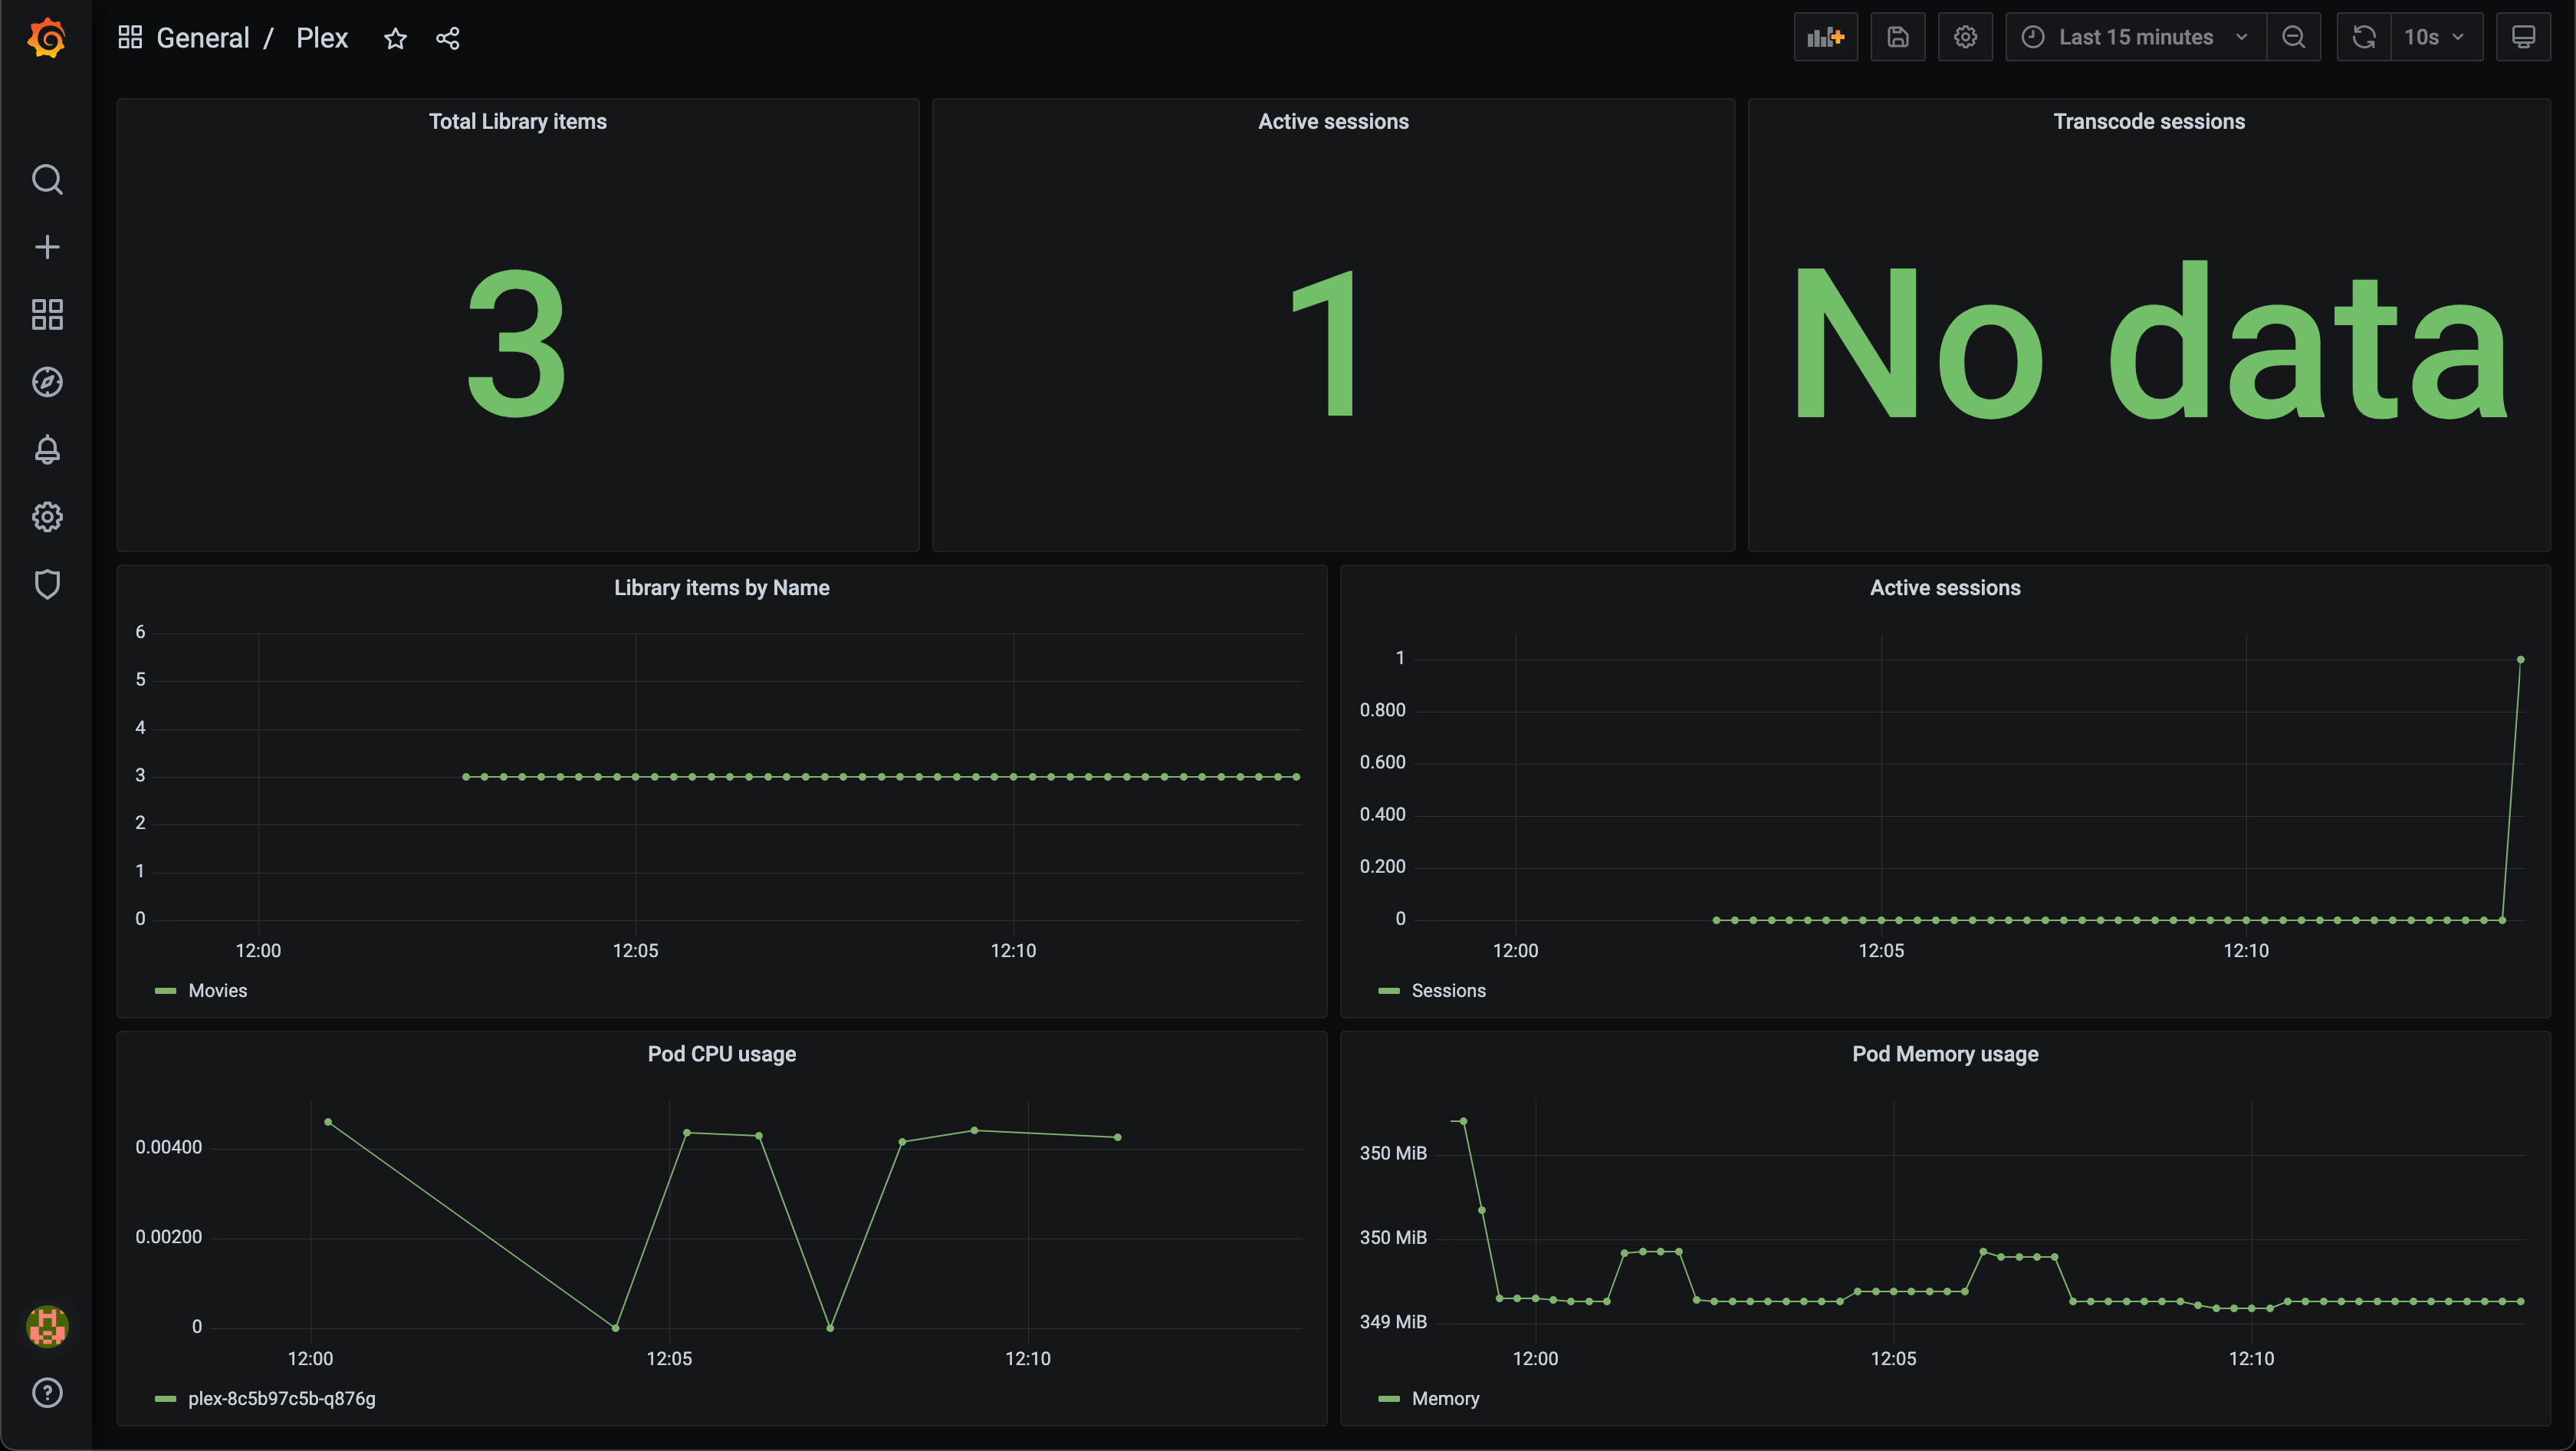
With this in place Prometheus picks it up and adds it to it's targets
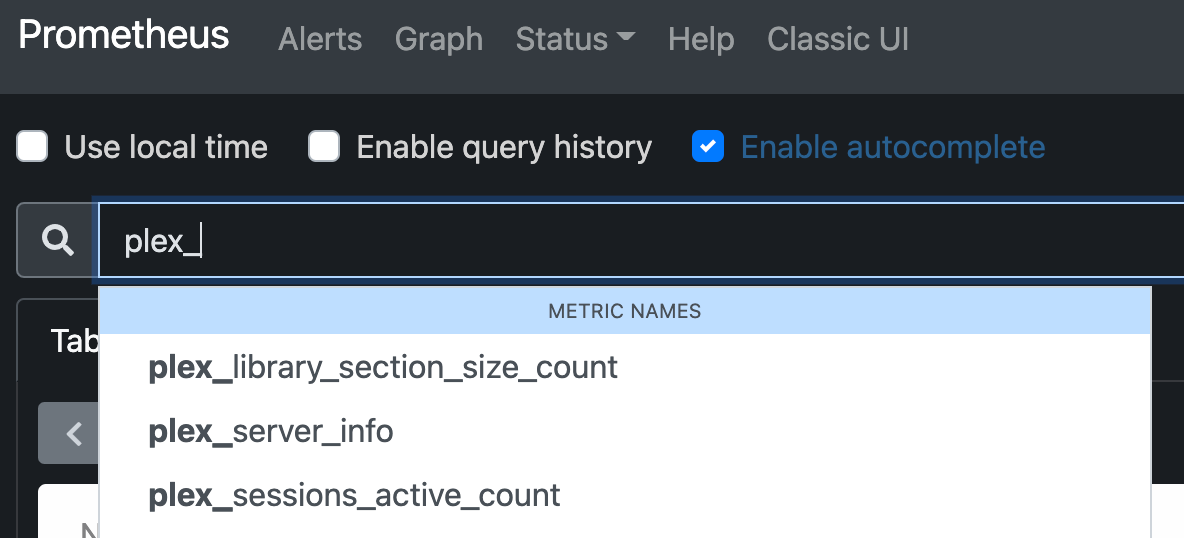
And we can verify that we can see our metrics
Over in Grafana we would like to have a Dashboard with these metrics. As the Grafana installation from the Tanzu package repo is installed with a Sidecar periodically updating dashboards added as Config maps, we simply have to add a Config map with the label grafana-dashboard: "1", but be sure to put it in the same namespace as the Grafana installation
1apiVersion: v1
2kind: ConfigMap
3metadata:
4 name: plex-grafana
5 namespace: grafana #Needs to match the Grafana installation namespace
6 labels:
7 grafana-dashboard: "1" #Required to have the Grafana sidecar container pick up the new dashboard
8data:
9 plex-prometheus.json: |
10 {
11 "annotations": {
12 "list": [
13 {
14 "builtIn": 1,
15 "datasource": "-- Grafana --",
16 "enable": true,
17 "hide": true,
18 "iconColor": "rgba(0, 211, 255, 1)",
19 "name": "Annotations & Alerts",
20 "type": "dashboard"
21 }
22 ]
23 },
24 "editable": true,
25 "gnetId": null,
26 "graphTooltip": 0,
27 "id": 3,
28 "links": [],
29 "panels": [
30 {
31 "datasource": null,
32 "fieldConfig": {
33 "defaults": {
34 "color": {
35 "mode": "thresholds"
36 },
37 "mappings": [],
38 "thresholds": {
39 "mode": "absolute",
40 "steps": [
41 {
42 "color": "green",
43 "value": null
44 },
45 {
46 "color": "red",
47 "value": 80
48 }
49 ]
50 }
51 },
52 "overrides": []
53 },
54 "gridPos": {
55 "h": 8,
56 "w": 8,
57 "x": 0,
58 "y": 0
59 },
60 "id": 2,
61 "options": {
62 "colorMode": "value",
63 "graphMode": "area",
64 "justifyMode": "auto",
65 "orientation": "auto",
66 "reduceOptions": {
67 "calcs": [
68 "lastNotNull"
69 ],
70 "fields": "",
71 "values": false
72 },
73 "text": {},
74 "textMode": "auto"
75 },
76 "pluginVersion": "7.5.6",
77 "targets": [
78 {
79 "exemplar": true,
80 "expr": "sum(plex_library_section_size_count)",
81 "instant": true,
82 "interval": "",
83 "legendFormat": "",
84 "refId": "A"
85 }
86 ],
87 "timeFrom": null,
88 "timeShift": null,
89 "title": "Total Library items",
90 "type": "stat"
91 },
92 {
93 "datasource": null,
94 "fieldConfig": {
95 "defaults": {
96 "color": {
97 "mode": "thresholds"
98 },
99 "mappings": [],
100 "thresholds": {
101 "mode": "absolute",
102 "steps": [
103 {
104 "color": "green",
105 "value": null
106 },
107 {
108 "color": "red",
109 "value": 80
110 }
111 ]
112 }
113 },
114 "overrides": []
115 },
116 "gridPos": {
117 "h": 8,
118 "w": 8,
119 "x": 8,
120 "y": 0
121 },
122 "id": 5,
123 "options": {
124 "colorMode": "value",
125 "graphMode": "area",
126 "justifyMode": "auto",
127 "orientation": "auto",
128 "reduceOptions": {
129 "calcs": [
130 "lastNotNull"
131 ],
132 "fields": "",
133 "values": false
134 },
135 "text": {},
136 "textMode": "auto"
137 },
138 "pluginVersion": "7.5.6",
139 "targets": [
140 {
141 "exemplar": true,
142 "expr": "sum(plex_sessions_active_count)",
143 "instant": true,
144 "interval": "",
145 "legendFormat": "",
146 "refId": "A"
147 }
148 ],
149 "timeFrom": null,
150 "timeShift": null,
151 "title": "Active sessions",
152 "type": "stat"
153 },
154 {
155 "datasource": null,
156 "fieldConfig": {
157 "defaults": {
158 "color": {
159 "mode": "thresholds"
160 },
161 "mappings": [],
162 "thresholds": {
163 "mode": "absolute",
164 "steps": [
165 {
166 "color": "green",
167 "value": null
168 },
169 {
170 "color": "red",
171 "value": 80
172 }
173 ]
174 }
175 },
176 "overrides": []
177 },
178 "gridPos": {
179 "h": 8,
180 "w": 8,
181 "x": 16,
182 "y": 0
183 },
184 "id": 6,
185 "options": {
186 "colorMode": "value",
187 "graphMode": "area",
188 "justifyMode": "auto",
189 "orientation": "auto",
190 "reduceOptions": {
191 "calcs": [
192 "lastNotNull"
193 ],
194 "fields": "",
195 "values": false
196 },
197 "text": {},
198 "textMode": "auto"
199 },
200 "pluginVersion": "7.5.6",
201 "targets": [
202 {
203 "exemplar": true,
204 "expr": "sum(plex_transcode_sessions_active_count)",
205 "instant": true,
206 "interval": "",
207 "legendFormat": "",
208 "refId": "A"
209 }
210 ],
211 "timeFrom": null,
212 "timeShift": null,
213 "title": "Transcode sessions",
214 "type": "stat"
215 },
216 {
217 "datasource": null,
218 "fieldConfig": {
219 "defaults": {
220 "color": {
221 "mode": "palette-classic"
222 },
223 "custom": {
224 "axisLabel": "",
225 "axisPlacement": "auto",
226 "barAlignment": 0,
227 "drawStyle": "line",
228 "fillOpacity": 0,
229 "gradientMode": "none",
230 "hideFrom": {
231 "graph": false,
232 "legend": false,
233 "tooltip": false
234 },
235 "lineInterpolation": "linear",
236 "lineWidth": 1,
237 "pointSize": 5,
238 "scaleDistribution": {
239 "type": "linear"
240 },
241 "showPoints": "auto",
242 "spanNulls": false
243 },
244 "mappings": [],
245 "thresholds": {
246 "mode": "absolute",
247 "steps": [
248 {
249 "color": "green",
250 "value": null
251 },
252 {
253 "color": "red",
254 "value": 80
255 }
256 ]
257 }
258 },
259 "overrides": []
260 },
261 "gridPos": {
262 "h": 8,
263 "w": 12,
264 "x": 0,
265 "y": 8
266 },
267 "id": 7,
268 "options": {
269 "legend": {
270 "calcs": [],
271 "displayMode": "list",
272 "placement": "bottom"
273 },
274 "tooltipOptions": {
275 "mode": "single"
276 }
277 },
278 "pluginVersion": "7.5.6",
279 "targets": [
280 {
281 "exemplar": true,
282 "expr": "sum (plex_library_section_size_count) by (name)",
283 "interval": "",
284 "legendFormat": "{{name}}",
285 "refId": "A"
286 }
287 ],
288 "timeFrom": null,
289 "timeShift": null,
290 "title": "Library items by Name",
291 "type": "timeseries"
292 },
293 {
294 "datasource": null,
295 "fieldConfig": {
296 "defaults": {
297 "color": {
298 "mode": "palette-classic"
299 },
300 "custom": {
301 "axisLabel": "",
302 "axisPlacement": "auto",
303 "barAlignment": 0,
304 "drawStyle": "line",
305 "fillOpacity": 0,
306 "gradientMode": "none",
307 "hideFrom": {
308 "graph": false,
309 "legend": false,
310 "tooltip": false
311 },
312 "lineInterpolation": "linear",
313 "lineWidth": 1,
314 "pointSize": 5,
315 "scaleDistribution": {
316 "type": "linear"
317 },
318 "showPoints": "auto",
319 "spanNulls": false
320 },
321 "mappings": [],
322 "thresholds": {
323 "mode": "absolute",
324 "steps": [
325 {
326 "color": "green",
327 "value": null
328 },
329 {
330 "color": "red",
331 "value": 80
332 }
333 ]
334 },
335 "unit": "short"
336 },
337 "overrides": []
338 },
339 "gridPos": {
340 "h": 8,
341 "w": 12,
342 "x": 12,
343 "y": 8
344 },
345 "id": 4,
346 "options": {
347 "legend": {
348 "calcs": [],
349 "displayMode": "list",
350 "placement": "bottom"
351 },
352 "tooltipOptions": {
353 "mode": "single"
354 }
355 },
356 "pluginVersion": "7.5.6",
357 "targets": [
358 {
359 "exemplar": true,
360 "expr": "sum (plex_sessions_active_count)",
361 "interval": "",
362 "legendFormat": "Sessions",
363 "refId": "A"
364 }
365 ],
366 "timeFrom": null,
367 "timeShift": null,
368 "title": "Active sessions",
369 "type": "timeseries"
370 },
371 {
372 "datasource": null,
373 "fieldConfig": {
374 "defaults": {
375 "color": {
376 "mode": "palette-classic"
377 },
378 "custom": {
379 "axisLabel": "",
380 "axisPlacement": "auto",
381 "barAlignment": 0,
382 "drawStyle": "line",
383 "fillOpacity": 0,
384 "gradientMode": "none",
385 "hideFrom": {
386 "graph": false,
387 "legend": false,
388 "tooltip": false
389 },
390 "lineInterpolation": "linear",
391 "lineWidth": 1,
392 "pointSize": 5,
393 "scaleDistribution": {
394 "type": "linear"
395 },
396 "showPoints": "auto",
397 "spanNulls": true
398 },
399 "mappings": [],
400 "thresholds": {
401 "mode": "absolute",
402 "steps": [
403 {
404 "color": "green",
405 "value": null
406 },
407 {
408 "color": "red",
409 "value": 80
410 }
411 ]
412 }
413 },
414 "overrides": []
415 },
416 "gridPos": {
417 "h": 7,
418 "w": 12,
419 "x": 0,
420 "y": 16
421 },
422 "id": 8,
423 "options": {
424 "legend": {
425 "calcs": [],
426 "displayMode": "list",
427 "placement": "bottom"
428 },
429 "tooltipOptions": {
430 "mode": "single"
431 }
432 },
433 "pluginVersion": "7.5.6",
434 "targets": [
435 {
436 "exemplar": true,
437 "expr": "sum(rate(container_cpu_usage_seconds_total{pod=~\"plex.*\",pod!~\"plex-exporter.*\"}[1m]))by(pod)",
438 "interval": "",
439 "legendFormat": "{{container}}",
440 "refId": "A"
441 }
442 ],
443 "timeFrom": null,
444 "timeShift": null,
445 "title": "Pod CPU usage",
446 "type": "timeseries"
447 },
448 {
449 "datasource": null,
450 "fieldConfig": {
451 "defaults": {
452 "color": {
453 "mode": "palette-classic"
454 },
455 "custom": {
456 "axisLabel": "",
457 "axisPlacement": "auto",
458 "barAlignment": 0,
459 "drawStyle": "line",
460 "fillOpacity": 0,
461 "gradientMode": "none",
462 "hideFrom": {
463 "graph": false,
464 "legend": false,
465 "tooltip": false
466 },
467 "lineInterpolation": "linear",
468 "lineWidth": 1,
469 "pointSize": 5,
470 "scaleDistribution": {
471 "type": "linear"
472 },
473 "showPoints": "auto",
474 "spanNulls": true
475 },
476 "mappings": [],
477 "thresholds": {
478 "mode": "absolute",
479 "steps": [
480 {
481 "color": "green",
482 "value": null
483 },
484 {
485 "color": "red",
486 "value": 80
487 }
488 ]
489 },
490 "unit": "bytes"
491 },
492 "overrides": []
493 },
494 "gridPos": {
495 "h": 7,
496 "w": 12,
497 "x": 12,
498 "y": 16
499 },
500 "id": 9,
501 "options": {
502 "legend": {
503 "calcs": [],
504 "displayMode": "list",
505 "placement": "bottom"
506 },
507 "tooltipOptions": {
508 "mode": "single"
509 }
510 },
511 "pluginVersion": "7.5.6",
512 "targets": [
513 {
514 "exemplar": true,
515 "expr": "sum (container_memory_working_set_bytes{pod=~\"plex.*\",pod!~\"plex-exporter.*\"}) by (container_name, pod_name)",
516 "interval": "",
517 "legendFormat": "Memory",
518 "refId": "A"
519 }
520 ],
521 "timeFrom": null,
522 "timeShift": null,
523 "title": "Pod Memory usage",
524 "type": "timeseries"
525 }
526 ],
527 "refresh": "10s",
528 "schemaVersion": 27,
529 "style": "dark",
530 "tags": [],
531 "templating": {
532 "list": []
533 },
534 "time": {
535 "from": "now-6h",
536 "to": "now"
537 },
538 "timepicker": {},
539 "timezone": "",
540 "title": "Plex",
541 "uid": "w8ttuLbnk",
542 "version": 10
543 }
When the Grafana dashboard sidecar container picks this up we can see our very simple dashboard in Grafana
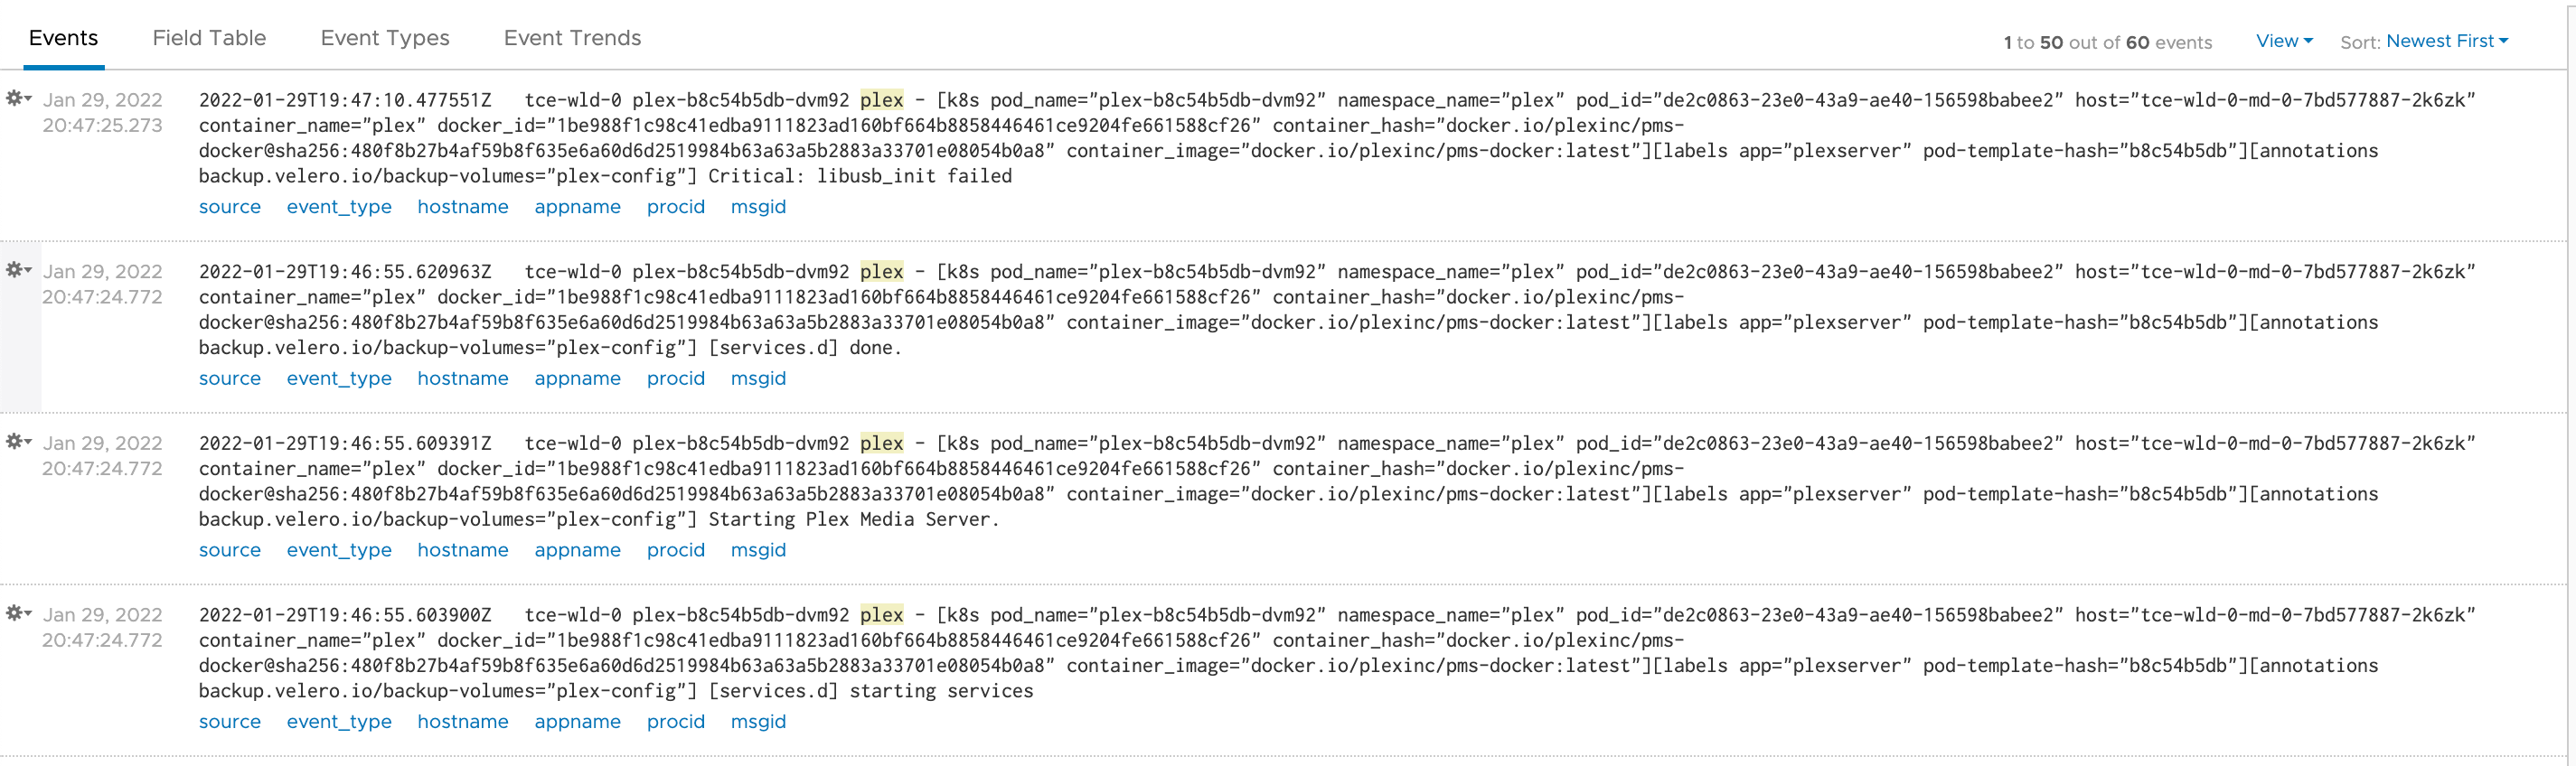
Logging
For logging we have Fluent Bit running in the cluster and it's pushing logs to an external vRealize Log Insight server.
Backup
Velero is running in my cluster and takes scheduled backups of the Plex namespace. I have annotated the Plex deployment with backup-volumes pointing to the config volume to have backup of that. The media files in the data directory has it's own backup outside of this solution.
1backup.velero.io/backup-volumes=plex-config
With Velero we can create a schedule like this to do hourly backups of our Plex namespace.
1velero create schedule plex-hourly --schedule = "@ every 1h" --include-namespaces plex
For a bit more details on how to configure Velero on TCE check out this blog post
Summary
Wow, this has been a fun, but at times also frustrating, project.
The learning points from this is that there are lots of exciting stuff that can be done with TCE, and that with Tanzu packages it's easy to deploy integrated building blocks into our solution like we've seen with external dns, monitoring, logging and so forth.
But I think that one of the biggest things that I got out of this was the reinforced insight that while Kubernetes is a great way of deploying apps, there are lots of moving parts in play. Coming from an infrastructure and sys admin background I strongly believe that we should not expect (or even let) our developers to be in charge of all of this and that the Ops in DevOps is just as important. Platforms and solutions like the ones that can be delivered in the Tanzu portfolio helps both parts achieving their goals, creating value for their business and it's customers
Thanks for reading, and feel free to reach out if you have any comment