rudimartinsen.com
open-menu closeme
Home
vSphere Performance
Aria icon
Aria (vRealize) posts vRA Nested lab
Tanzu icon
Tanzu Mission Control All Tanzu posts
CKA
Proxmox icon
All Proxmox posts
Exam Reviews
Speaking
About
github twitter linkedin youtube rss
  • vSphere Performance monitoring with Telegraf, InfluxDB and Grafana 7 - Intro

    calendar Aug 6, 2020 (Last modified: Aug 6, 2020)vsphere grafana influx telegraf  ·
    Share on: twitter facebook linkedin copy
    vSphere Performance monitoring with Telegraf, InfluxDB and Grafana 7 - Intro

    It's been three years since I started writing about how we can pull vSphere performance data and create our own realtime monitoring solution. In a series of blog posts I'm revisiting some of the parts, and discuss a few updates for both data pulling and visualization


    Read More
  • Grafana - Importing Dashboards

    calendar Aug 6, 2020 (Last modified: Aug 6, 2020)dashboard performance grafana  ·
    Share on: twitter facebook linkedin copy
    Grafana - Importing Dashboards

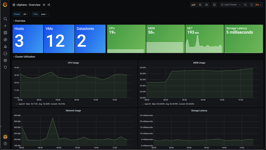
    In this post we will take a quick look at how we can import dashboards to our Grafana instance


    Read More
  • vSphere Performance - Revisiting VCSA Monitoring

    calendar Apr 7, 2020 (Last modified: Apr 7, 2020)vsphere vcsa grafana influx  ·
    Share on: twitter facebook linkedin copy

    In this post I'm revisiting my work on how to monitor a vCenter appliance with the help of REST APIs and open-source tools like InfluxDB and Grafana


    Read More
  • vSphere Performance - Visualizing data around the world with the Grafana Worldmap panel

    calendar Apr 16, 2019 (Last modified: Apr 16, 2019)grafana powercli powershell stats vcenter influxdb  ·
    Share on: twitter facebook linkedin copy

    We're always looking out for new ways to visualize our performance data. Most often to aid our troubleshooting, but sometimes most for fun. This is one of those times. Let's check out how we can visualize our compute usage across the world!


    Read More
  • Monitoring url endpoints with Grafana, Azure and more

    calendar Apr 5, 2019 (Last modified: Apr 5, 2019)grafana ping blog netlify  ·
    Share on: twitter facebook linkedin copy

    After moving my blog to the Hugo platform hosted on Netlify I lost the uptime monitoring I had through Jetpack on Wordpress. As I've worked quite a bit with Grafana I knew about their Worldping service, but I haven't had any real need to test it before now. Now I had the perfect reason for checking it out.


    Read More
  • vSphere Performance - vCenter Server Appliance (VCSA) monitoring

    calendar Dec 3, 2018 (Last modified: May 3, 2025)appliance powershell rest api stats vcenter vsphere influxdb grafana  ·
    Share on: twitter facebook linkedin copy

    This post is a (late) follow-up on a previous post I did about exploring the monitoring endpoints of the vCenter Server Appliance (VCSA), and an addition to the vSphere Performance blog series. Now we will add performance metrics and health status of the VCSA to our monitoring solution. We'll utilize the REST APIs in …


    Read More
  • Slides from my VMworld session

    calendar Nov 12, 2018 (Last modified: May 3, 2025)vbrownbag vmworld  ·
    Share on: twitter facebook linkedin copy

    Last week I did a session about Performance monitoring at VMworld Europe in Barcelona. The session was part of the VMTN Techtalks with vBrownBag. The slides (without the video demos) and the script used in the demo is available at Github. The session was recorded and can be seen on Youtube. Thanks to all that attended …


    Read More
  • vSphere Performance data - New vSphere plugin for Telegraf

    calendar Oct 1, 2018 (Last modified: May 3, 2025)grafana influxdb stats telegraf tick vcenter vsphere  ·
    Share on: twitter facebook linkedin copy

    Recently there was a new release of Telegraf, a monitoring agent from the guys that built InfluxDB. This new version, 1.8.0, comes with a plugin for vSphere which I'm pretty excited about! Previously I've been testing Telegraf for monitoring some Linux VMs and also my InfluxDB servers and the agent works as expected …


    Read More
  • Speaking at VMworld Europe 2018

    calendar Sep 25, 2018 (Last modified: May 3, 2025)vmworld  ·
    Share on: twitter facebook linkedin copy

    The schedule builder for VMworld Europe 2018 in Barcelona is finally live and sessions can be scheduled. For the first time I will have a session at VMworld, as one of the vBrownBag/VMTN community sessions, and I'm really excited about this. It is very cool that these community sessions are available in the schedule …


    Read More
  • Exploring monitoring endpoints in the vCenter Server Appliance (VCSA) REST API

    calendar Aug 20, 2018 (Last modified: May 3, 2025)api rest powershell vcenter  ·
    Share on: twitter facebook linkedin copy

    For a long time, actually since we migrated to the VCSA in 6.5 last year, I've wanted to utilize the REST API in the appliance to have some monitoring of them. For several reasons I've had to put that on hold, one of them being that there seems to be something wrong with the back-end authentication calls. I get …


    Read More
    • ««
    • «
    • 1
    • 2
    • 3
    • 4
    • »
    • »»

Rudi Martinsen

Rudi is a VMware vExpert, a Tanzu Vanguard, and a 2xVCIX (Datacenter Virtualization & Cloud Management and Automation). Currently focusing on Cloud Automation, Tanzu and modern apps
Read More

Featured Posts

  • CKA Study Guide - 2024 edition
  • Gitops Your Scheduled Tasks
  • Introducing the Tanzu Tech Zone
  • VMware Retires Tanzu Community Edition

Recent Posts

  • Adding shared iSCSI based storage to a Proxmox host and cluster
  • Working with structured metadata in Grafana Loki
  • Integrating Proxmox VE with InfluxDB and Grafana for monitoring and visualizing metrics
  • Veeam File level restore with Proxmox
  • Backing up Proxmox VMs with Veeam

Categories

VMWARE 116 KUBERNETES 37 PERFORMANCE 35 VREALIZE 35 TANZU 32 HPE 16 CERTIFICATION 14 SPEAKING 13 PROXMOX 9 GRAFANA 6
All Categories
ARIA1 AVI2 BLOG5 CERTIFICATION14 GRAFANA6 HARBOR1 HPE16 KUBERNETES37 KUBERNETS1 NETCORE2 NSX3 PERFORMANCE35 POWERSHELL6 PROXMOX9 RUNECAST3 SPEAKING13 TANZU32 VMUG3 VMWARE116 VREALIZE35 VSAN1 VSPHERE1
[A~Z][0~9]

Tags

K8S 48 KUBERNETES 41 TANZU 35 VSPHERE 34 CKA 30 GRAFANA 30 POWERSHELL 28 VCENTER 24 POWERCLI 22 VRA 20
All Tags
ALB11 ALERT1 ALERTMANAGER1 AMPLIFIER1 API11 APPLIANCE9 APPLICATIONMODERNIZATION1 ARGOCD1 ARIA6 ARM2 AUTOMATION4 AVI10 AWS1 AZURE1 BACKUP4 BLADECHASSIS2 BLOG5 BRANCHOFFICE1 BUG5 CAREER2 CEPH1 CERTIFICATION14 CKA30 CKAD3 CLARITY1 CLUSTER1 CMA4 COMMUNITY2 CONTAINERS8 CONTOUR1 DASHBOARD2 DEPLOYMENT4 DNS1 DOCKER1 DRS2 ENCLOSURE1 ESXI5 ESXIONARM1 ETCD1 EXAM4 EXPLORE3 FIREWALL2 FIRMWARE3 FLUENTBIT1 FREENAS1 GIT1 GITHUB1 GITOPS1 GLOBALDASHBOARD2 GRAFANA30 HA1 HARBOR2 HARDWARE11 HOMELAB2 HUGO5 ILO2 INFLUX12 INFLUXDB17 INFOSIGHT1 IPMI1 ISCSI1 K8S48 KUBERNETES41 LIMITS3 LOADBALANCER1 LOG4J1 LOGGING2 LOGINSIGHT1 LOKI2 MARKDOWN1 METALLB1 MIGRATION2 MIKROTIK2 MISSIONCONTROL4 MODULE3 MONITORING12 MULTI-CLOUD1 NAMESPACES1 NESTED4 NETLIFY2 NETWORKING1 NFS2 NOTIFICATIONS1 NSX4 NSX-ALB1 NSX-T2 OA2 ONBOARDADMINISTRATOR1 ONEVIEW10 OPENSHIFT1 OPNSENSE2 PDU2 PERFORMANCE9 PERSISTENTVOLUME1 PERSONAL2 PHPIPAM1 PING1 PLEX2 POWERCLI22 POWERSHELL28 PROMETHEUS2 PROMTAIL2 PROXMOX5 PSC2 PVC1 PVE9 PXE3 QUICKTIPS1 RASPBERRYPI2 REALTIME1 REDFISH1 REDHAT1 REMOTEOFFICE1 REST5 RIBCL1 RUNECAST1 SALTSTACK1 SCHEDULEDTASK1 SECURITY3 SLACK2 SPEAKING1 SPECIALIST1 STATS15 STORAGE2 STORAGEPOLICY5 SUPPORTBEE1 SWAPI1 SYSLOG1 TANZU35 TANZUMISSIONCONTROL1 TASKSCHEDULER1 TCE11 TELEGRAF12 TEMPLATE1 THEME2 TICK3 TICKETS1 TKG2 TKGS1 TMC7 UPGRADE8 VANGUARD1 VBROWNBAG2 VCAP5 VCENTER24 VCIX3 VCP2 VCSA2 VEBA1 VEEAM2 VELERO2 VEXPERT6 VIDM1 VIRTUALIZATION6 VMUG5 VMWARE18 VMWORLD7 VRA20 VREALIZE16 VREALIZE-CLOUD1 VRLI7 VRO10 VROPS4 VRSLCM2 VSAN8 VSPHERE34 VULNERABILITY1 WINDOWS1 WINDOWS 20161 WSA1 ZFS4
[A~Z][0~9]
rudimartinsen.com

Copyright 2017-  RUDIMARTINSEN.COM. All Rights Reserved

to-top