Grafana - Importing Dashboards
This is a quick post on how we can import pre created dashboards to Grafana. This is a nice feature which let's us get some nice visualizations very quickly provided that the data we have in our environment matches that of the dashboard creator
Normally I always create my dashboards from scratch, so for me the import feature, and dashboards created by others, is a way to get some inspiration and maybe learn how to use the data. I think that one get's more value from creating the dashboard yourself and also that you get to know the data more than by just using something others have built.
With that said I respect that for other people the ability to use predefined dashboards is what they want to do, so let's see how we can do just that in Grafana.
I am using Grafana 7.0 in my example, but earlier versions should work pretty much the same.
Over on grafana.com you can find lots of dashboard ready to import. Make sure you import dashboards that uses datasources with the same kind of metrics that you have in your environment.
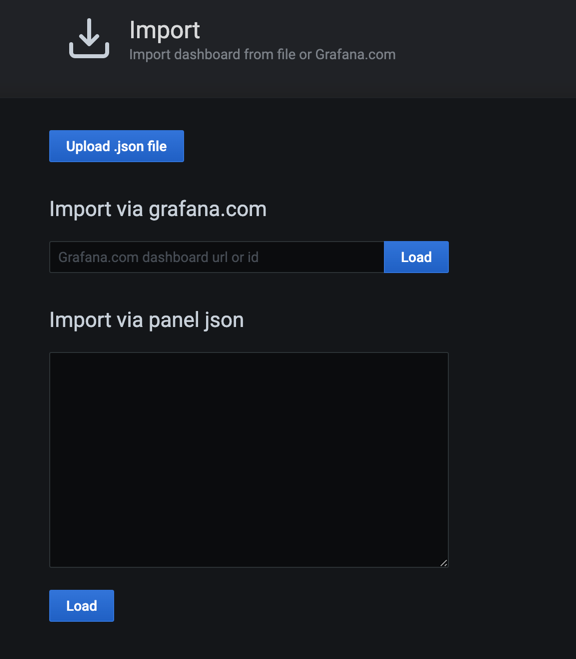
When you have found a dashboard to import you can do this through the UI in three ways
- By importing directly from grafana.com/dashboards
- By pasting the JSON model of a dashboards
- By uploading the JSON model through a file
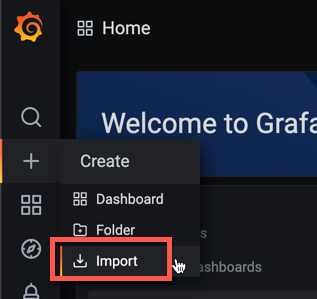
All of these are available when you click Import in the Create menu item in Grafana
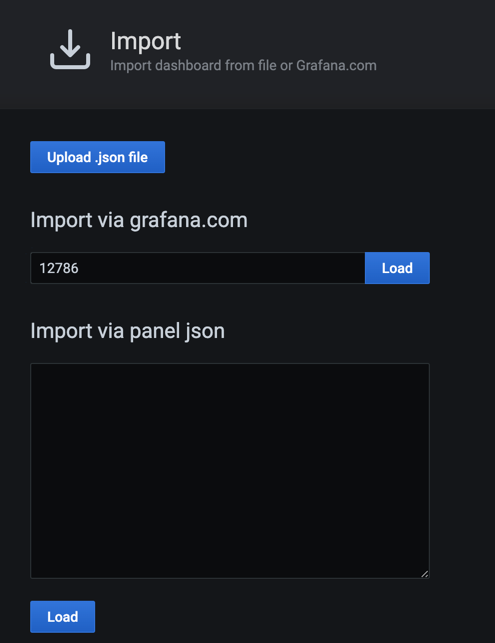
The easiest is probably to import a dashboard is to add the URL or ID of a dashboard uploaded to grafana.com/dashboards
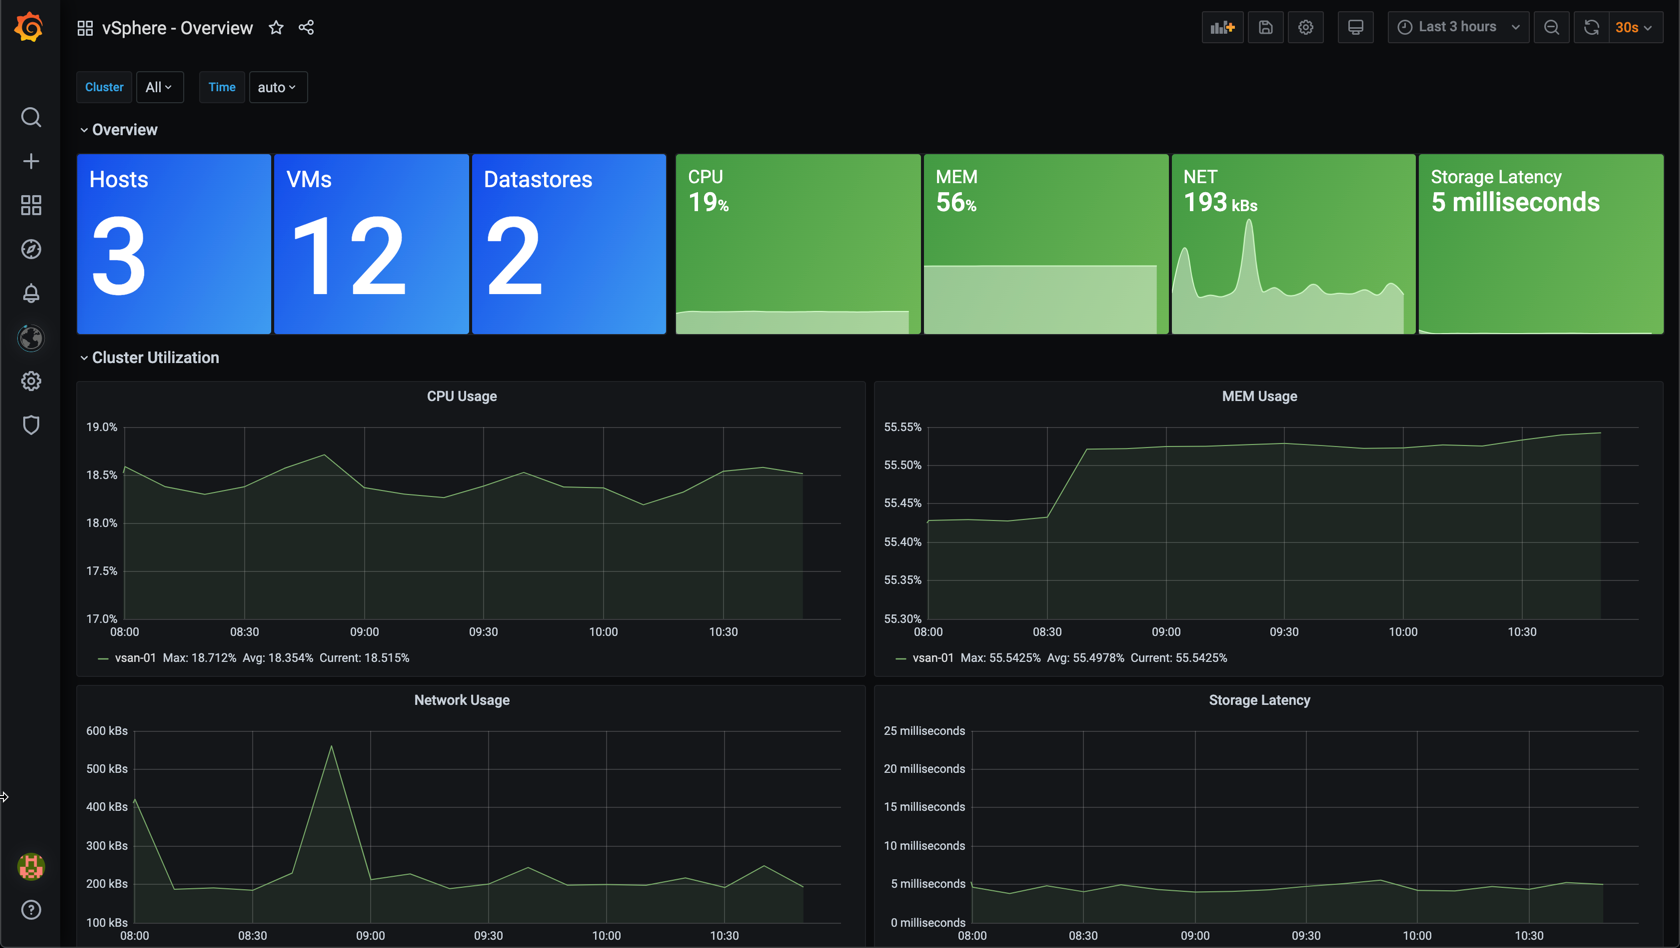
For this I'll use one of my dashboards created in my 2020 vSphere Performance monitoring series. It's uploaded to grafana.com and has the ID 12786 which I'll put in the Import via grafana.com field and hit Load
Grafana will fetch the dashboard from grafana.com and pull out the details of it. Notice that you might get some warnings where you have the same values already in your Grafana instance
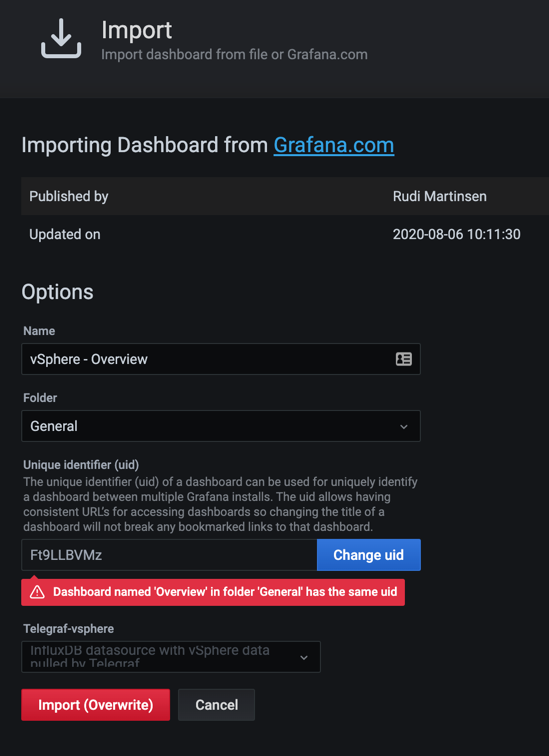
Adjust the names and folder as you want. If you need to fix the UID (as in my example) just hit Change UID, clear the field and leave it blank, Grafana will generate a new one.
The most important step here is to select the correct datasource
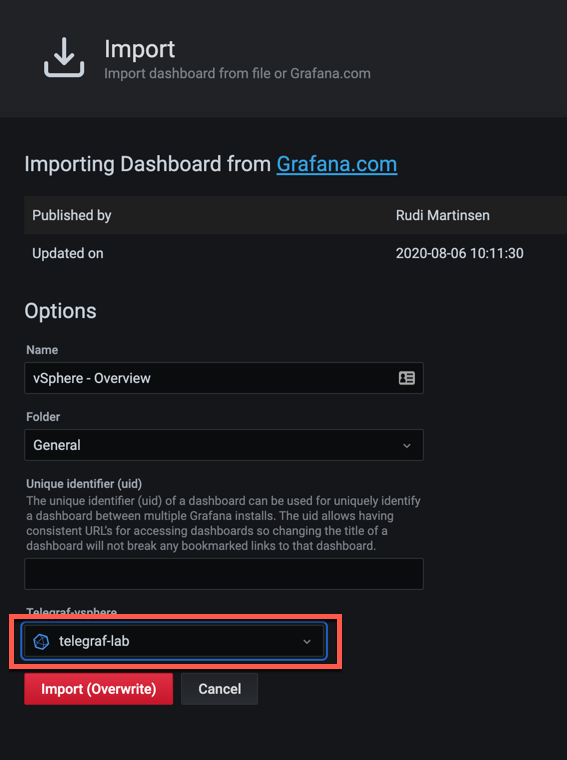
After this hit the Import button and hopefully you should have a new dashboard in your environment
More information can be found in the documentation