How to Monitor Your Node.js Application Using OpenTelemetry and the Grafana LGTM stack
Overview
In this post we'll take a look at how to instrument an application to send signals (metrics, logs, traces) to an OpenTelemetry collector. In our case we use Grafana Alloy as the collector. Alloy will be responsible for processing and exporting these signals to different backends.
The post is quite long and should probably have been broken out in multiple posts, but I wanted to do an all-in-one to show how everything fits together. Feel free to use the TOC above to navigate
The data flow will end up something like the following illustration
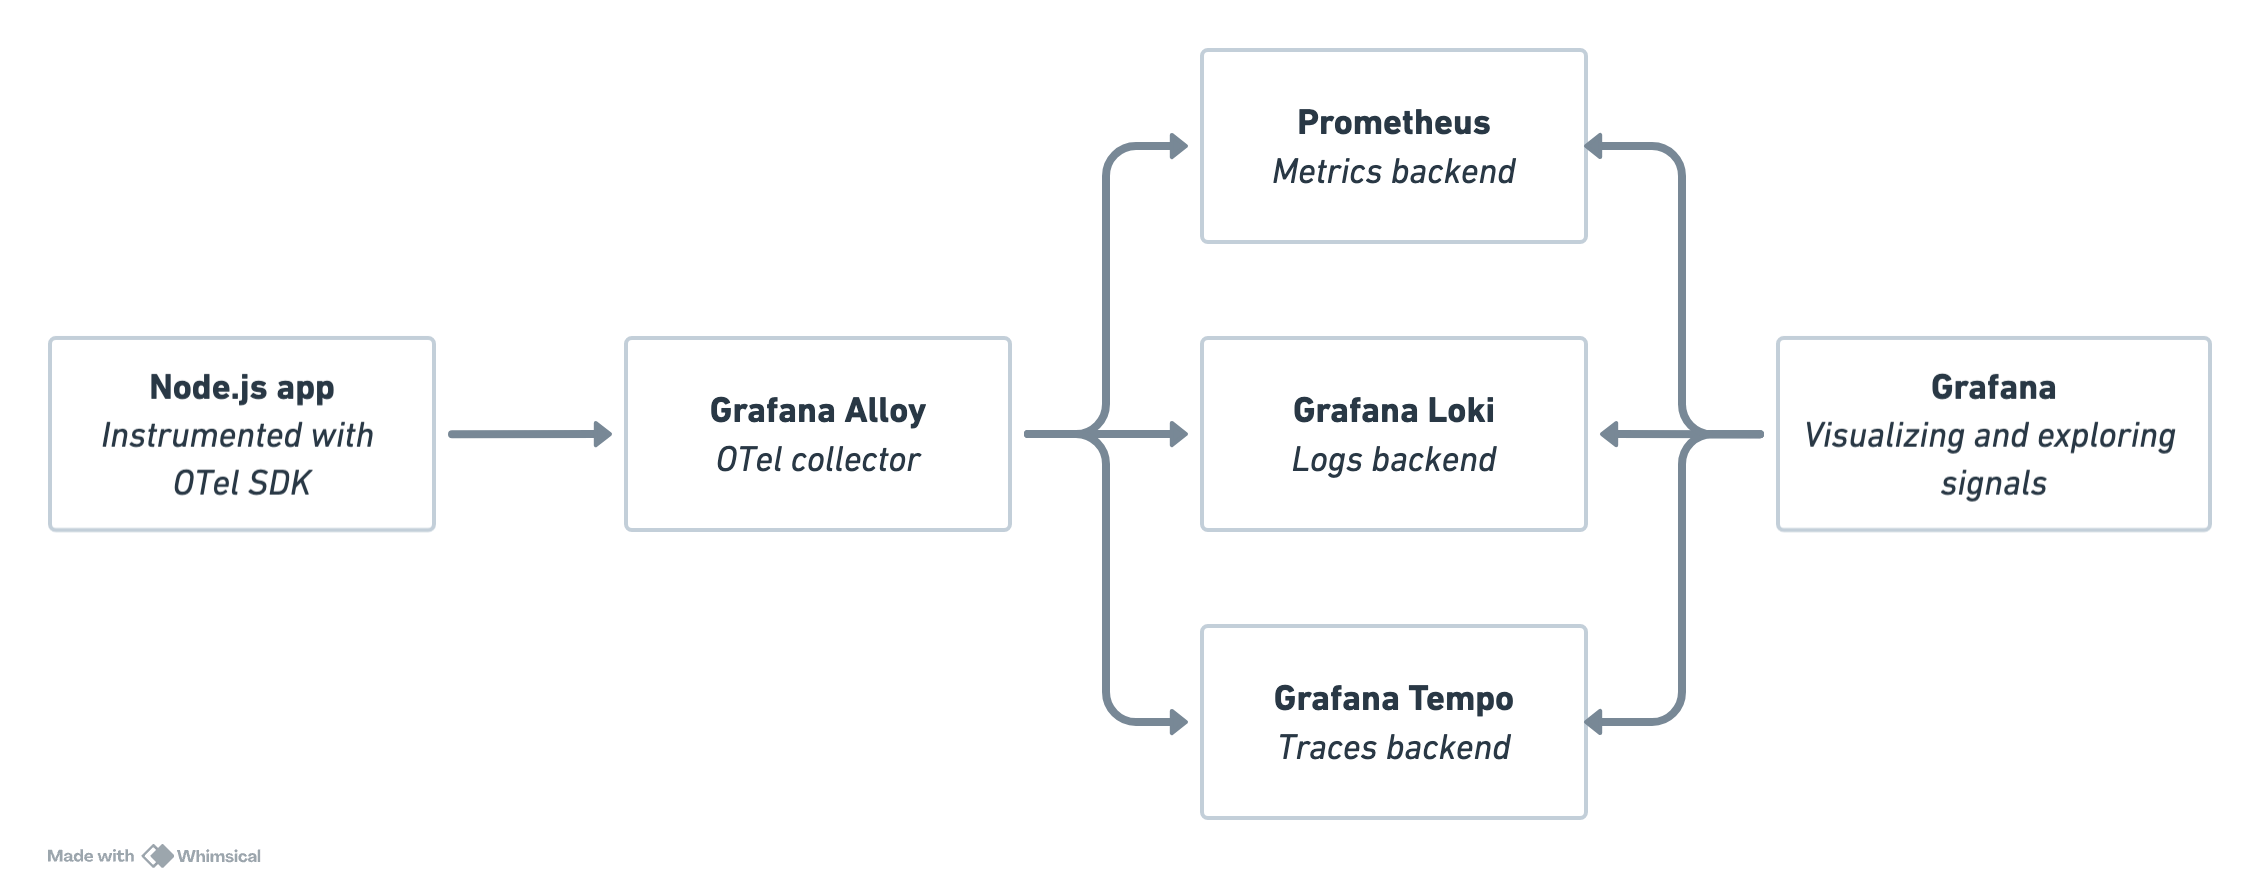
We'll use the OpenTelemetry framework in this post, but the components we use comes from Grafana Labs.
The purpose of this mini-series is to explore and show how things fit together. It's not meant for setting up a production environment.
The other posts in this mini-series
We'll not go in to much detail about OpenTelemetry concepts in this post, there's plenty of resources available out there on that. Please refer to the What is OpenTelemetry? page over at opentelemetry.io for an overview
Metrics
The App
The app we'll use as an example in this post is a custom Node.js app which serves an API integrating with a PostgreSQL database. This simple app stores information about stocks and portfolios. Both the backend Node.js app and the database is running in Kubernetes. There's no UI for the app and just a few API endpoints for querying the database and updating portfolio and stock details.
An example of an API endpoint would be the /api/stocks/<symbol> endpoint which takes a symbol as a parameter and searches for it in the database
1router.get('/:symbol', async (req, res) => {
2  console.debug(`Searching for stock with symbol ${req.params.symbol}`);
3
4  const { symbol } = req.params;
5
6  const result = await pool.query('SELECT * FROM stocks WHERE symbol = $1', [symbol]);
7
8  res.json(result.rows[0]);
9});
Instrumentation in the application
For instrumenting the Node.js app we'll use the example configuration from OpenTelemetry as a starting point. At first we'll leave tracing commented out, and we'll add the OTLPMetricExplorer instead of the default ConsoleMetricExporter.
 1/*instrumentation.js*/
 2// Require dependencies
 3const opentelemetry = require('@opentelemetry/api');
 4const { NodeSDK } = require('@opentelemetry/sdk-node');
 5//const { ConsoleSpanExporter } = require('@opentelemetry/sdk-trace-node');
 6const {
 7  getNodeAutoInstrumentations,
 8} = require('@opentelemetry/auto-instrumentations-node');
 9const {
10    OTLPMetricExporter,
11  } = require('@opentelemetry/exporter-metrics-otlp-proto');
12const {
13  PeriodicExportingMetricReader,
14  ConsoleMetricExporter,
15} = require('@opentelemetry/sdk-metrics');
16
17const sdk = new NodeSDK({
18  //traceExporter: new ConsoleSpanExporter(),
19  metricReader: new PeriodicExportingMetricReader({
20    exporter: new OTLPMetricExporter({
21      url: process.env.OTLP_METRIC_EXPORTER_URL || 'http://localhost:4318/v1/metrics', // Default to localhost if env variable is not set
22      headers: {
23        'Content-Type': 'application/x-protobuf',
24      },
25    }),
26  }),
27  instrumentations: [getNodeAutoInstrumentations()],
28});
29console.log('Starting OpenTelemetry SDK...');
30sdk.start();
Note that the url for the OTLPMetricExporter defaults to localhost, but we'll provide the URL in the OTLP_METRIC_EXPORTER_URL environment variable. We'll point this to our Grafana Alloy collector.
As we can see we're enabling the Node autoinstrumentations, meaning that we rely on the OpenTelemetry Node SDK to generate metrics and traces automatically. If needed we can add our own custom instrumentation on top of this, but for our use-case we'll get more than enough with the autoinstrumentation.
To have our Node.js app use the instrumentation code we'll add the instrumentation.js file as a requirement for the node process with the --require instrumentation.js flag when running the app, i.e node --require instrumentation.js app.js.
Collector config for metrics
At this point our Alloy collector is just set up to scrape and forward metrics about itself. Now it needs to be configured to receive OTLP metrics and how it should process and export the data to a metrics backend which in this example is an existing Prometheus server.
We'll add the following config to the /etc/alloy/config.alloy file
 1otelcol.exporter.prometheus "default" {
 2  forward_to = [prometheus.remote_write.default.receiver]
 3}
 4
 5otelcol.receiver.otlp "default" {
 6  http {}
 7
 8  output {
 9    metrics = [otelcol.exporter.prometheus.default.input]
10  }
11}
The receiver otelcol.receiver.otlp named default doesn't have much configuration options, besides the empty http {} block and the output. The output instructs it to forward metrics to otelcol.exporter.prometheus.default.input. This points to the otelcol.exporter.prometheus component also named default. This in turn forwards to the prometheus.remote_write.default.receiver. This is already used for writing to our Prometheus backend.
Instead of sending the metrics directly to the otelcol.exporter.prometheus component we could have made use of a otelcol.processor which would process the data before sending it through. This is one of the use cases for using a collector instead of sending data directly to the backend.
In a production setup there is a recommendation to at least use the
otelcol.processor.batchcomponent before passing metrics to an exporter. For more information refer to the Alloy documentation
Our full Alloy config at this point
 1logging {
 2  level = "info"
 3  write_to = [loki.write.default.receiver]
 4}
 5
 6livedebugging {
 7  enabled = true
 8}
 9
10prometheus.exporter.self "default" {
11}
12
13prometheus.scrape "metamonitoring" {
14  targets    = prometheus.exporter.self.default.targets
15  forward_to = [prometheus.remote_write.default.receiver]
16}
17
18prometheus.remote_write "default" {
19  endpoint {
20    url = "http://<PROMETHEUS_ENDPOINT>/api/v1/write"
21  }
22}
23
24loki.write "default" {
25  endpoint {
26    url = "http://<LOKI_ENDPOINT>/loki/api/v1/push"
27  }
28}
29
30otelcol.exporter.prometheus "default" {
31  forward_to = [prometheus.remote_write.default.receiver]
32}
33
34otelcol.receiver.otlp "default" {
35  http {}
36
37  output {
38    metrics = [otelcol.exporter.prometheus.default.input]
39  }
40}
After reloading the Alloy config we can check the updated graph in the UI
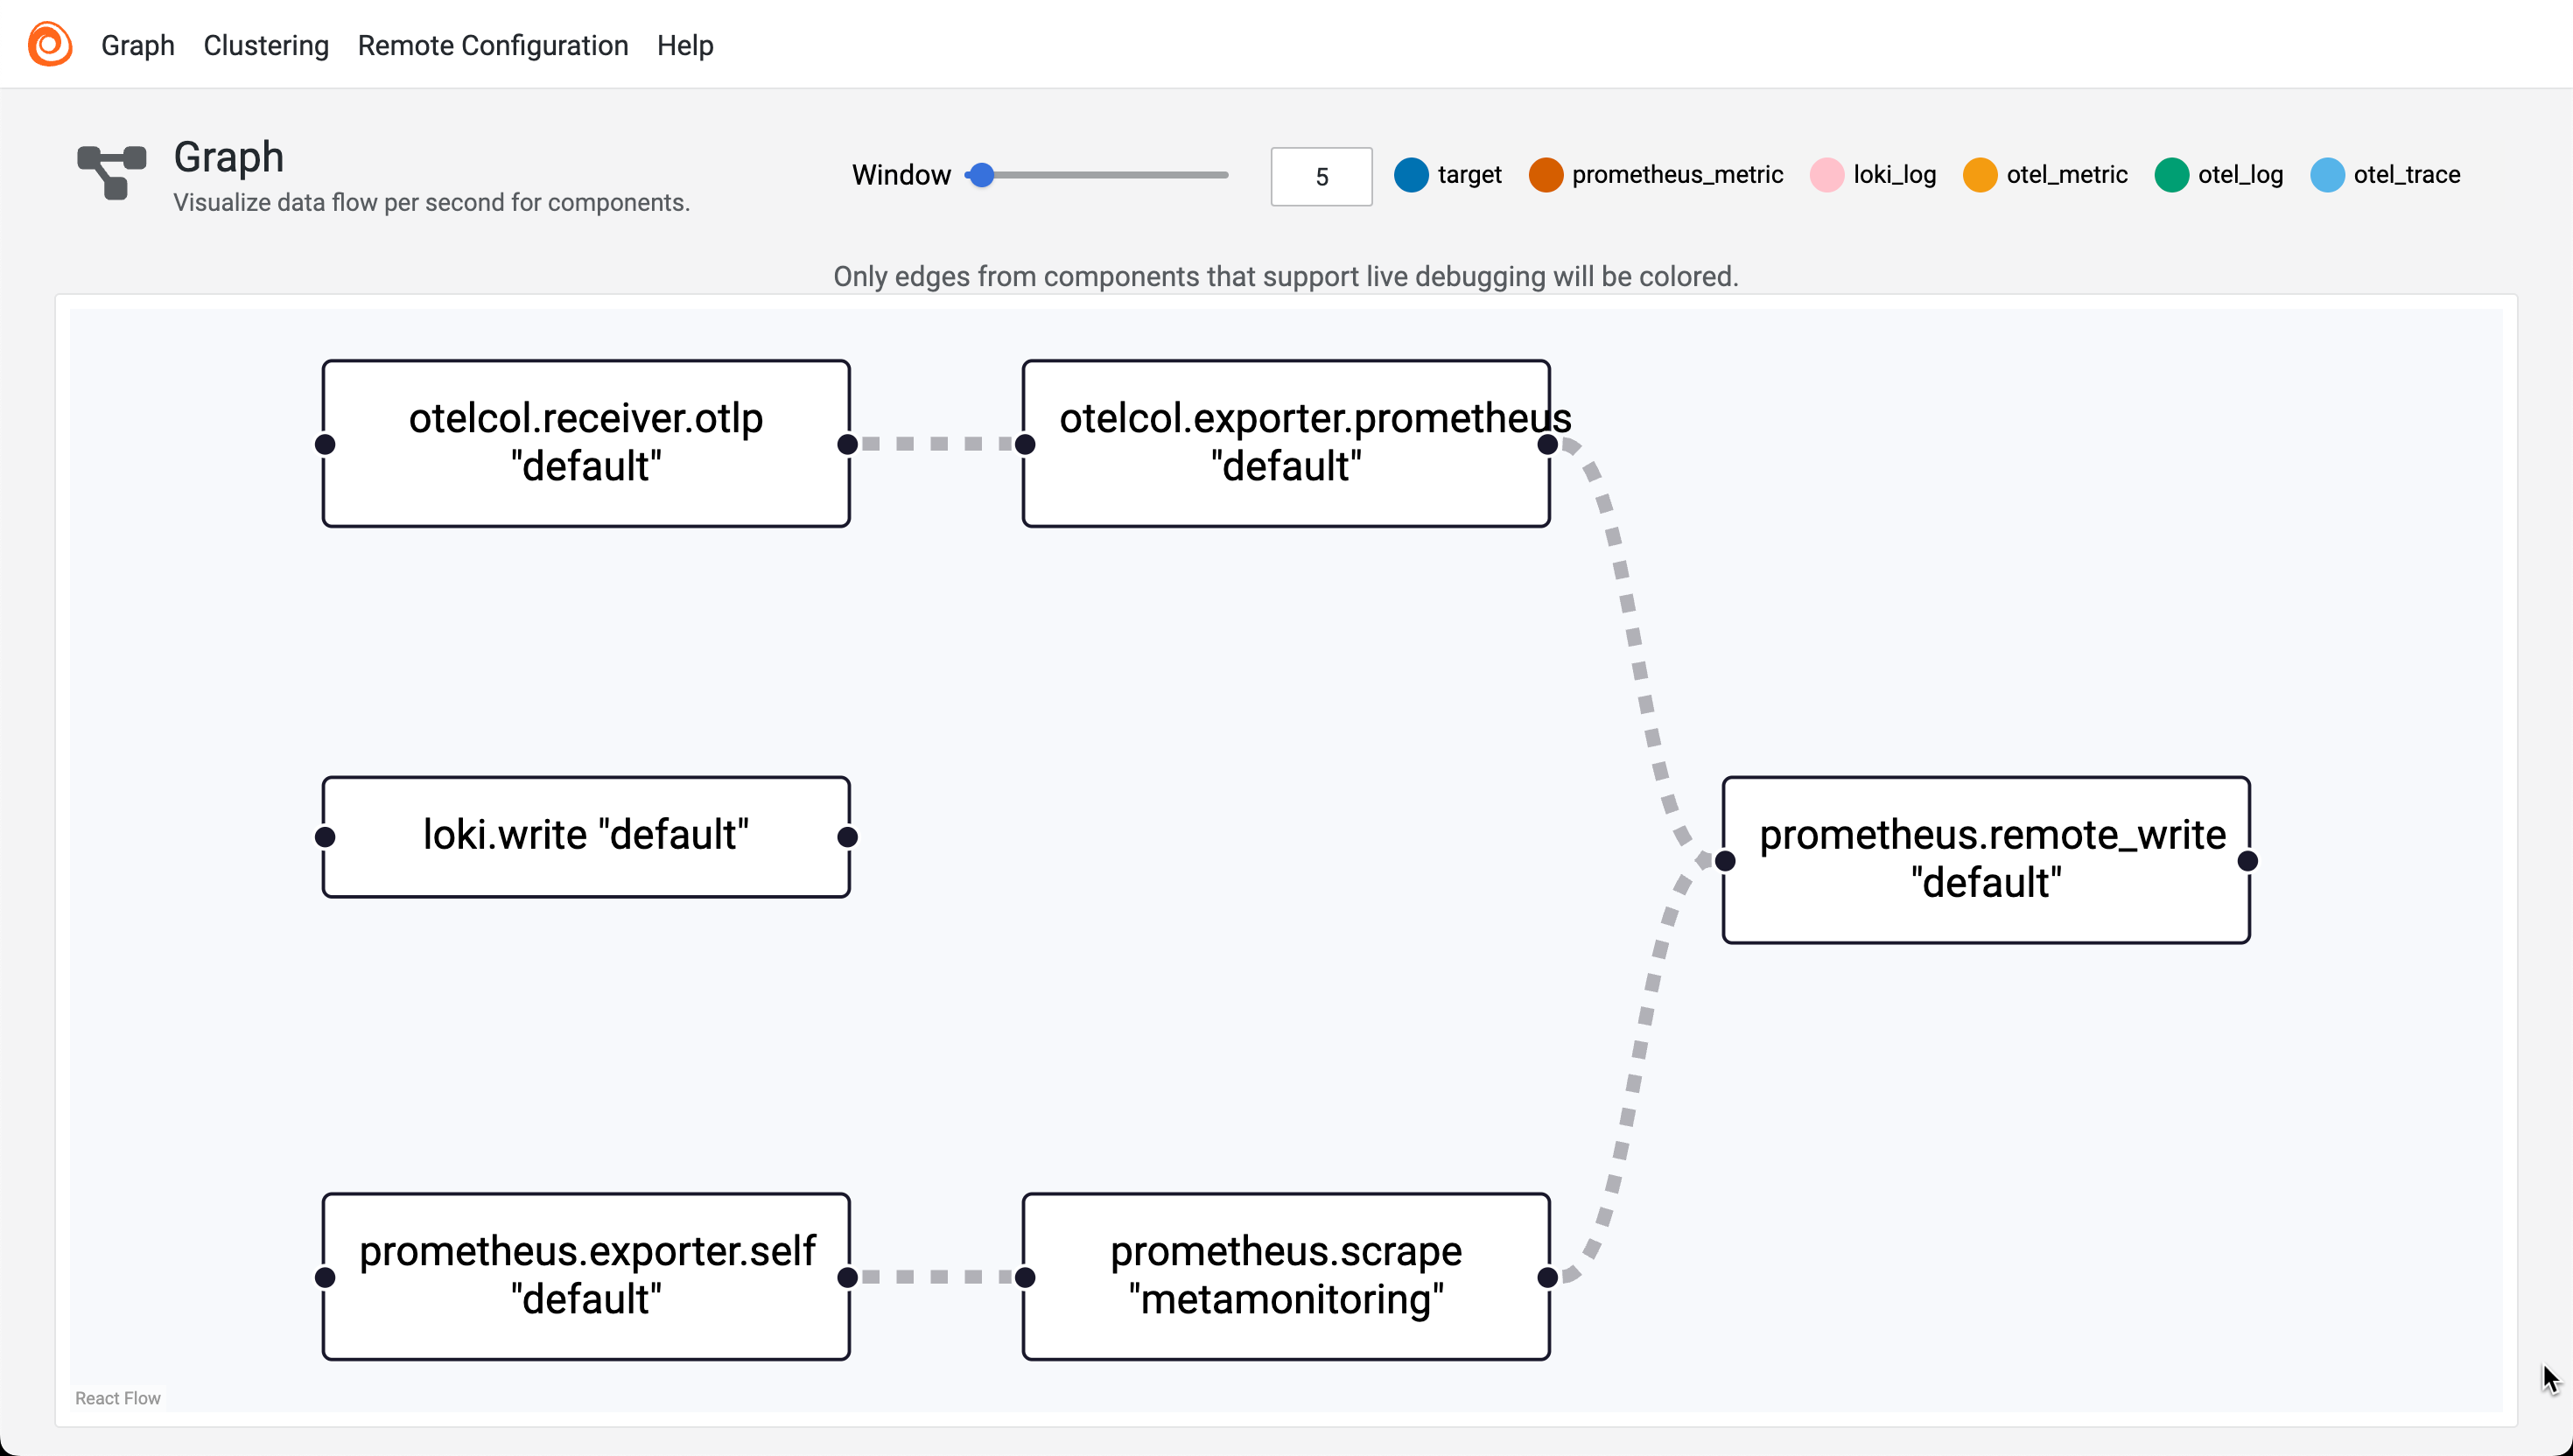
Note that the current Alloy config can be used by other applications as well, it's not limited to the currently instrumented app.
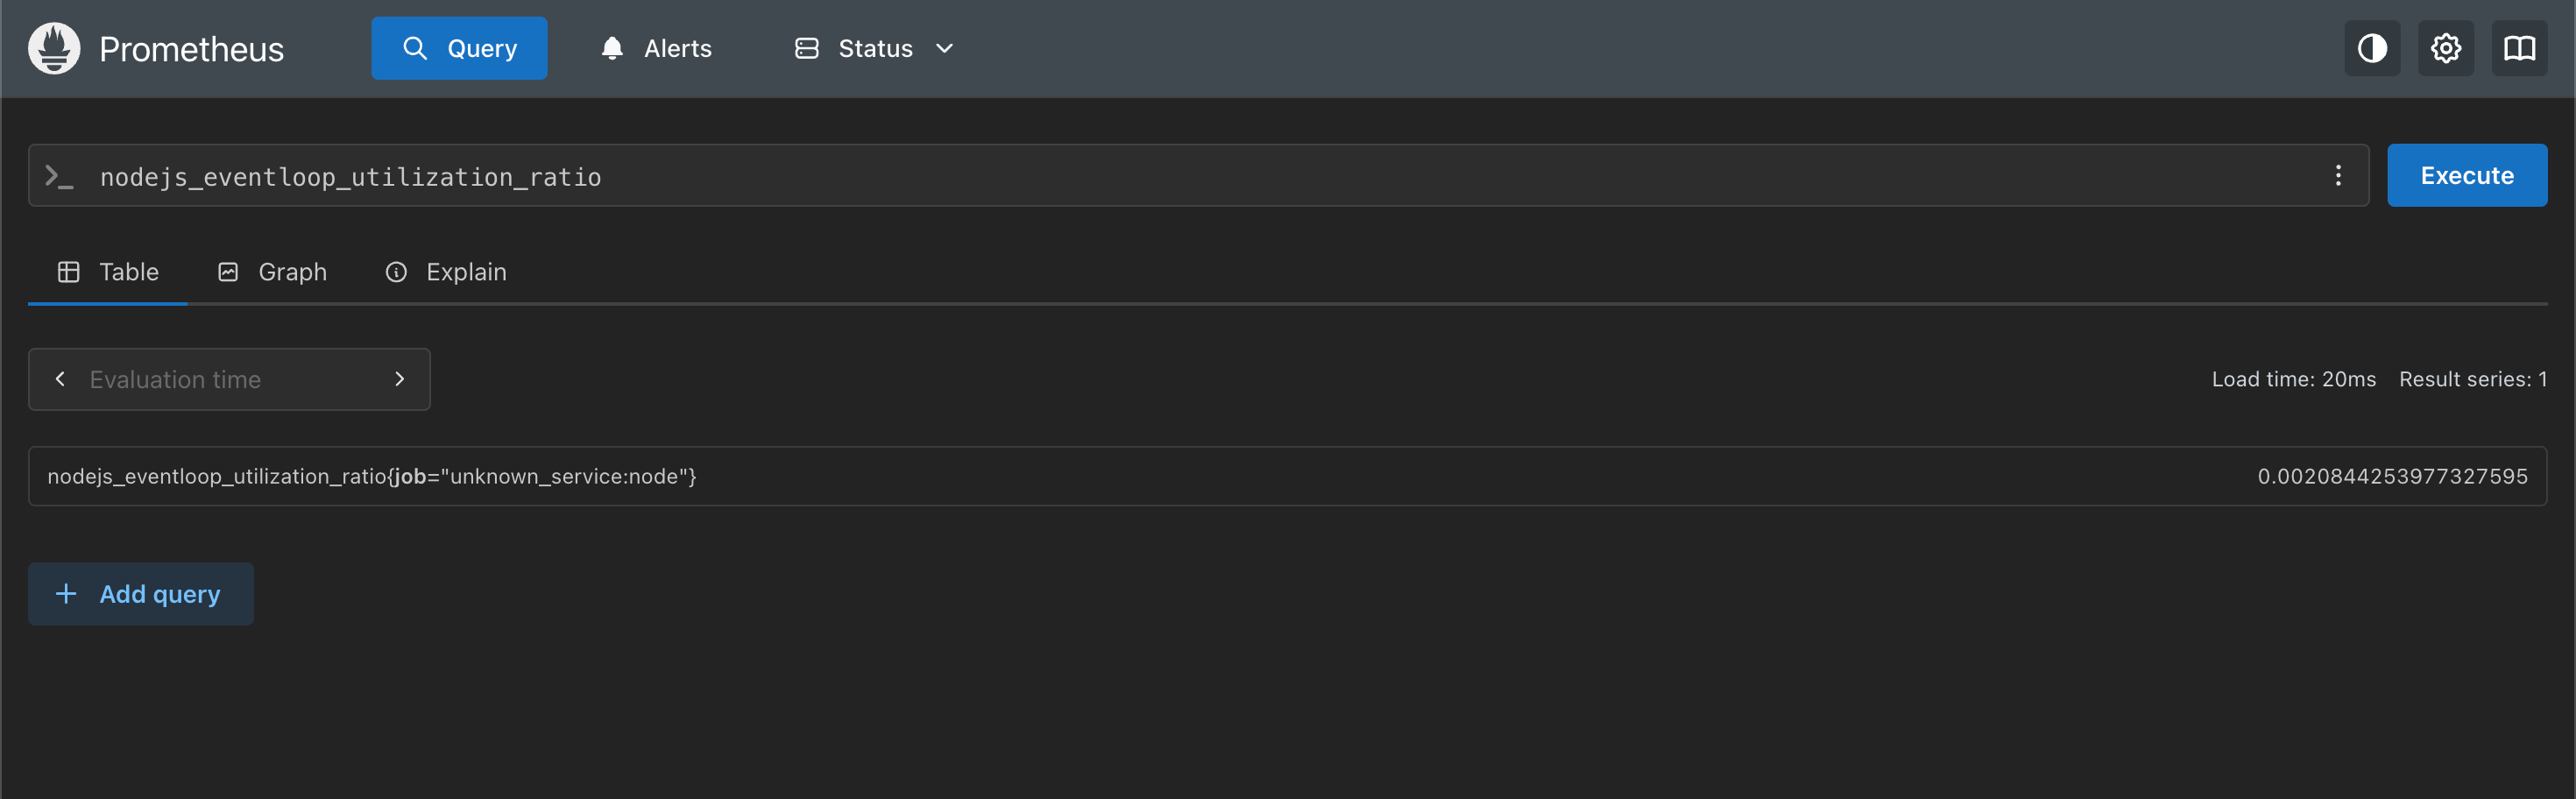
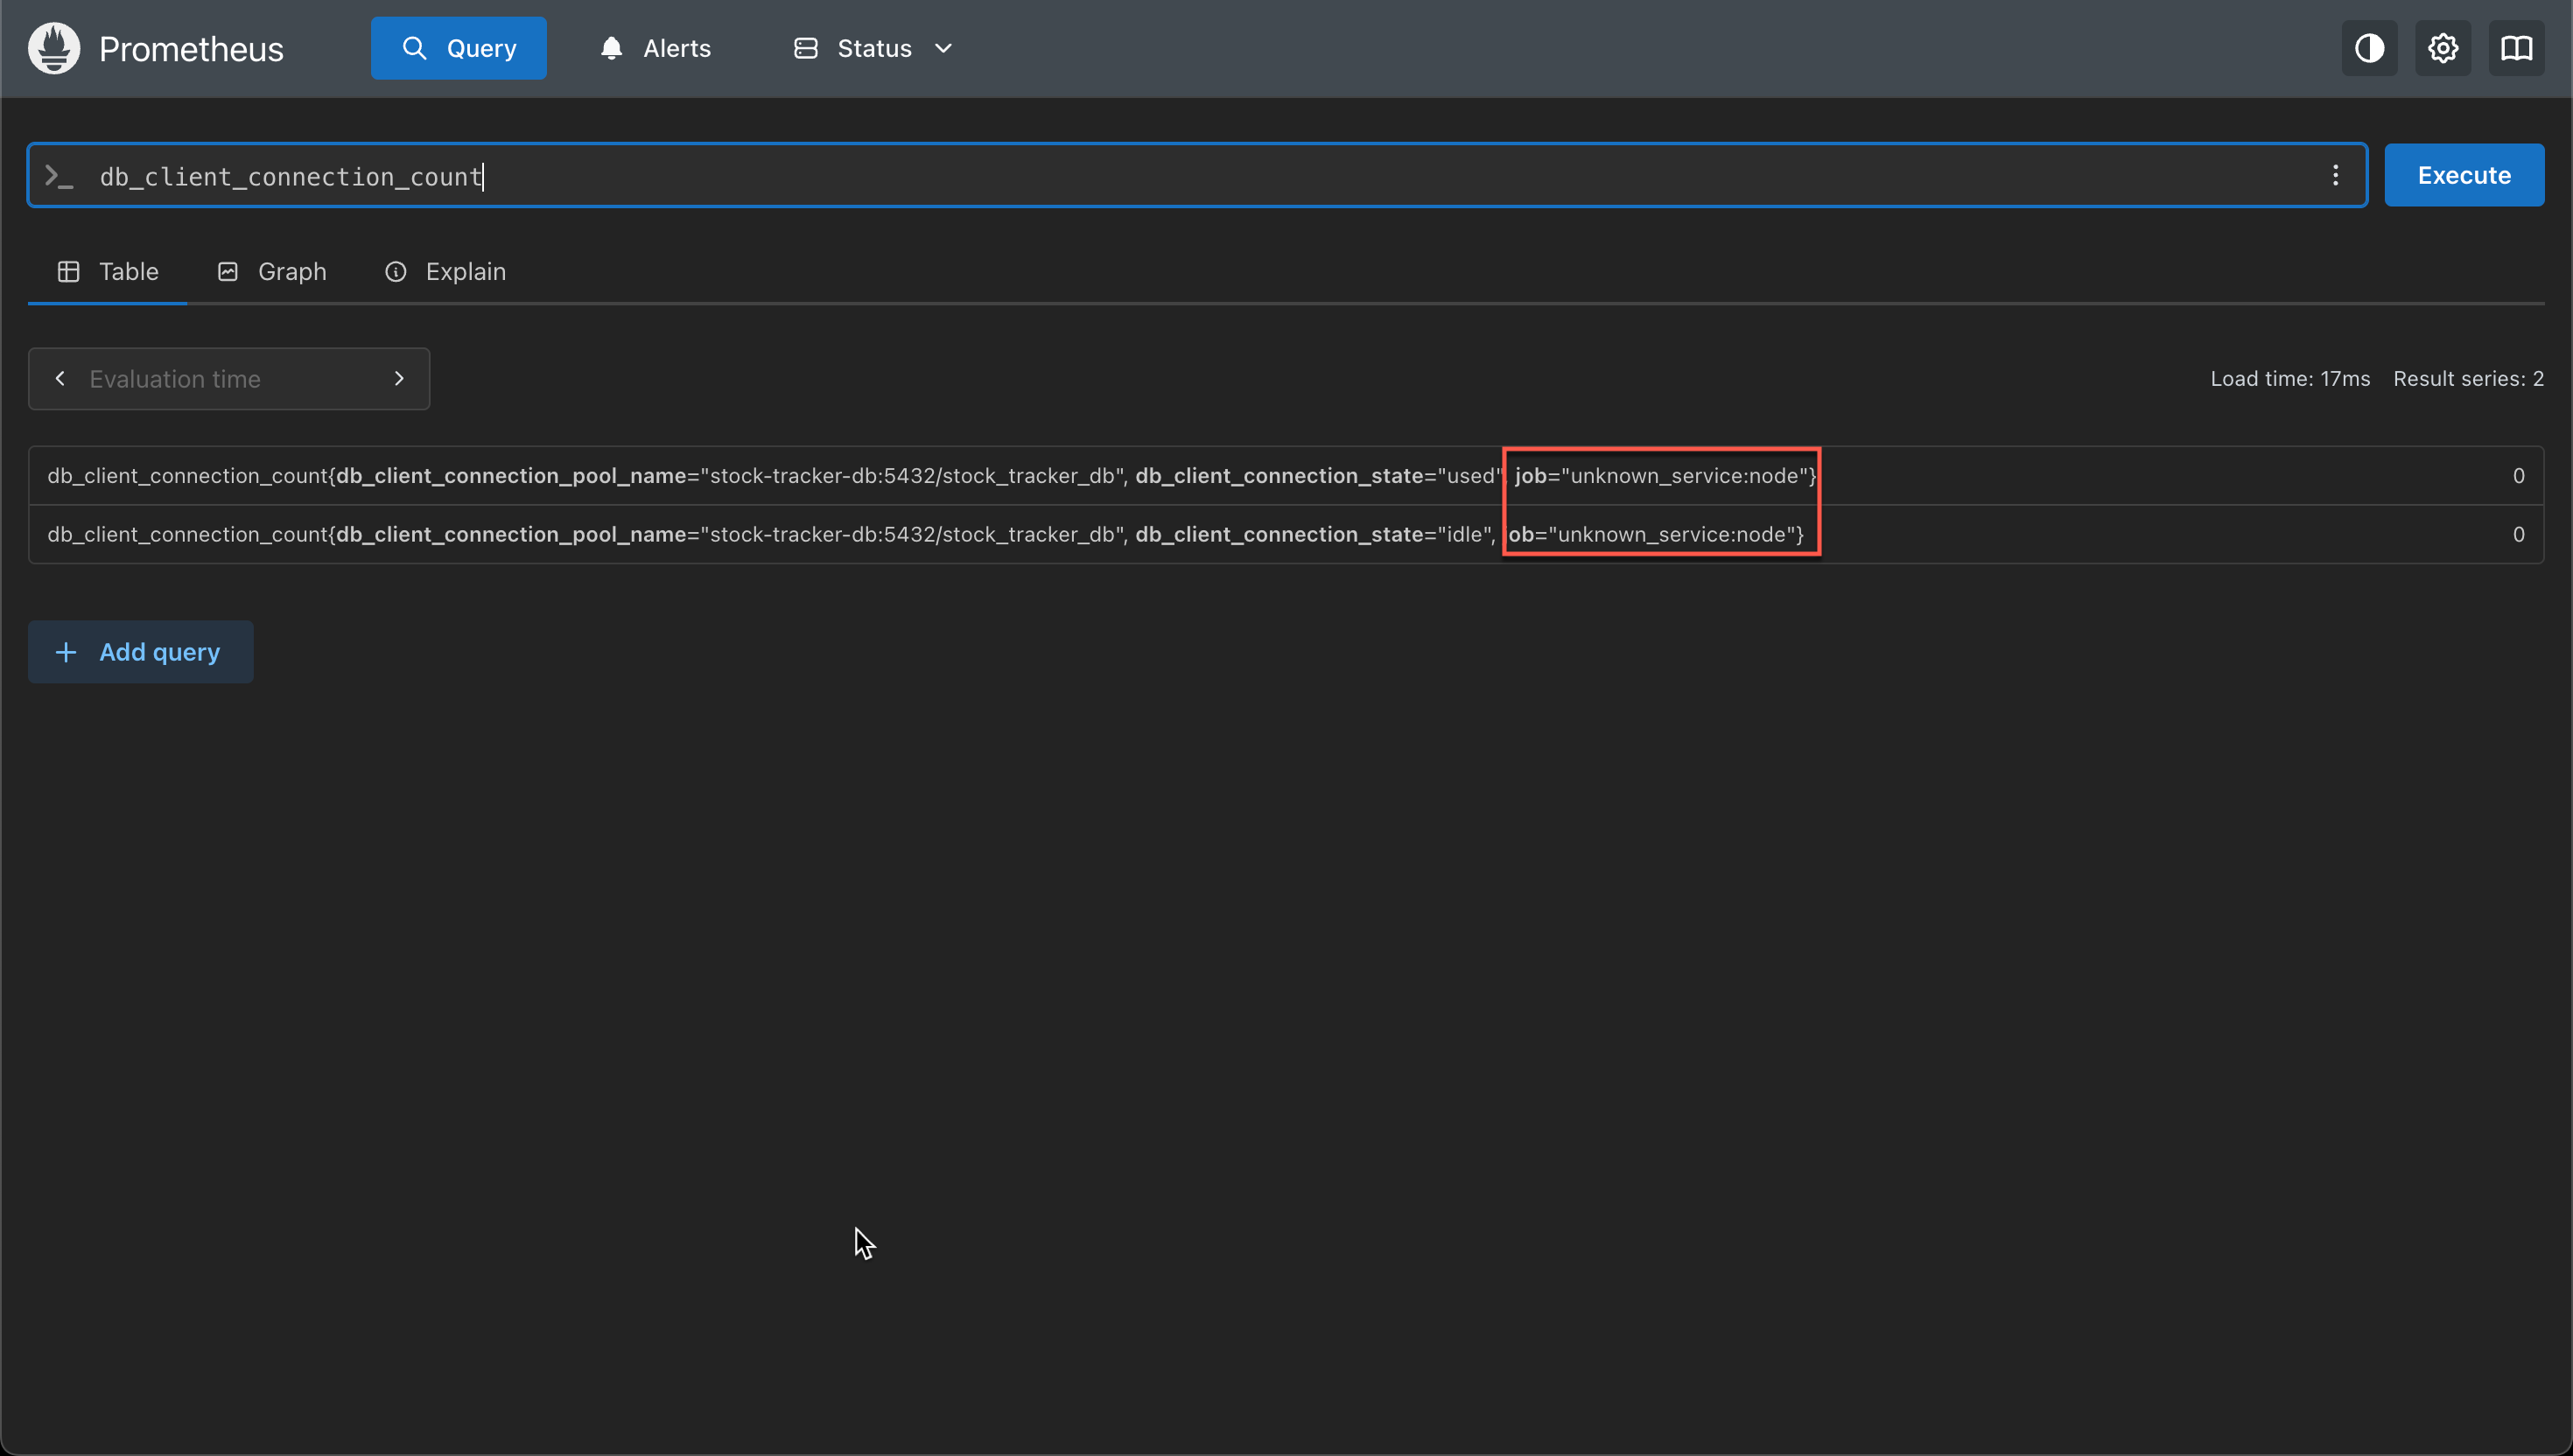
In our Prometheus backend we can verify that some new metrics have appeared
We can also visualize the data in Grafana
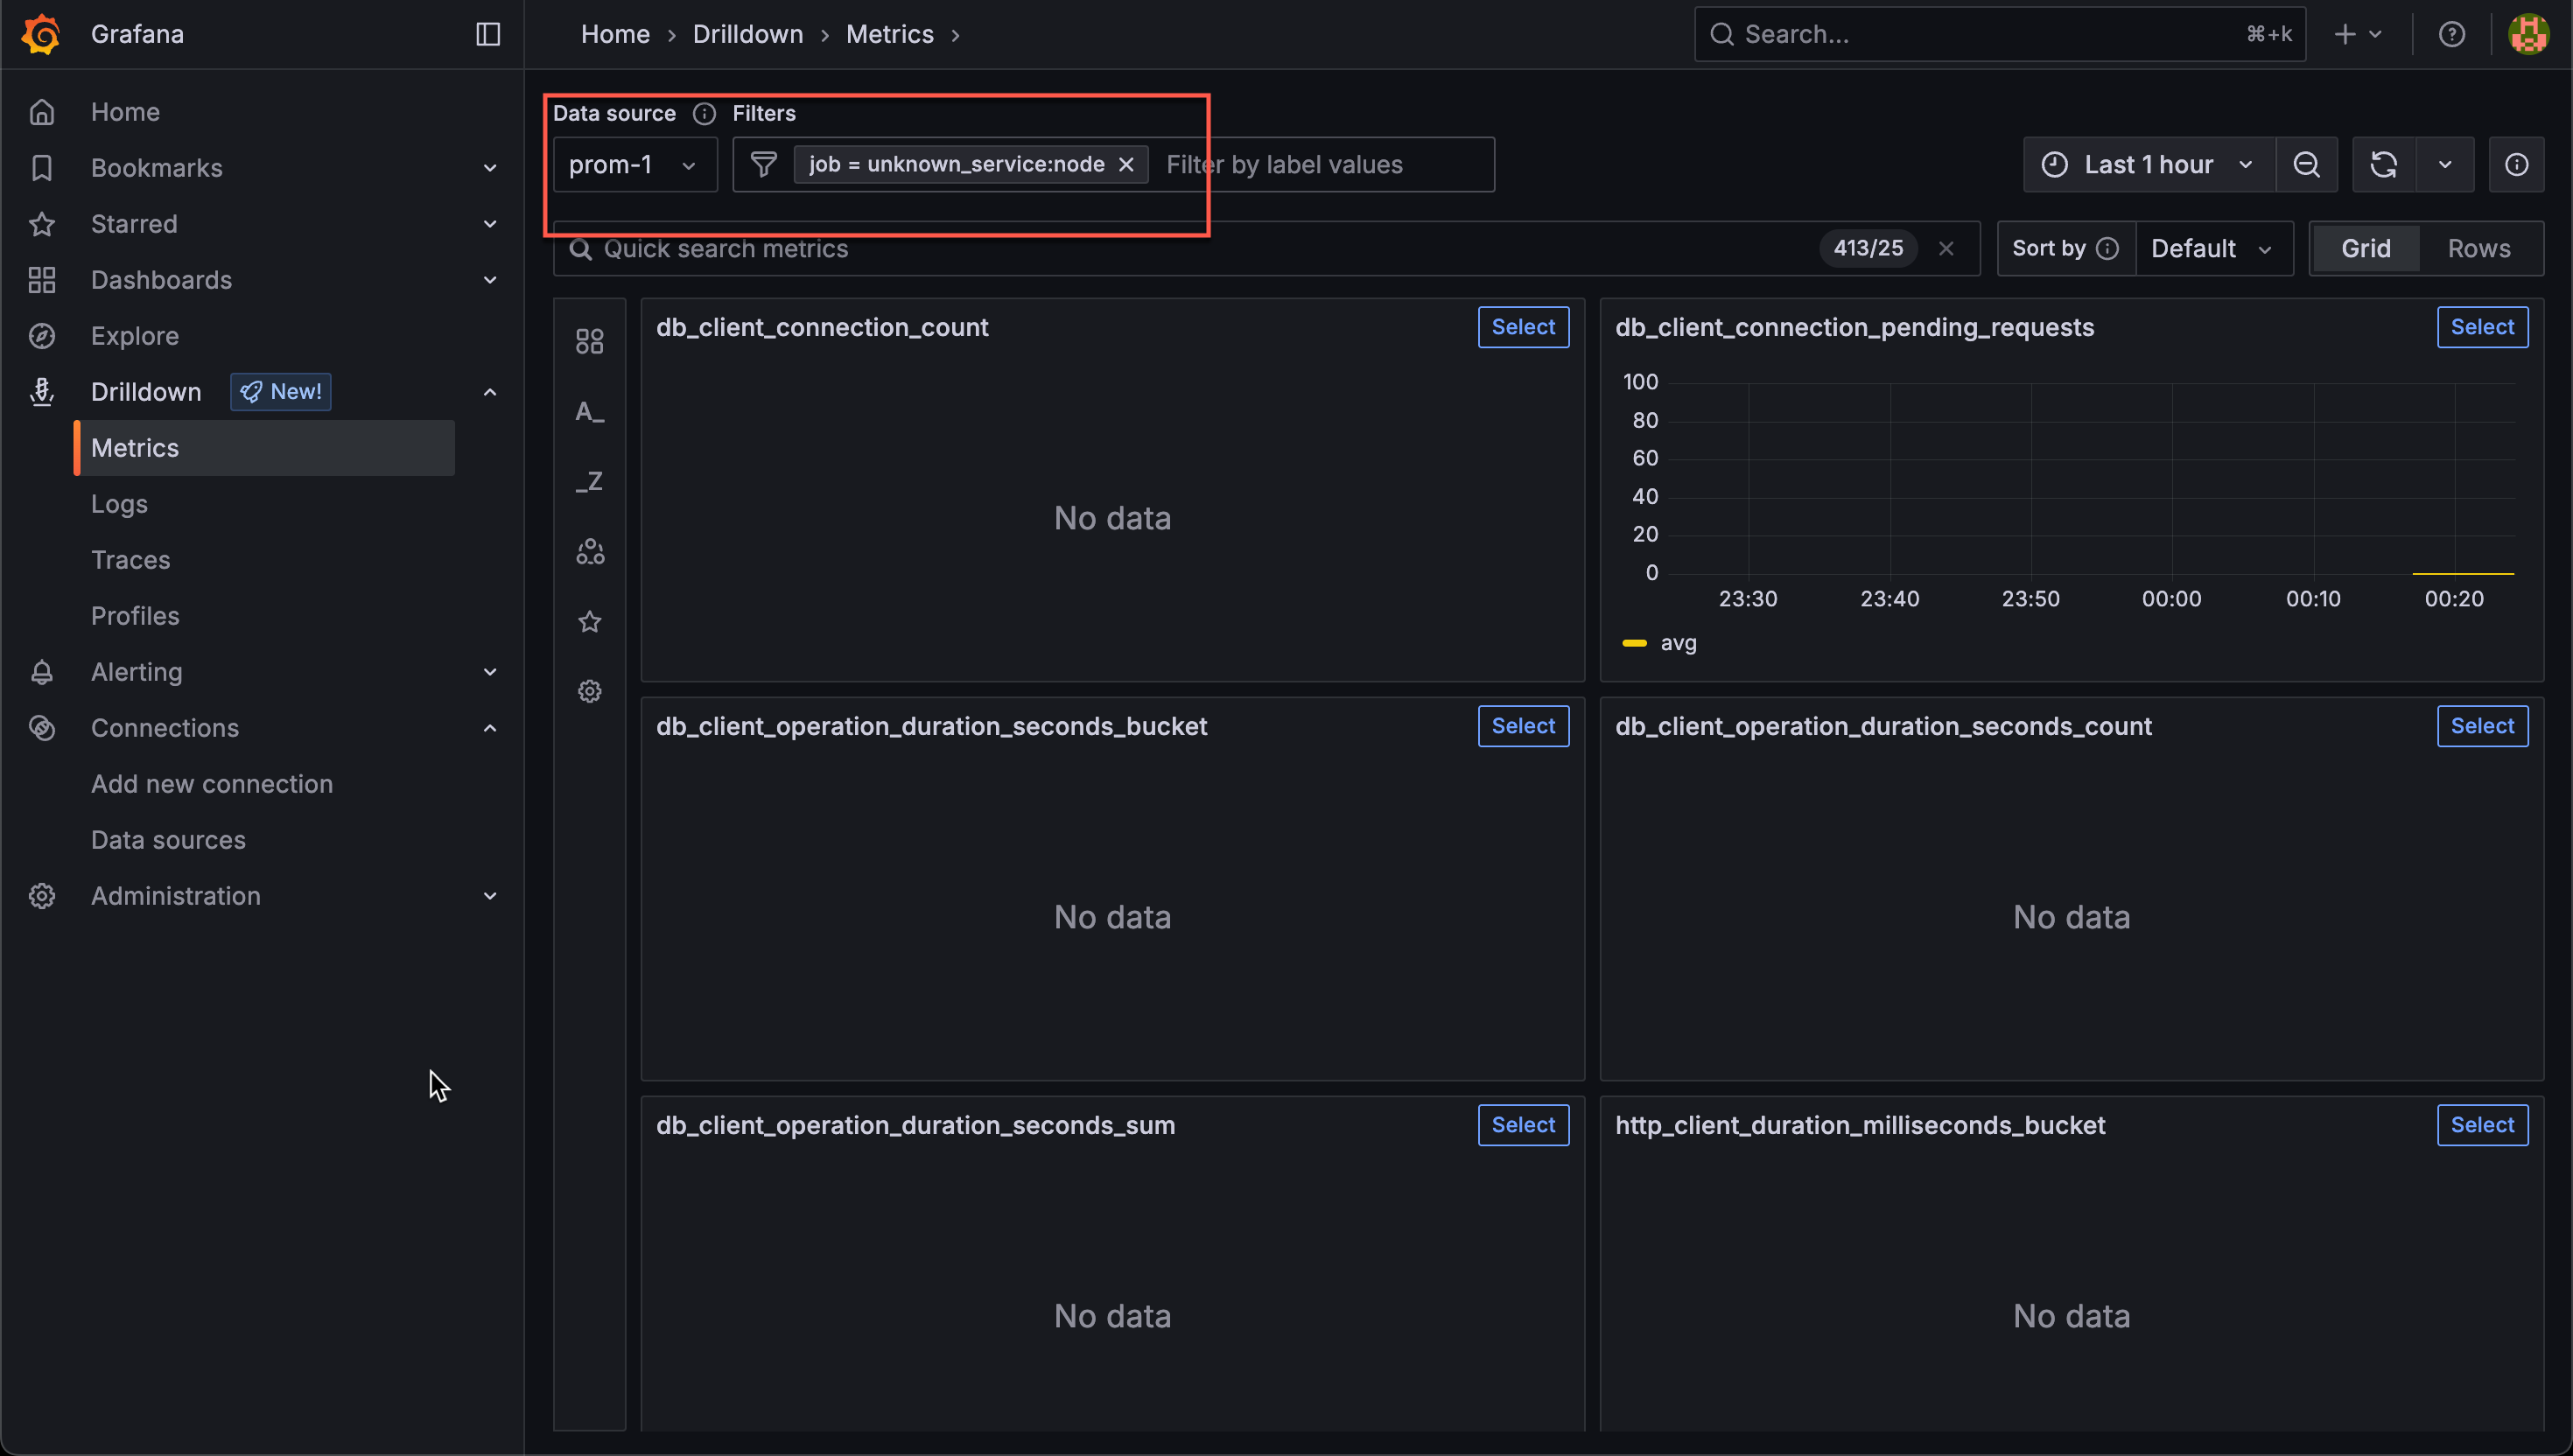
Note that the job label mentions unknown_service:node as the value. This is because we haven't named our OTLP metrics yet. We'll fix that shortly.
Configure OTLP metadata
So, to make our metrics a tad more usable we'll add a service name. There's different ways of doing this through resource attributes. Please refer to the OpenTelemetry docs for more info
We'll go with adding the resource definition via Environment variables. So by setting the OTEL_SERVICE_NAME variable the metrics will automagically add that service name. In addition a number of out of the box labels are added, check the documentation for more info
If wanted one could add more resource attributes. With the environment variables option we could do this through the OTEL_RESOURCE_ATTRIBUTES variable.
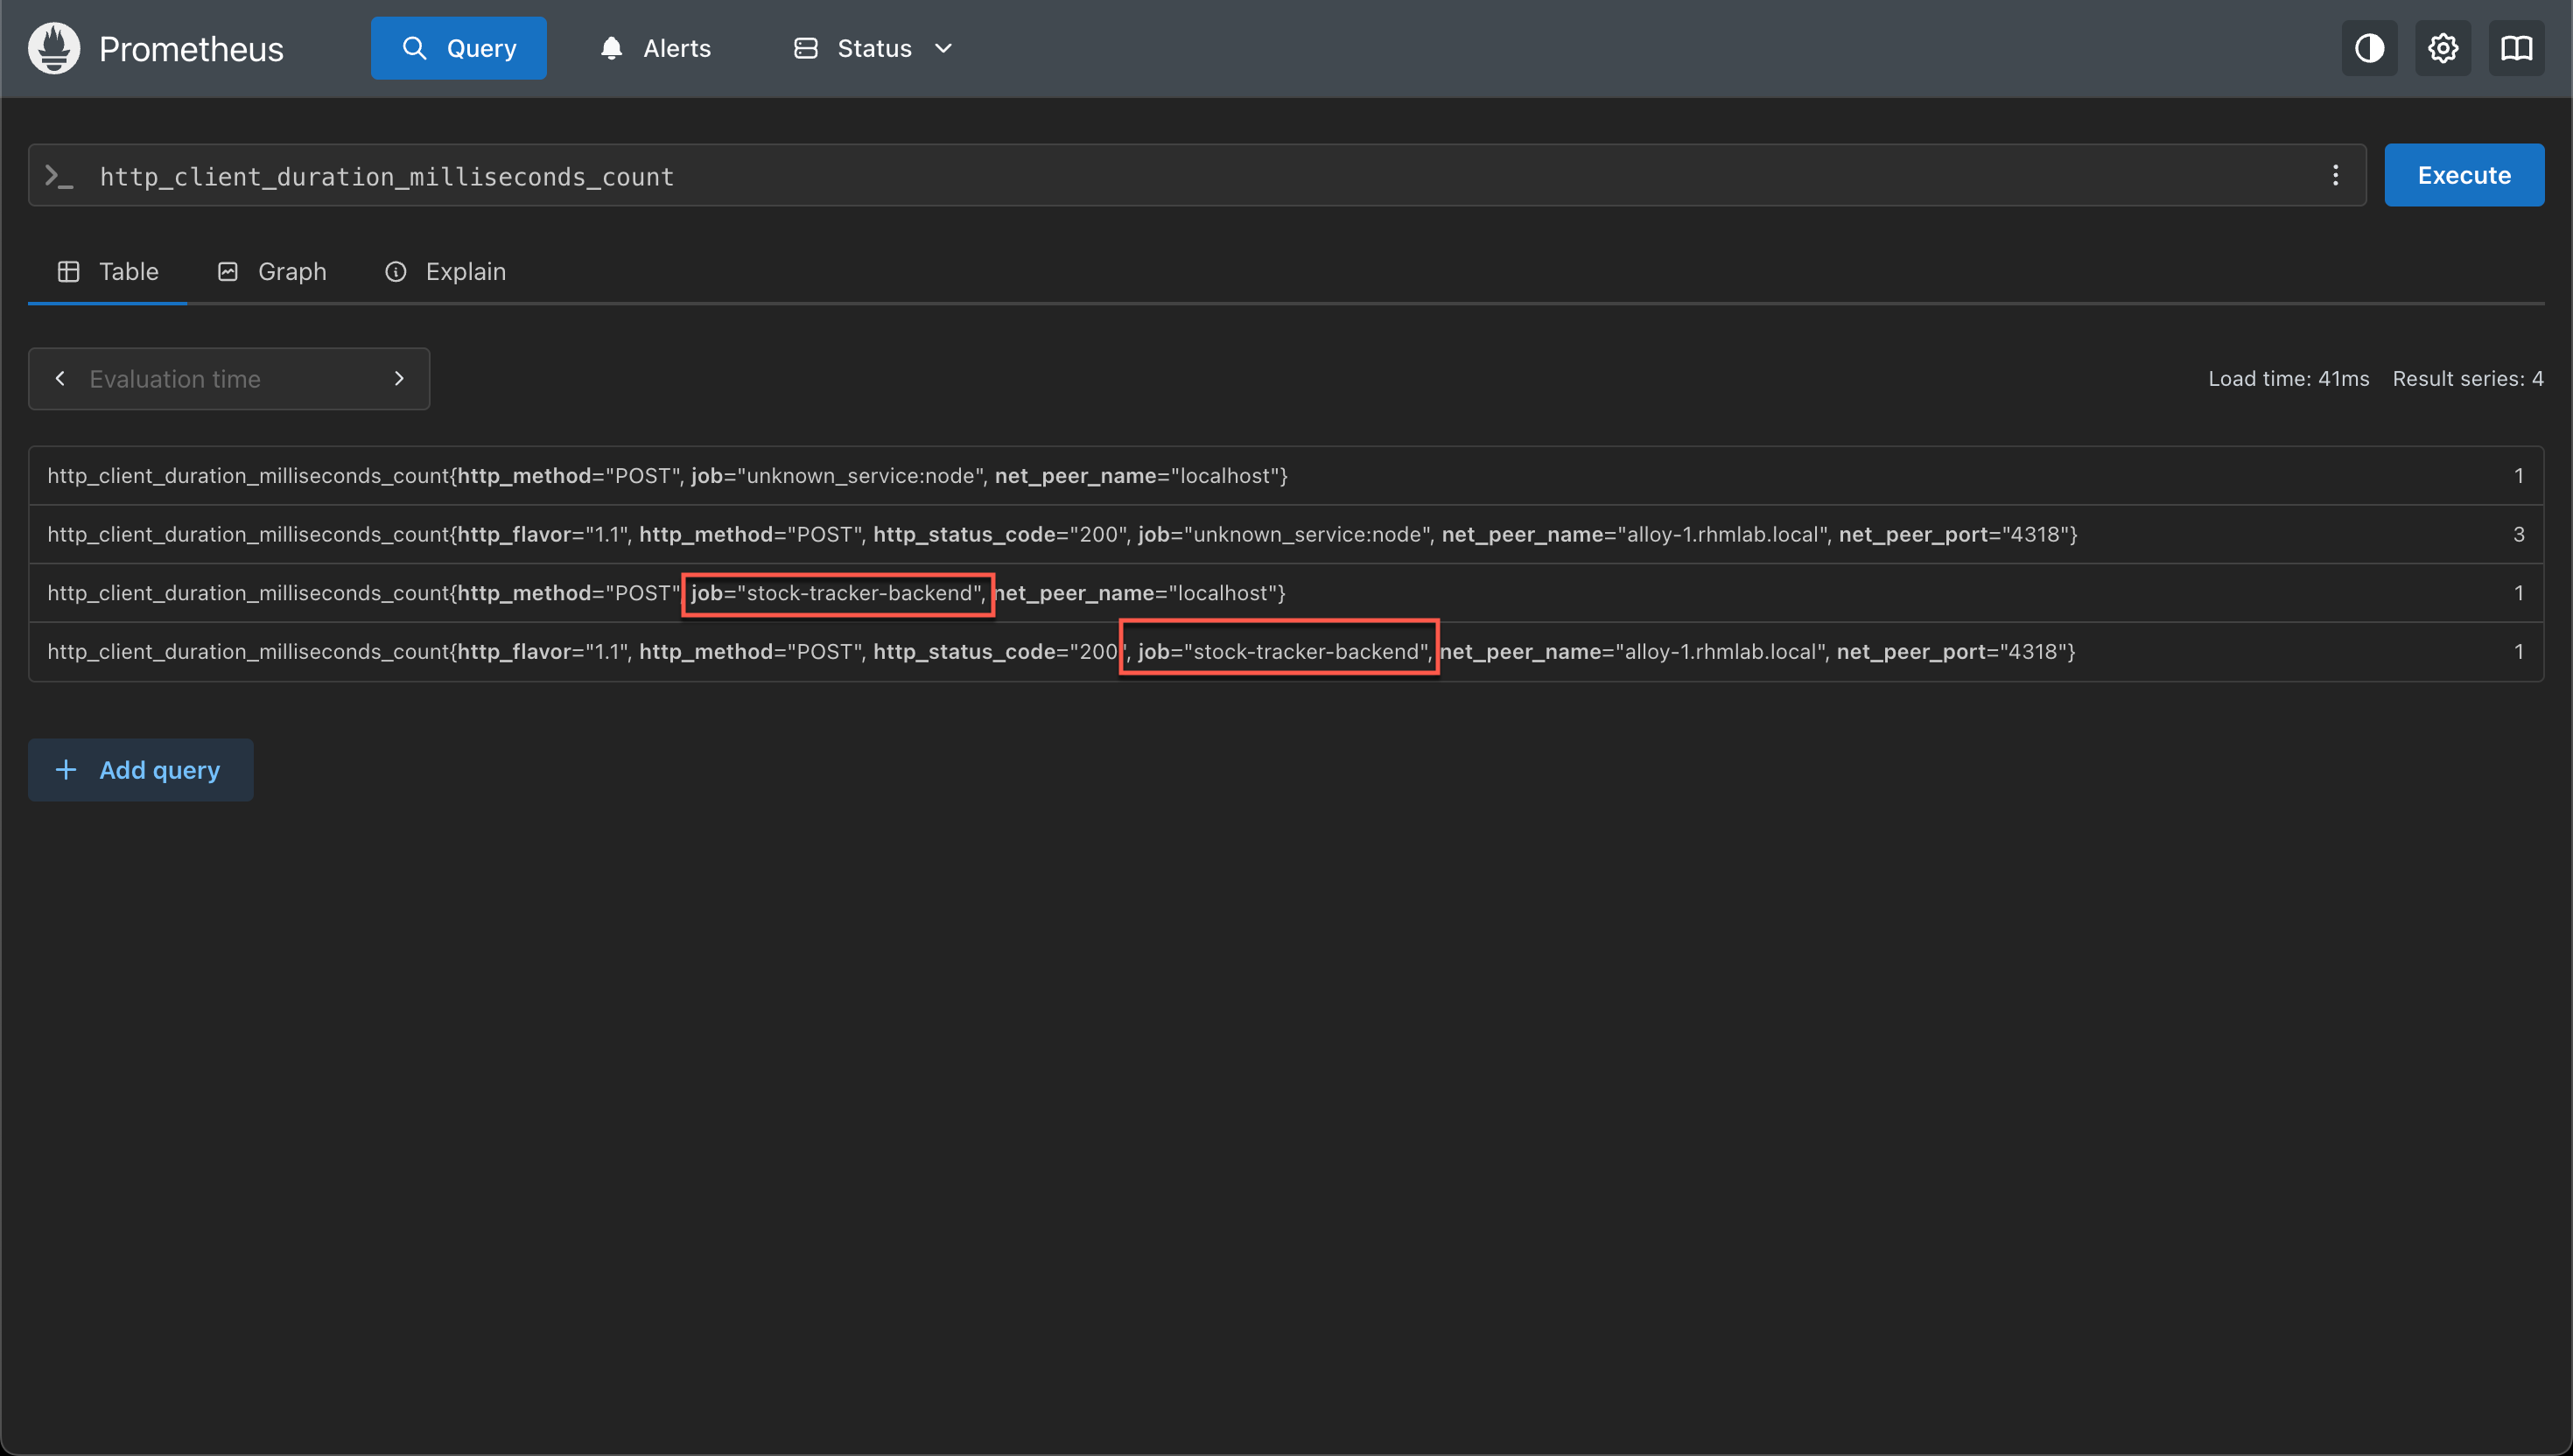
So, if we're adding the following env variable OTEL_RESOURCE_ATTRIBUTES=service.version=0.4.3,environment=production,service.namespace=stock-tracker and take another look at our metric we can see that the job name has changed
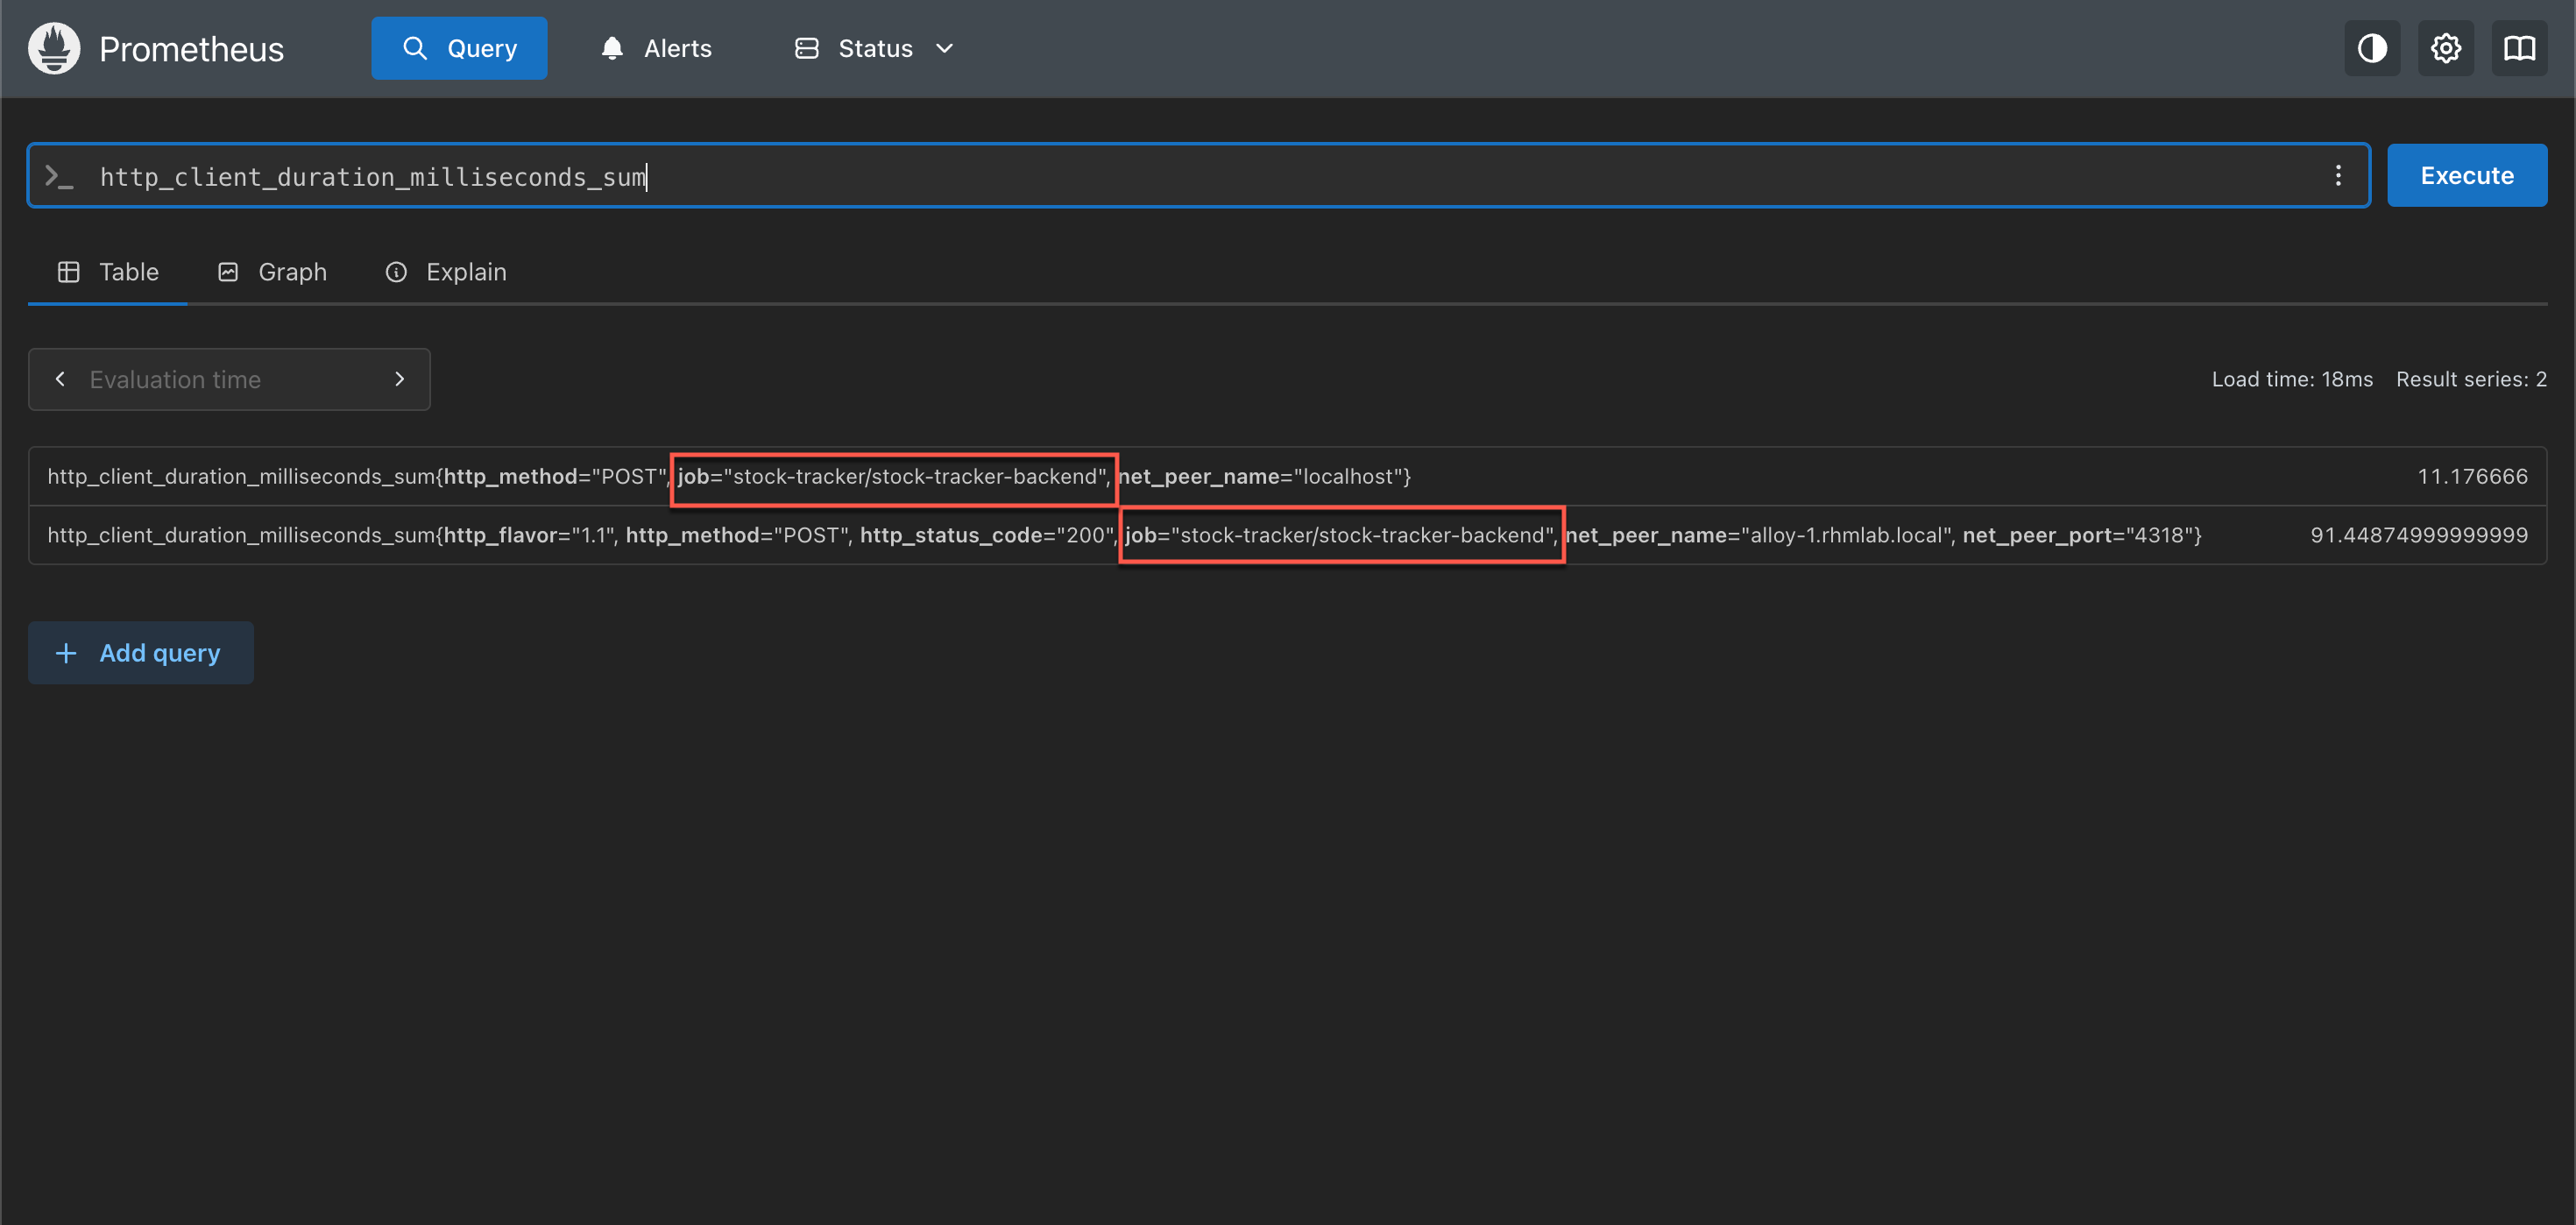
The service.namespace is now prefixing the service name. This let's us have a uniqueness in our job name even with multiple apps using the same service name, e.g we might have a service called frontend in several different apps.
We also have a metric target_info with more labels
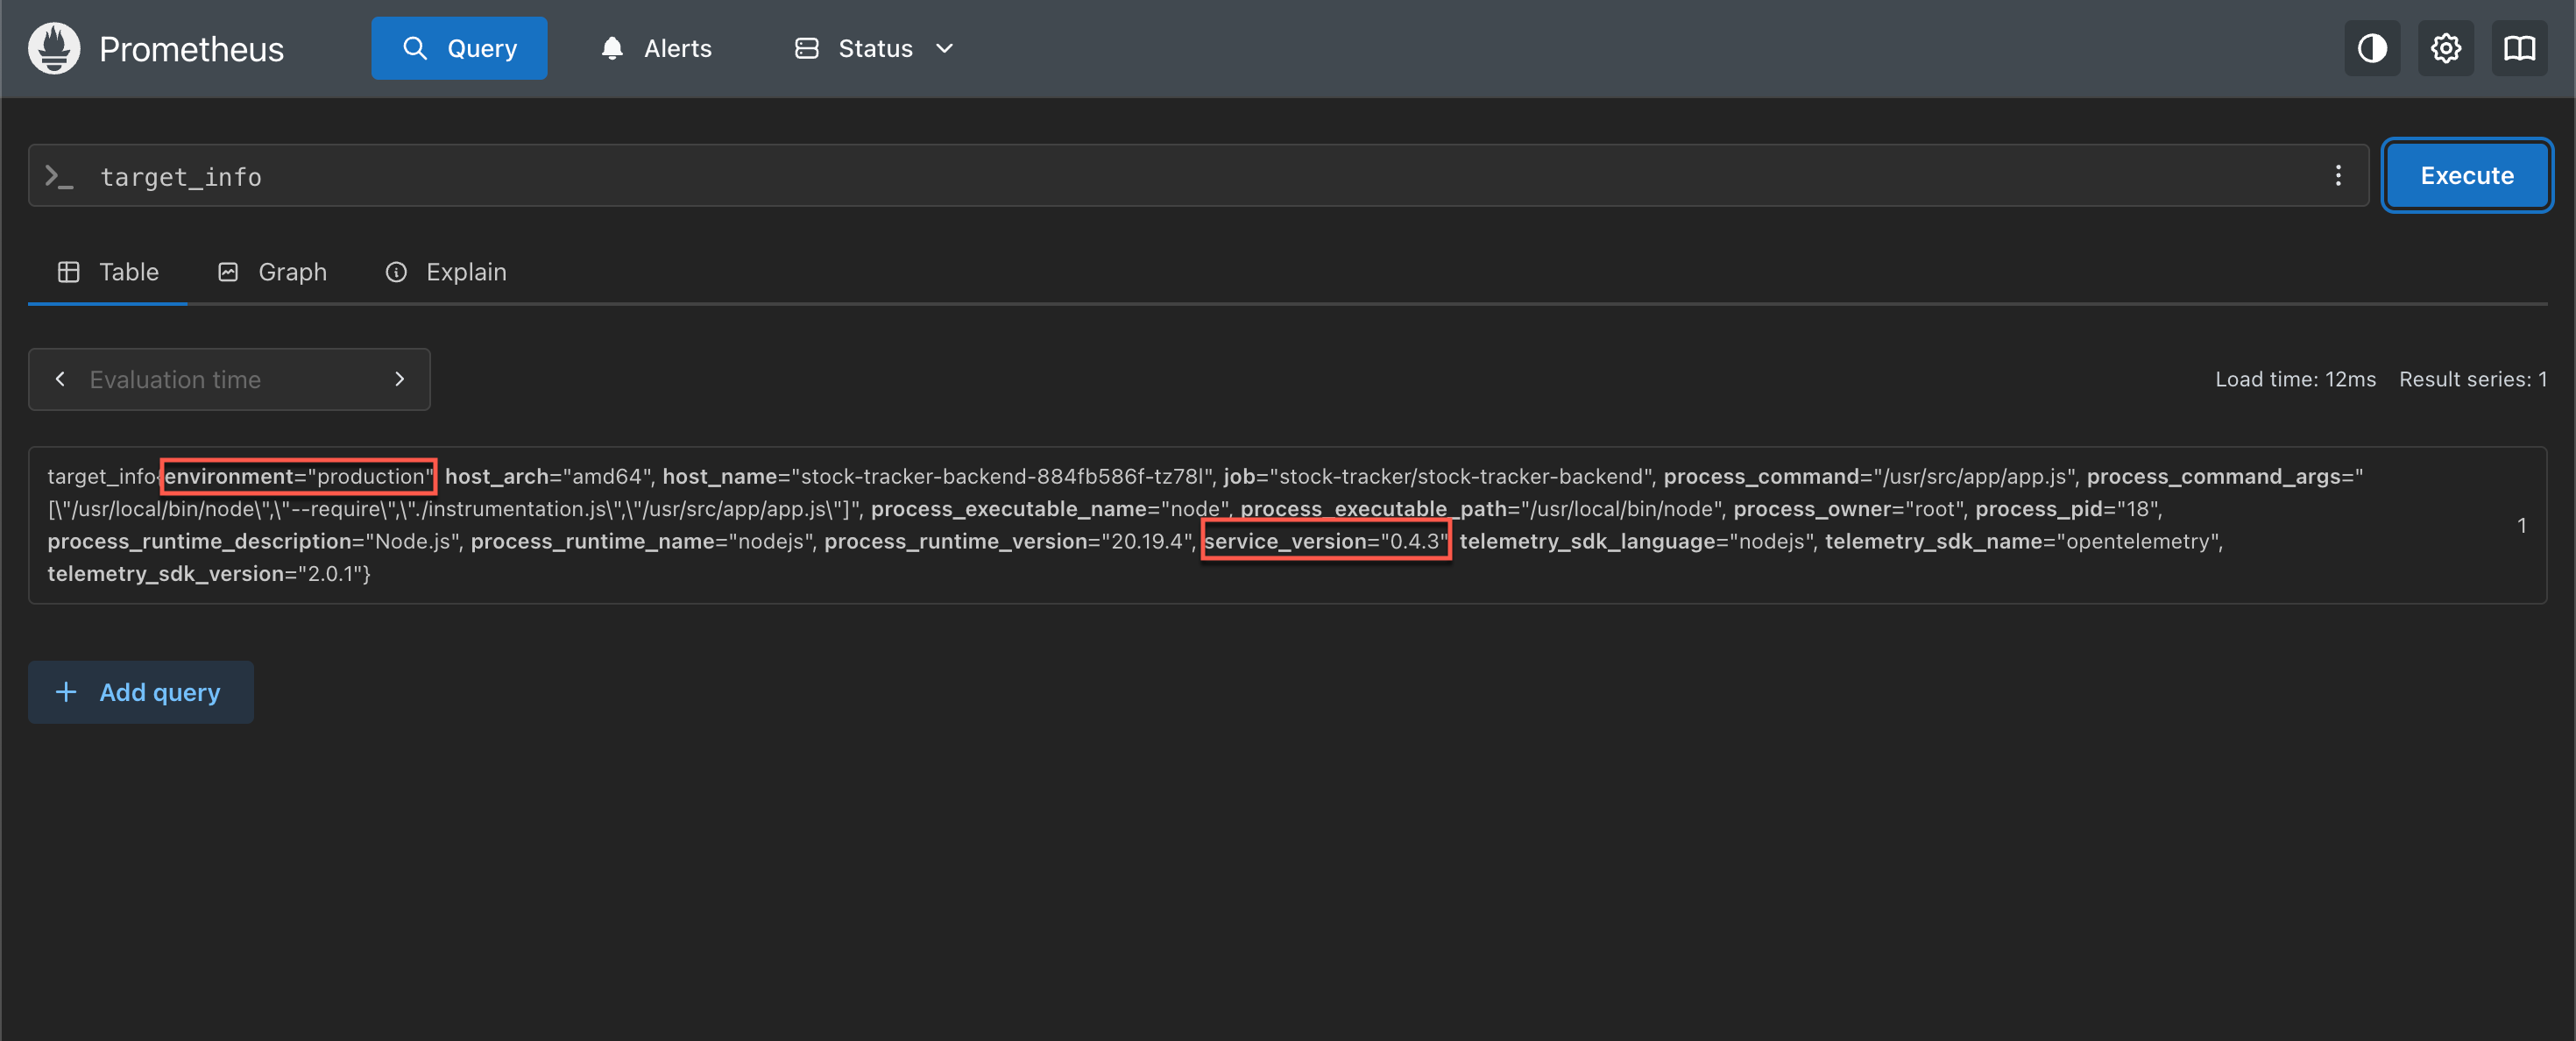
So this includes our attributes from the OTEL_RESOURCE_ATTRIBUTES as well as the defaults around the process mentioned before.
Note that with this setup the metrics will not have
service.nameandservice.namespace(or the other attributes) as labels. As far as I can understand this is per the OpenTelemetry specification. I found this issue where a change is requested. As for now one could do some processing / relabeling in the collector for adding those labels if wanted
Another option is to add the desired attributes in code, as described in the documentation
Note that attributes set through environment variables will take precedence over what's set in code.
Traces
So with metrics and resource metadata sorted, let's go ahead and add Traces from our app.
Collector config for Traces
Before we change our application to send these traces we'll modify our Alloy config to accept and forward those traces. We'll also instruct Tempo to create metrics from the traces.
 1otelcol.receiver.otlp "default" {
 2  http {}
 3
 4  output {
 5    metrics = [otelcol.exporter.prometheus.default.input]
 6    traces = [otelcol.exporter.otlp.tempo.input]
 7  }
 8}
 9
10otelcol.exporter.otlp "tempo" {
11  client {
12    endpoint = "<TEMPO_ENDPOINT>"
13    tls {
14      insecure = true
15      insecure_skip_verify = true
16    }
17  }
18}
So we've added traces to the receiver output and instructed it to forward to the otelcol.exporter.tempo.input component. Note that as we mentioned previously we could (and in production, should) have done some processing of the data before exporting it, but that's a topic for a later post. Now we're forwarding it to our otlp exporter named tempo. Tempo here is just a name and it could've been named anything.
After reloading the Alloy config we can verify in the UI that we have a new component
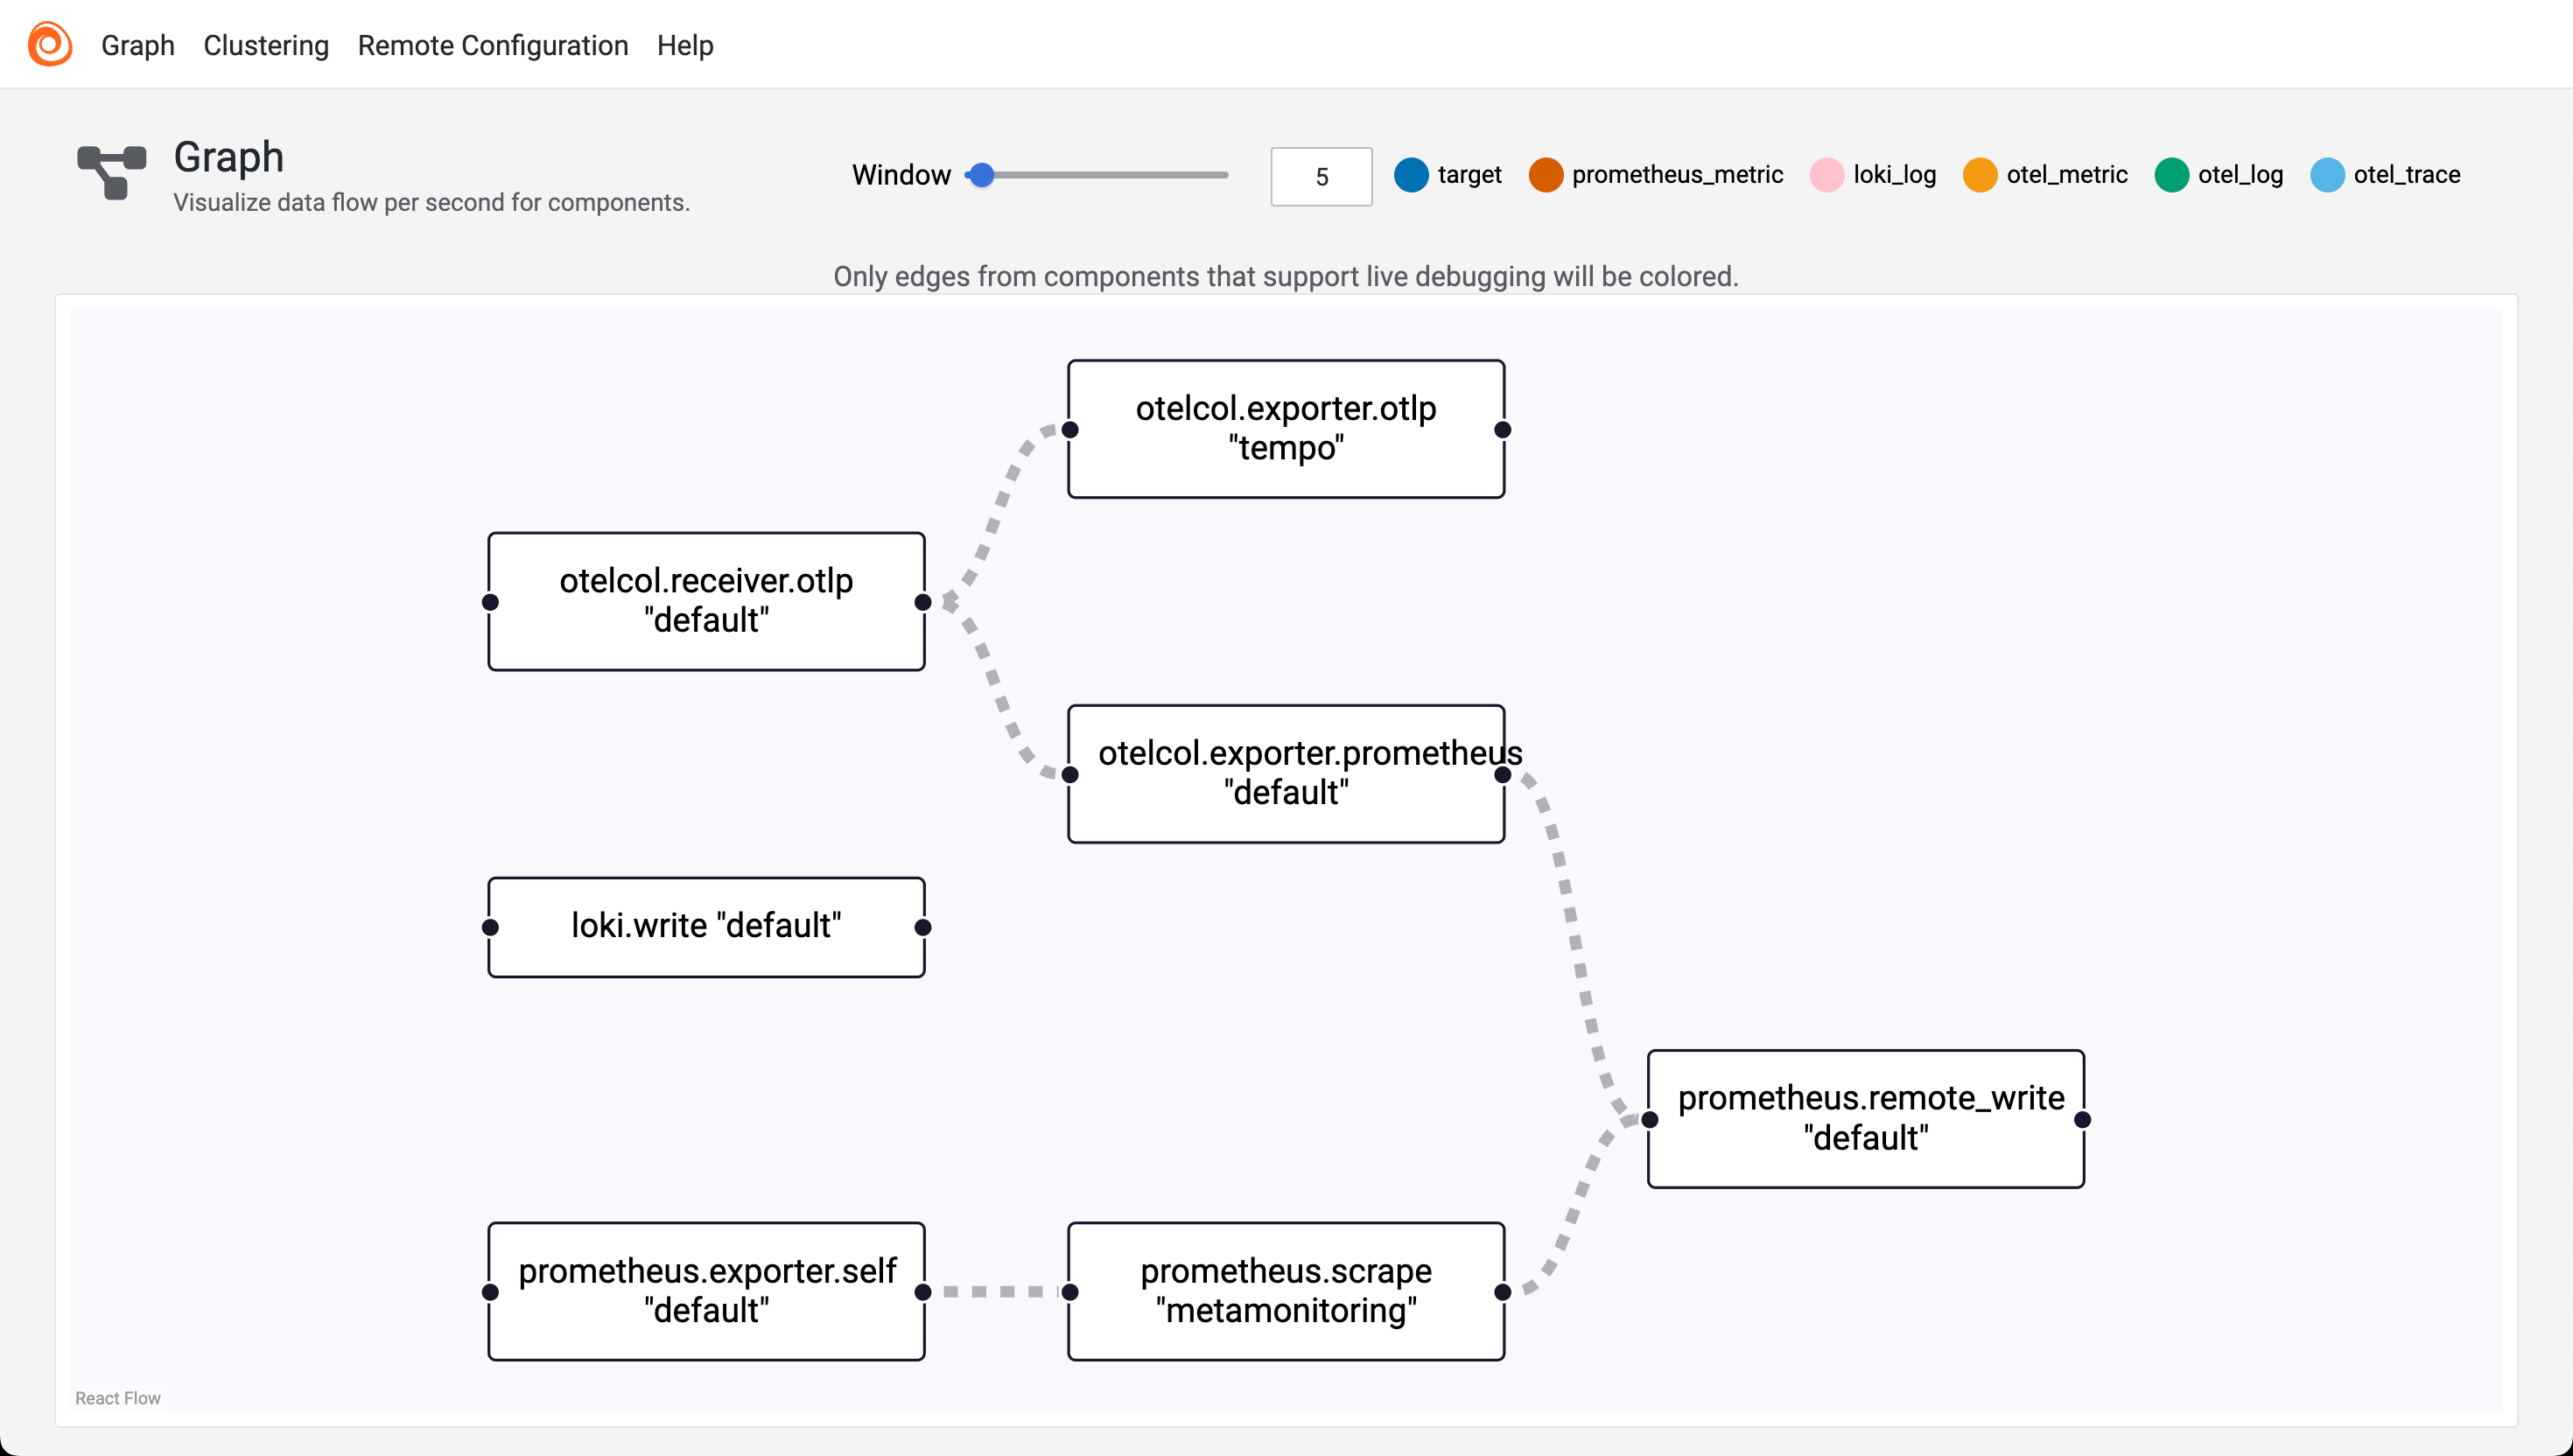
At this point there's no traces sent from our app so no data would be present in Tempo yet.
Instrument traces from app
In our instrumentation config in our app we'll add a traceExporter and point it to our Alloy collector
 1const {
 2    OTLPTraceExporter,
 3  } = require('@opentelemetry/exporter-trace-otlp-proto');
 4const sdk = new NodeSDK({
 5  traceExporter: new OTLPTraceExporter({
 6    url: process.env.OTLP_TRACE_EXPORTER_URL || 'http://localhost:4318/v1/traces', // Default to localhost if env variable is not set
 7    headers: {
 8      'Content-Type': 'application/x-protobuf',
 9    },
10  }),
11  metricReader: new PeriodicExportingMetricReader({
12    exporter: new OTLPMetricExporter({
13      url: process.env.OTLP_METRIC_EXPORTER_URL || 'http://localhost:4318/v1/metrics', // Default to localhost if env variable is not set
14      headers: {
15        'Content-Type': 'application/x-protobuf',
16      },
17    }),
18  }),
19  instrumentations: [getNodeAutoInstrumentations()],
20});
We'll have to add a new environment variable for our trace exporter OTLP_TRACE_EXPORTER_URL
If everything is working we should get traces ingested to our Tempo backend via our Alloy collector and the OpenTelemetry autoinstrumentation. Let's head over to Grafana to check it out
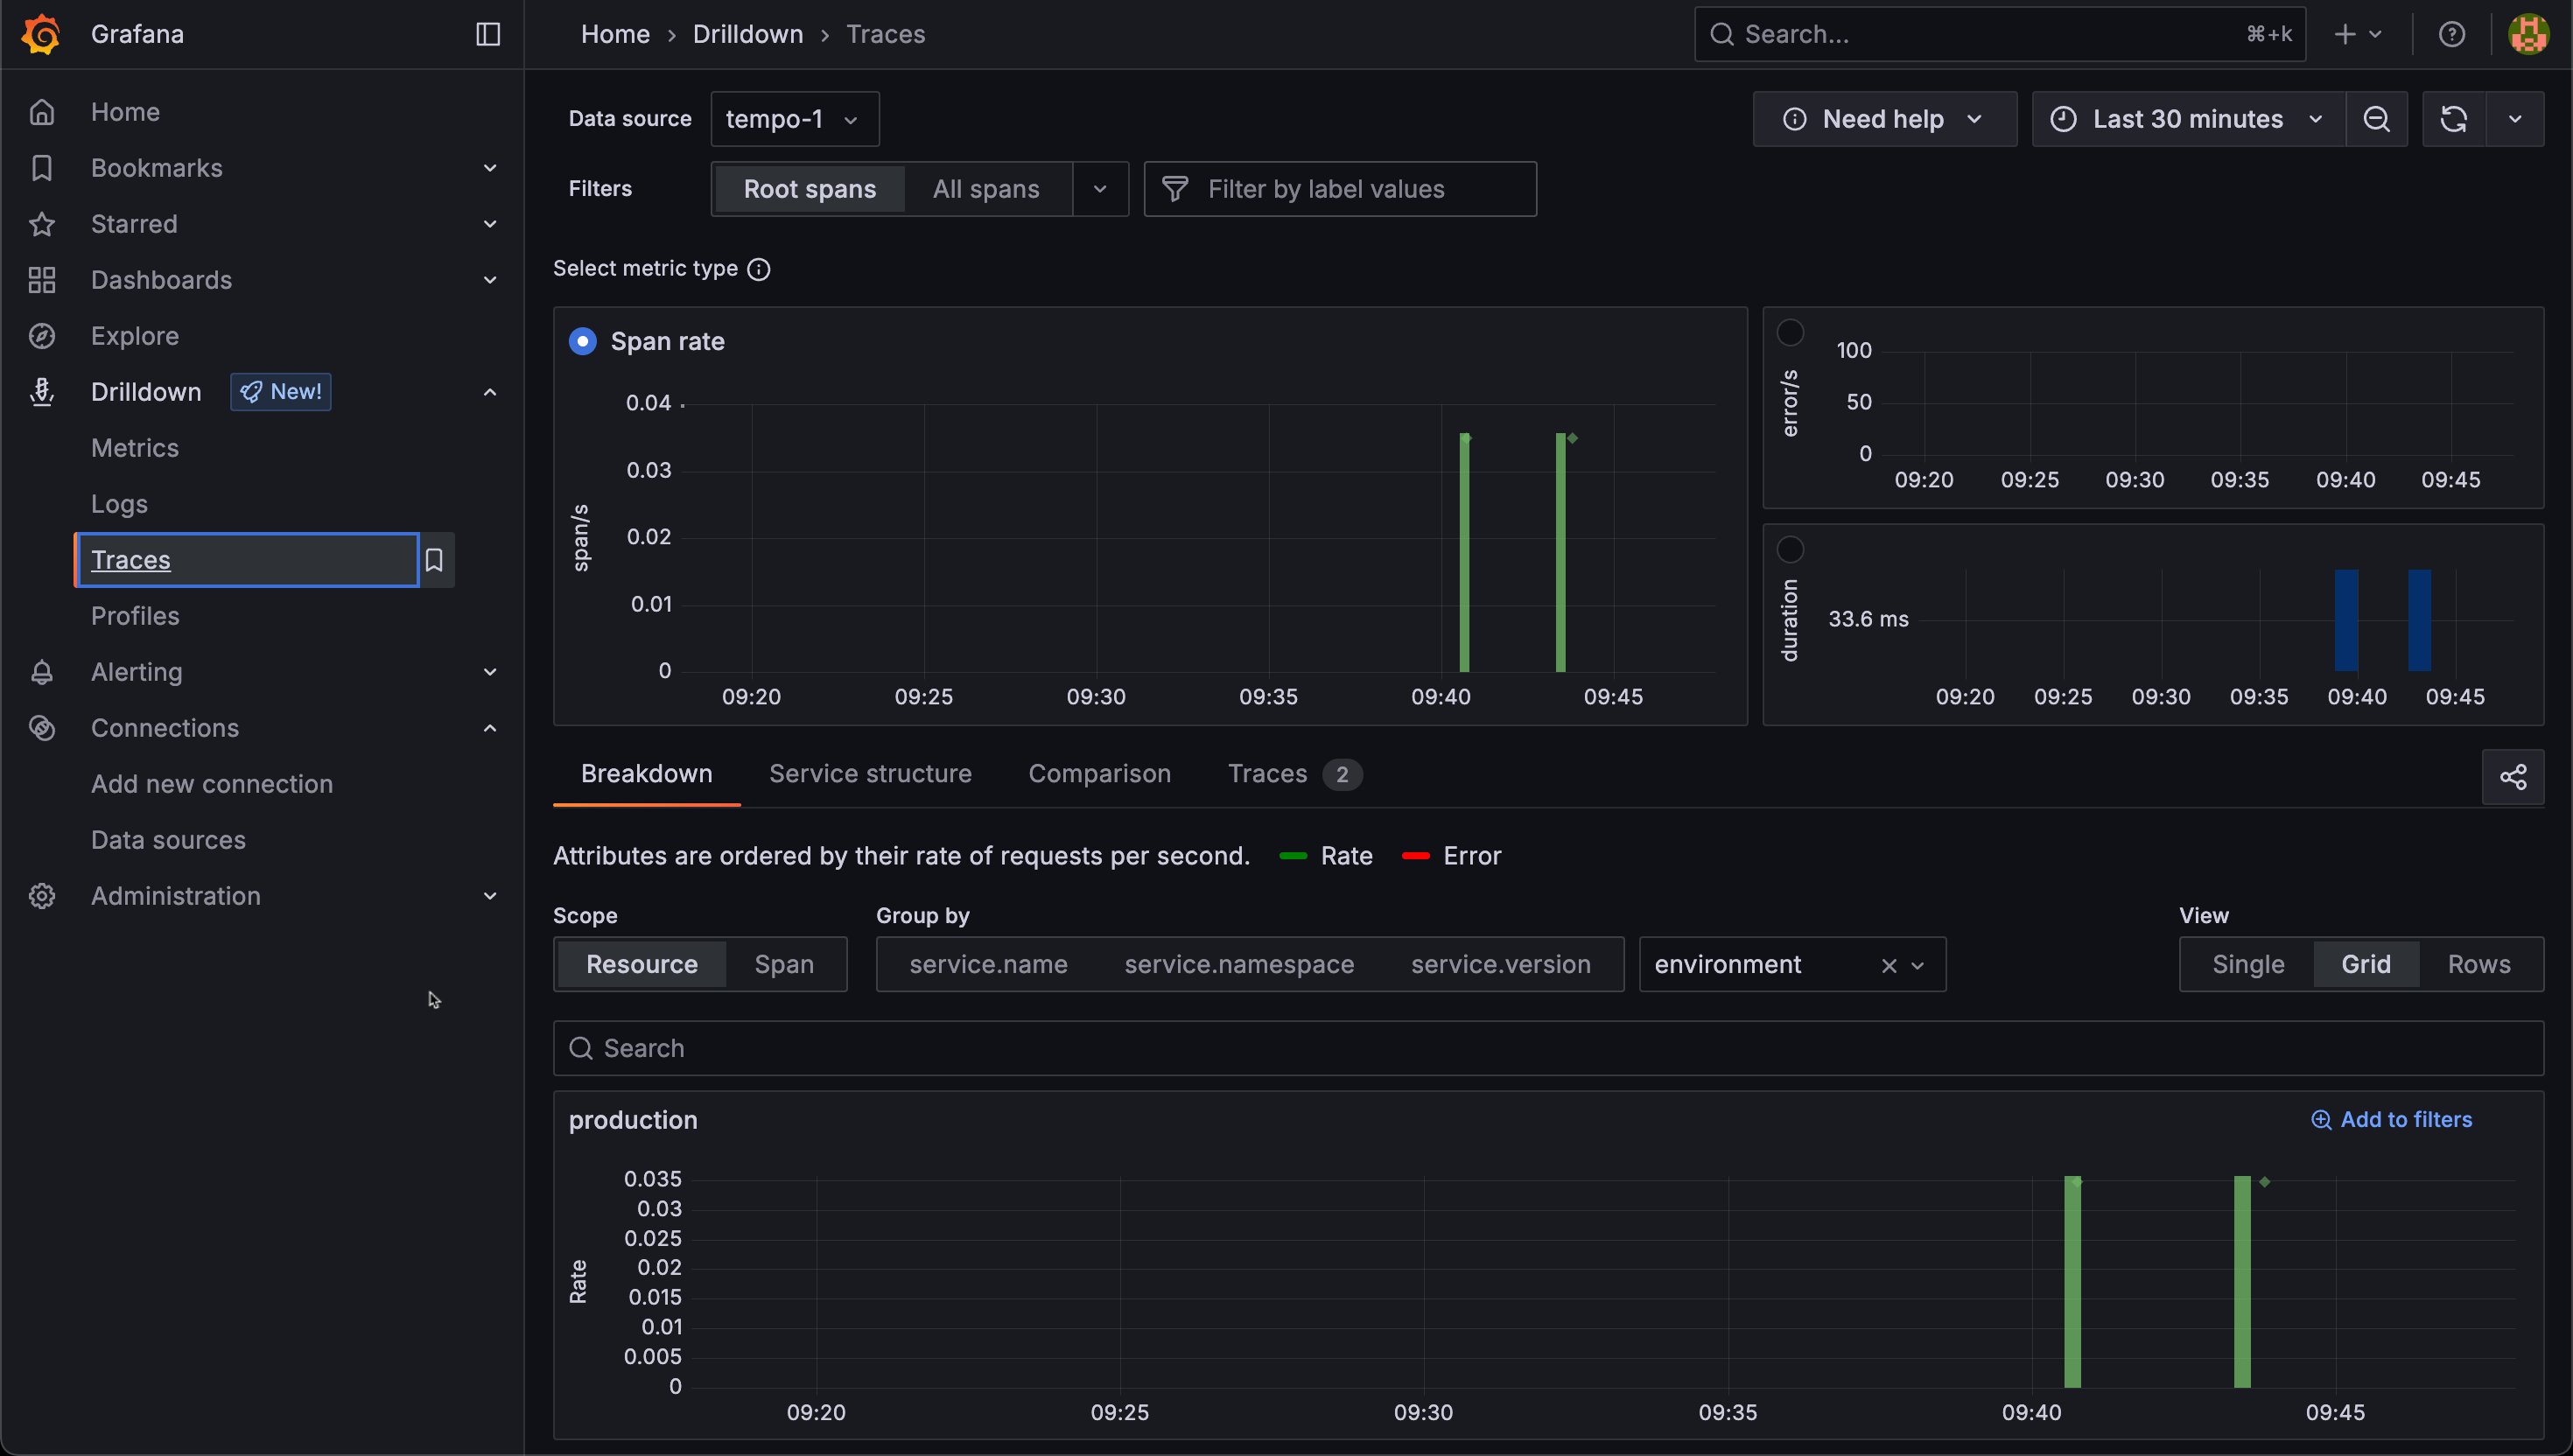
Visualizing traces in Grafana
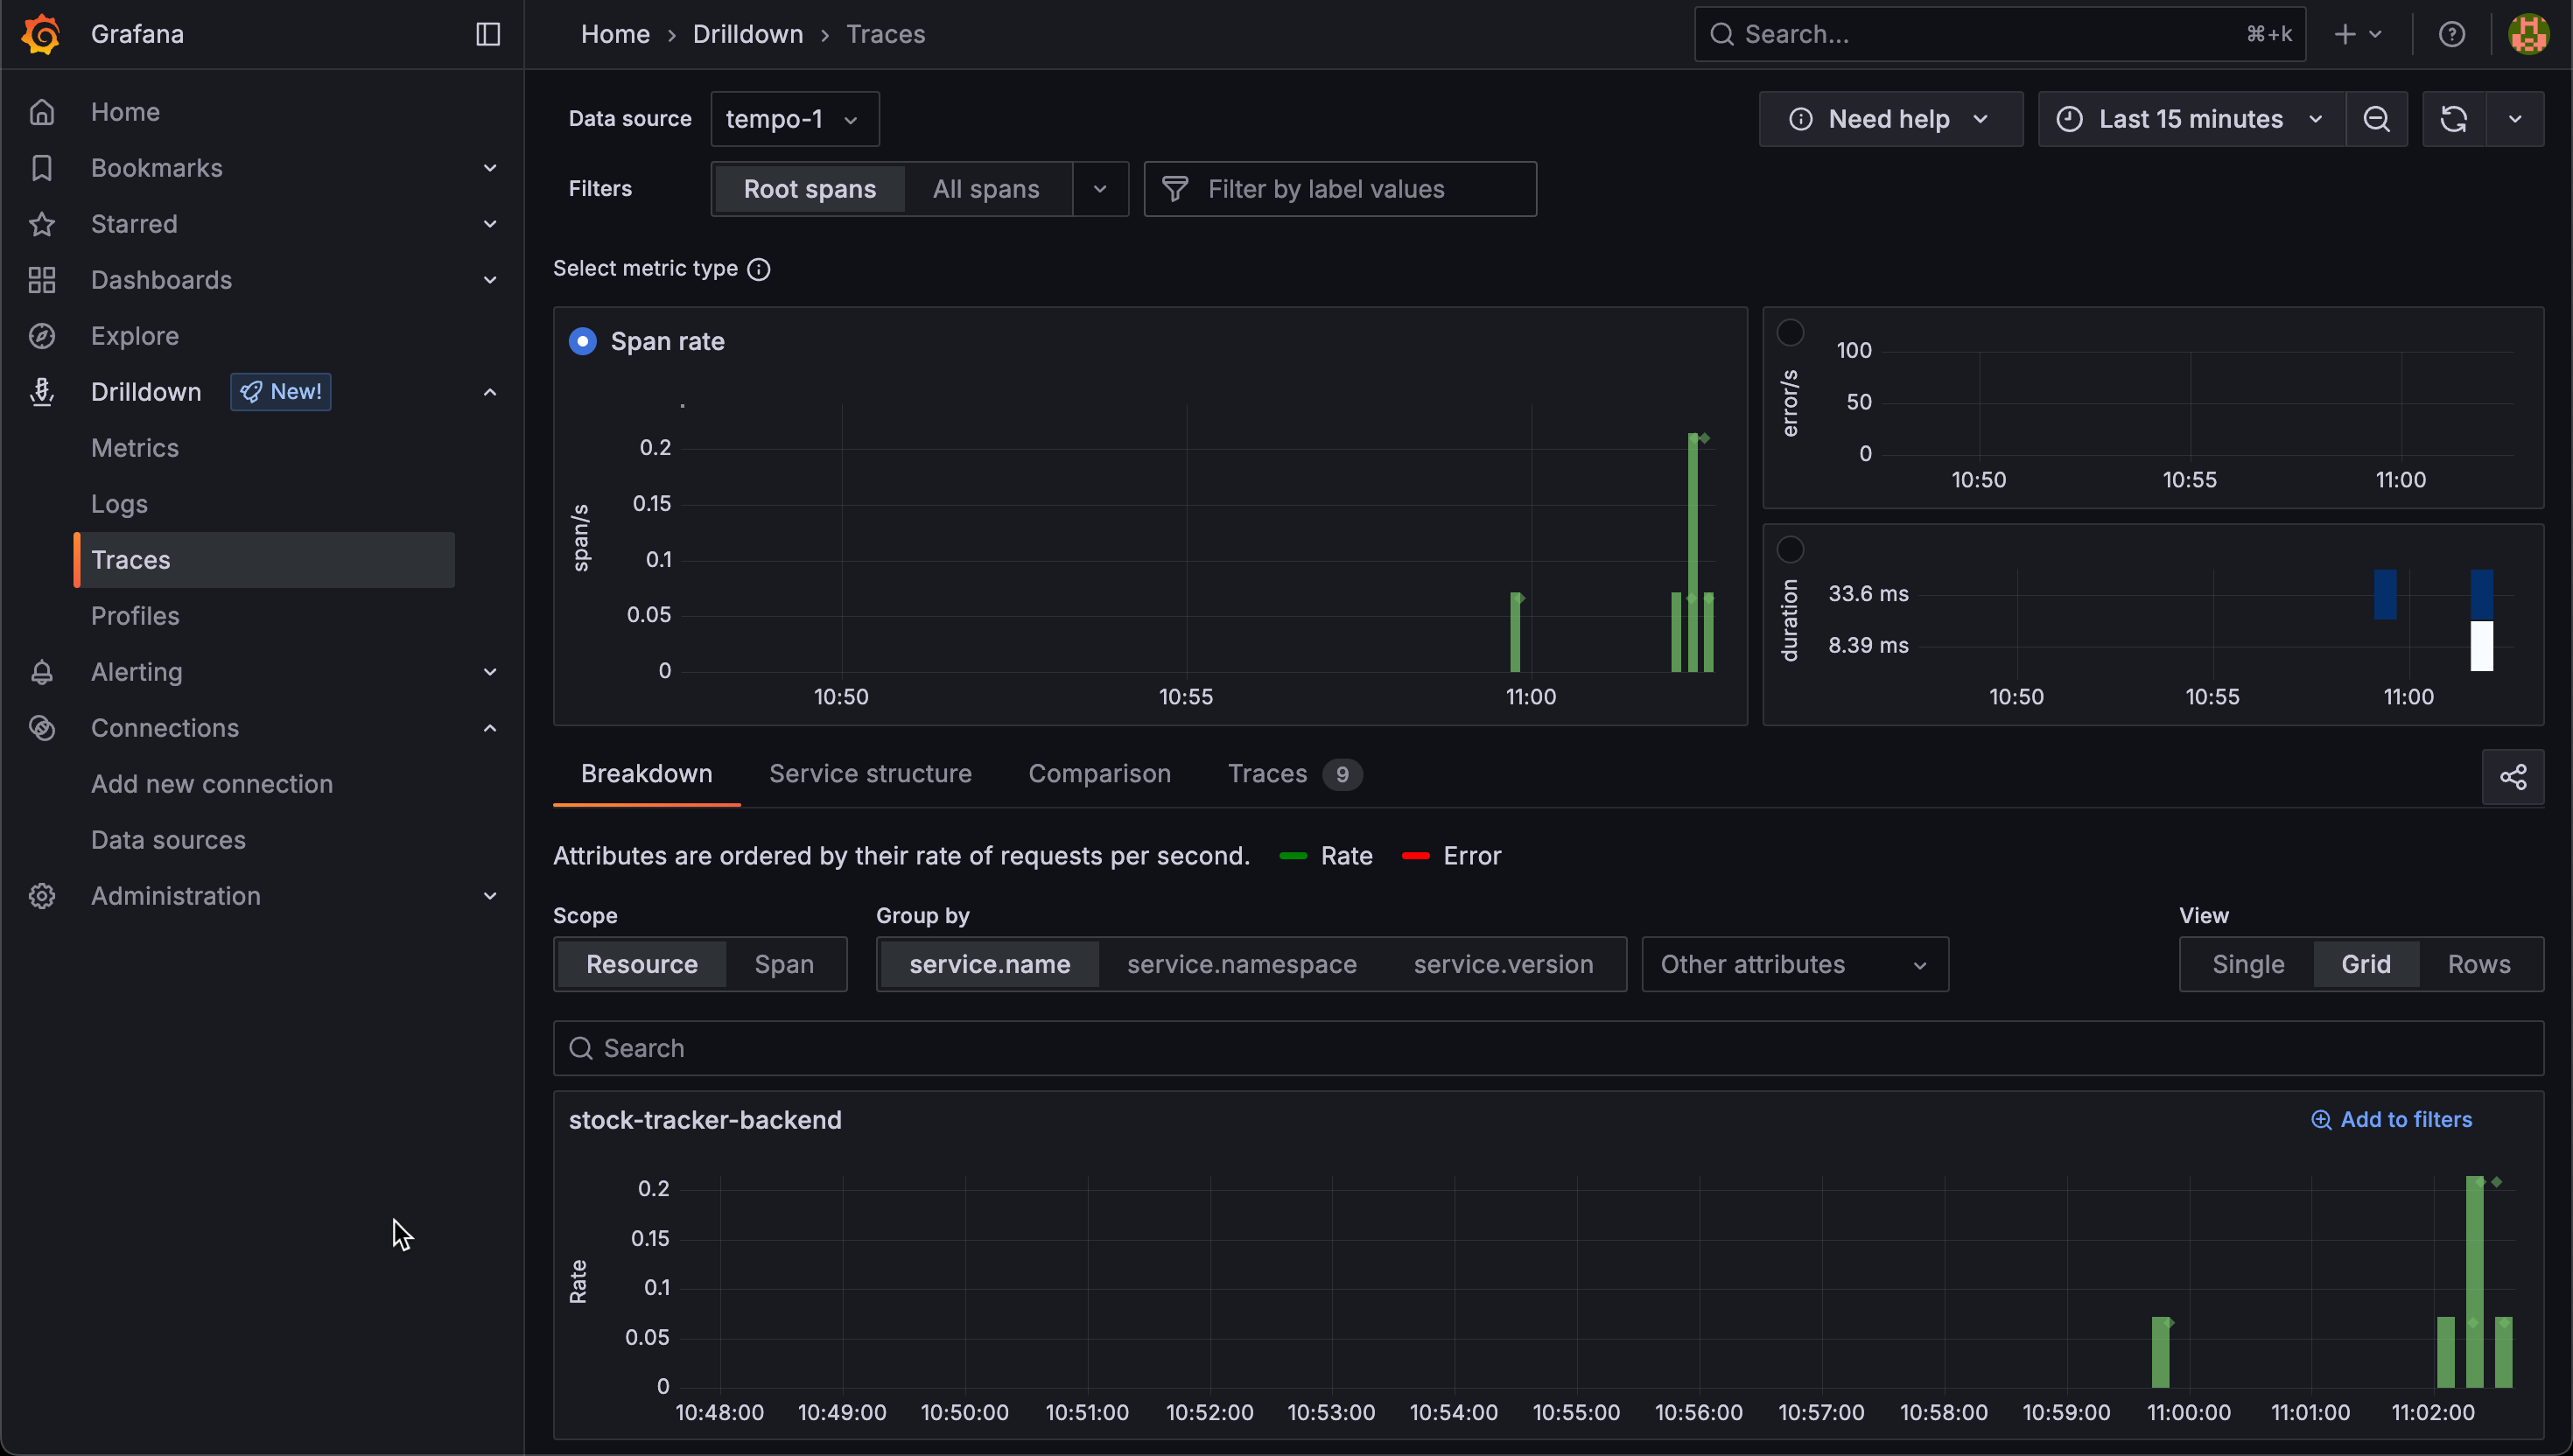
Our Grafana Drilldown feature is a fantastic resource when checking out our traces.
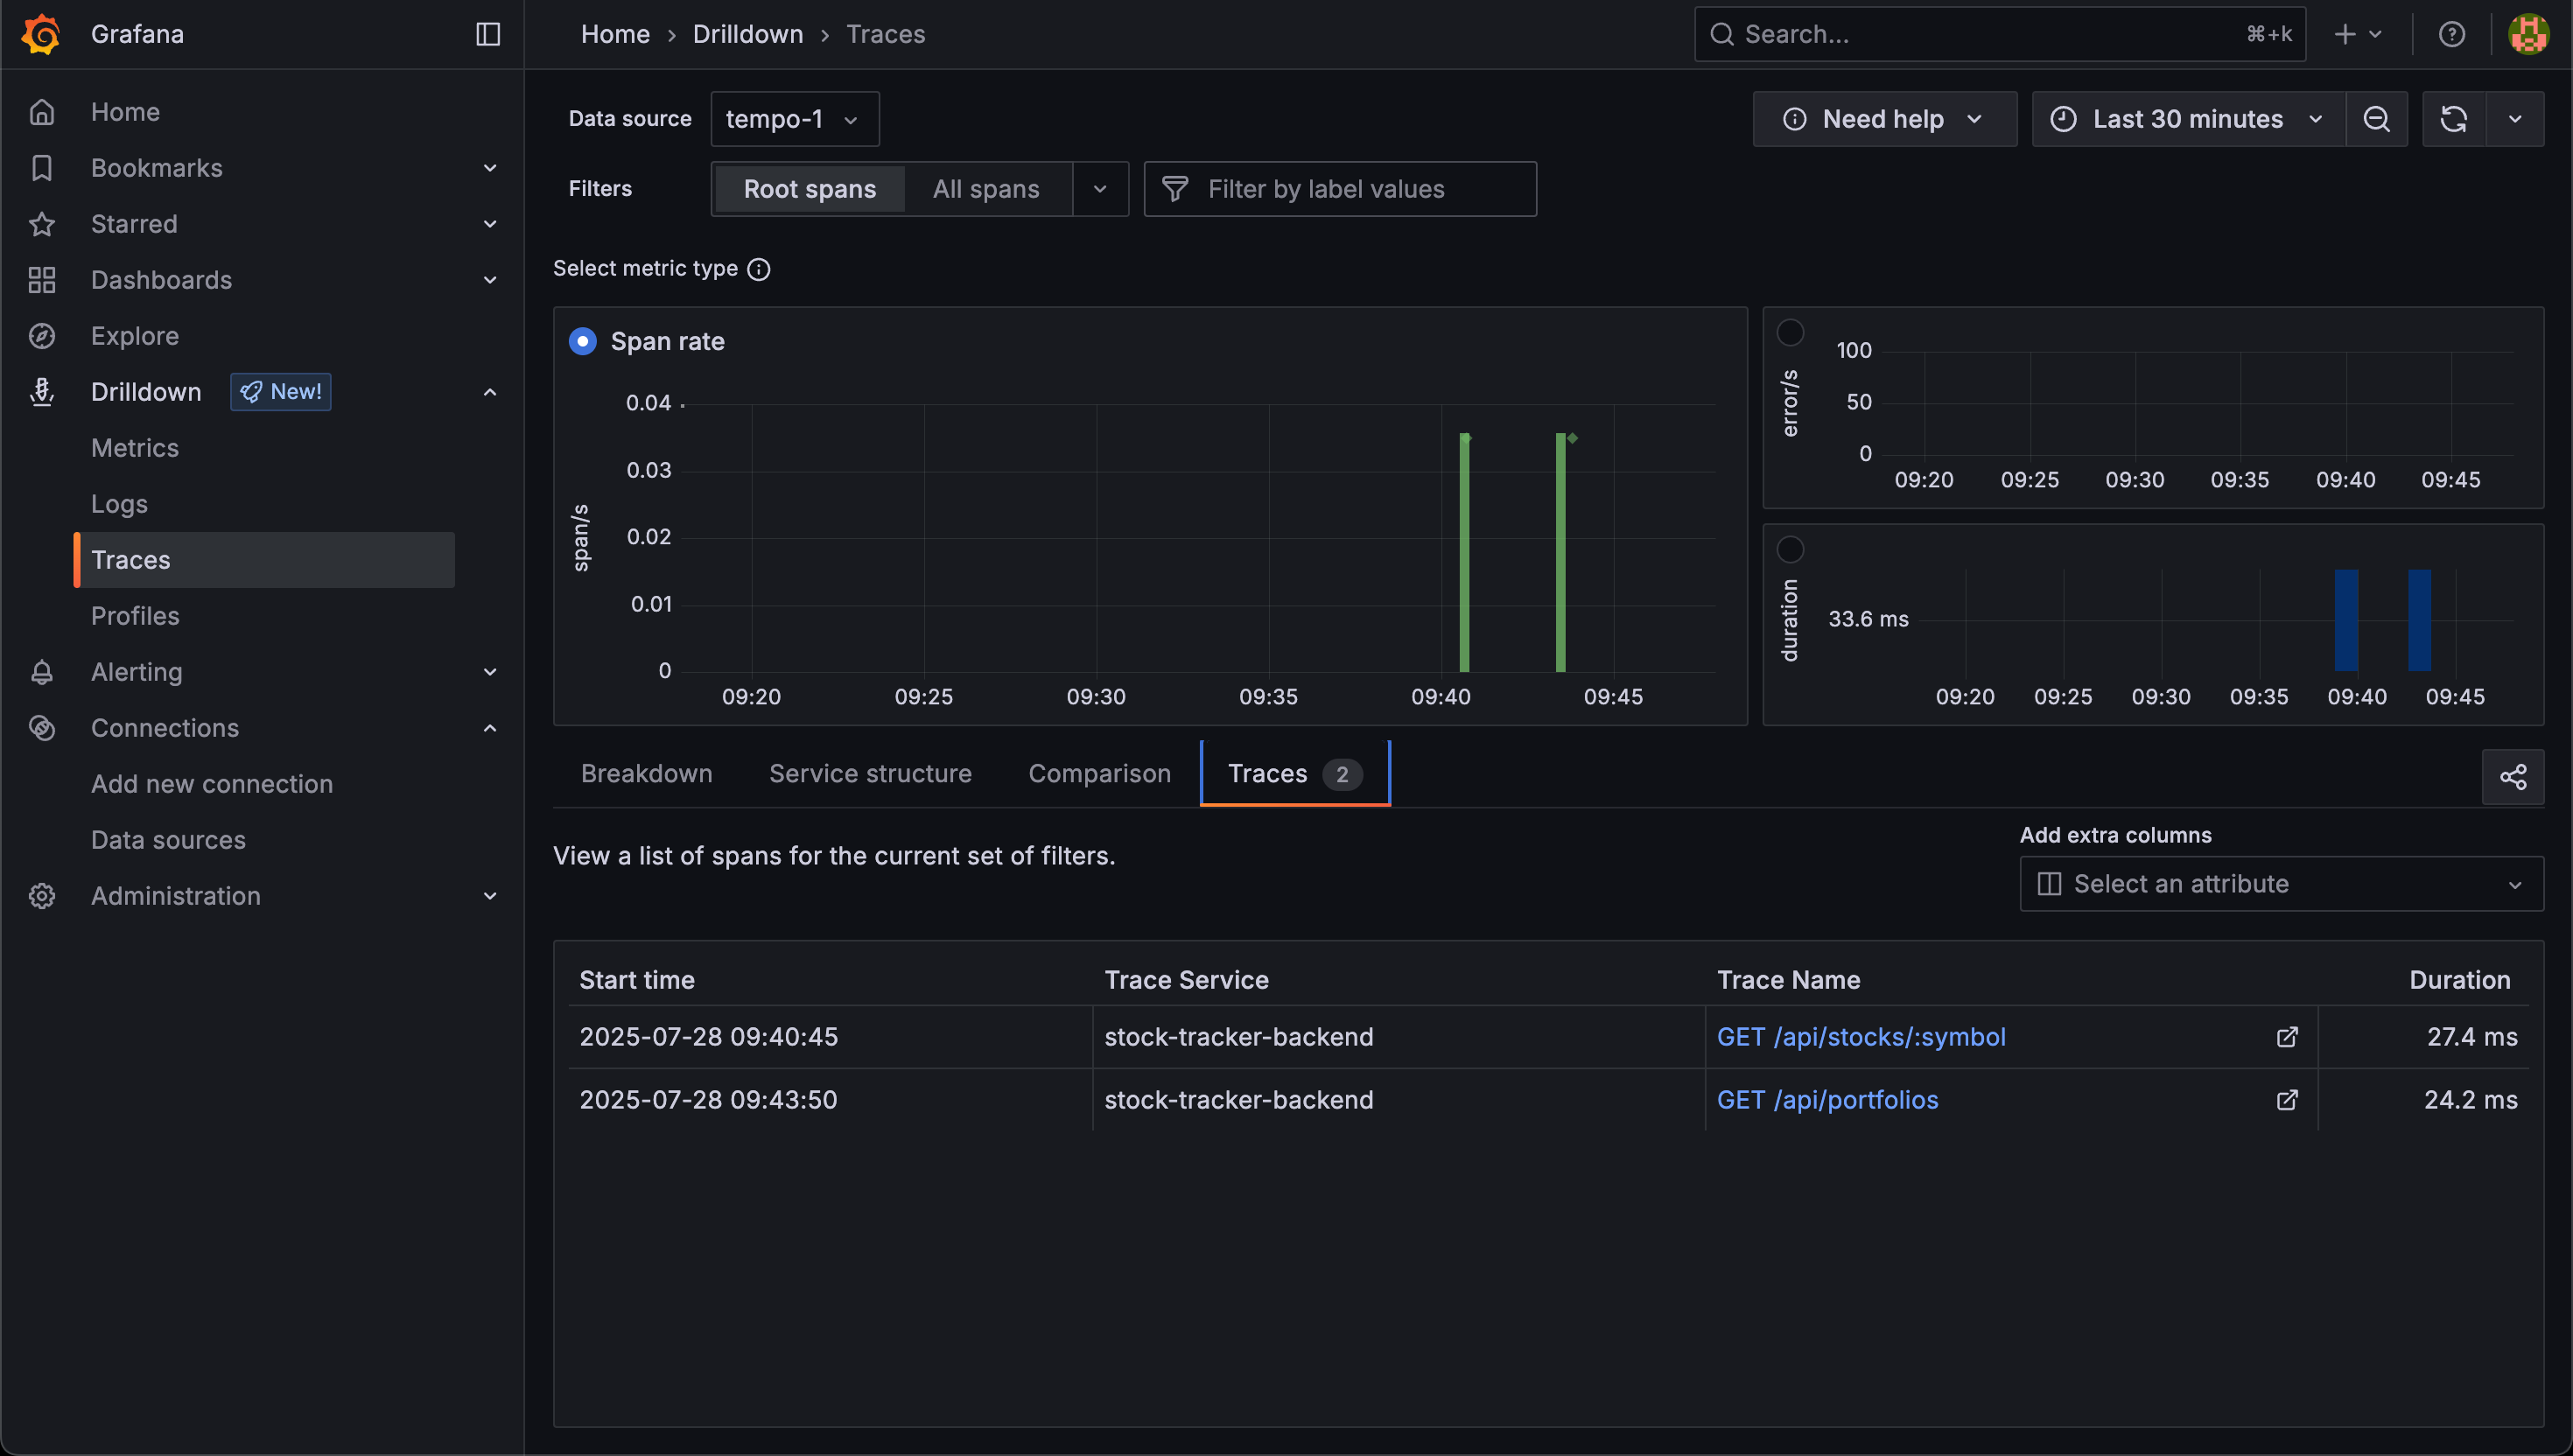
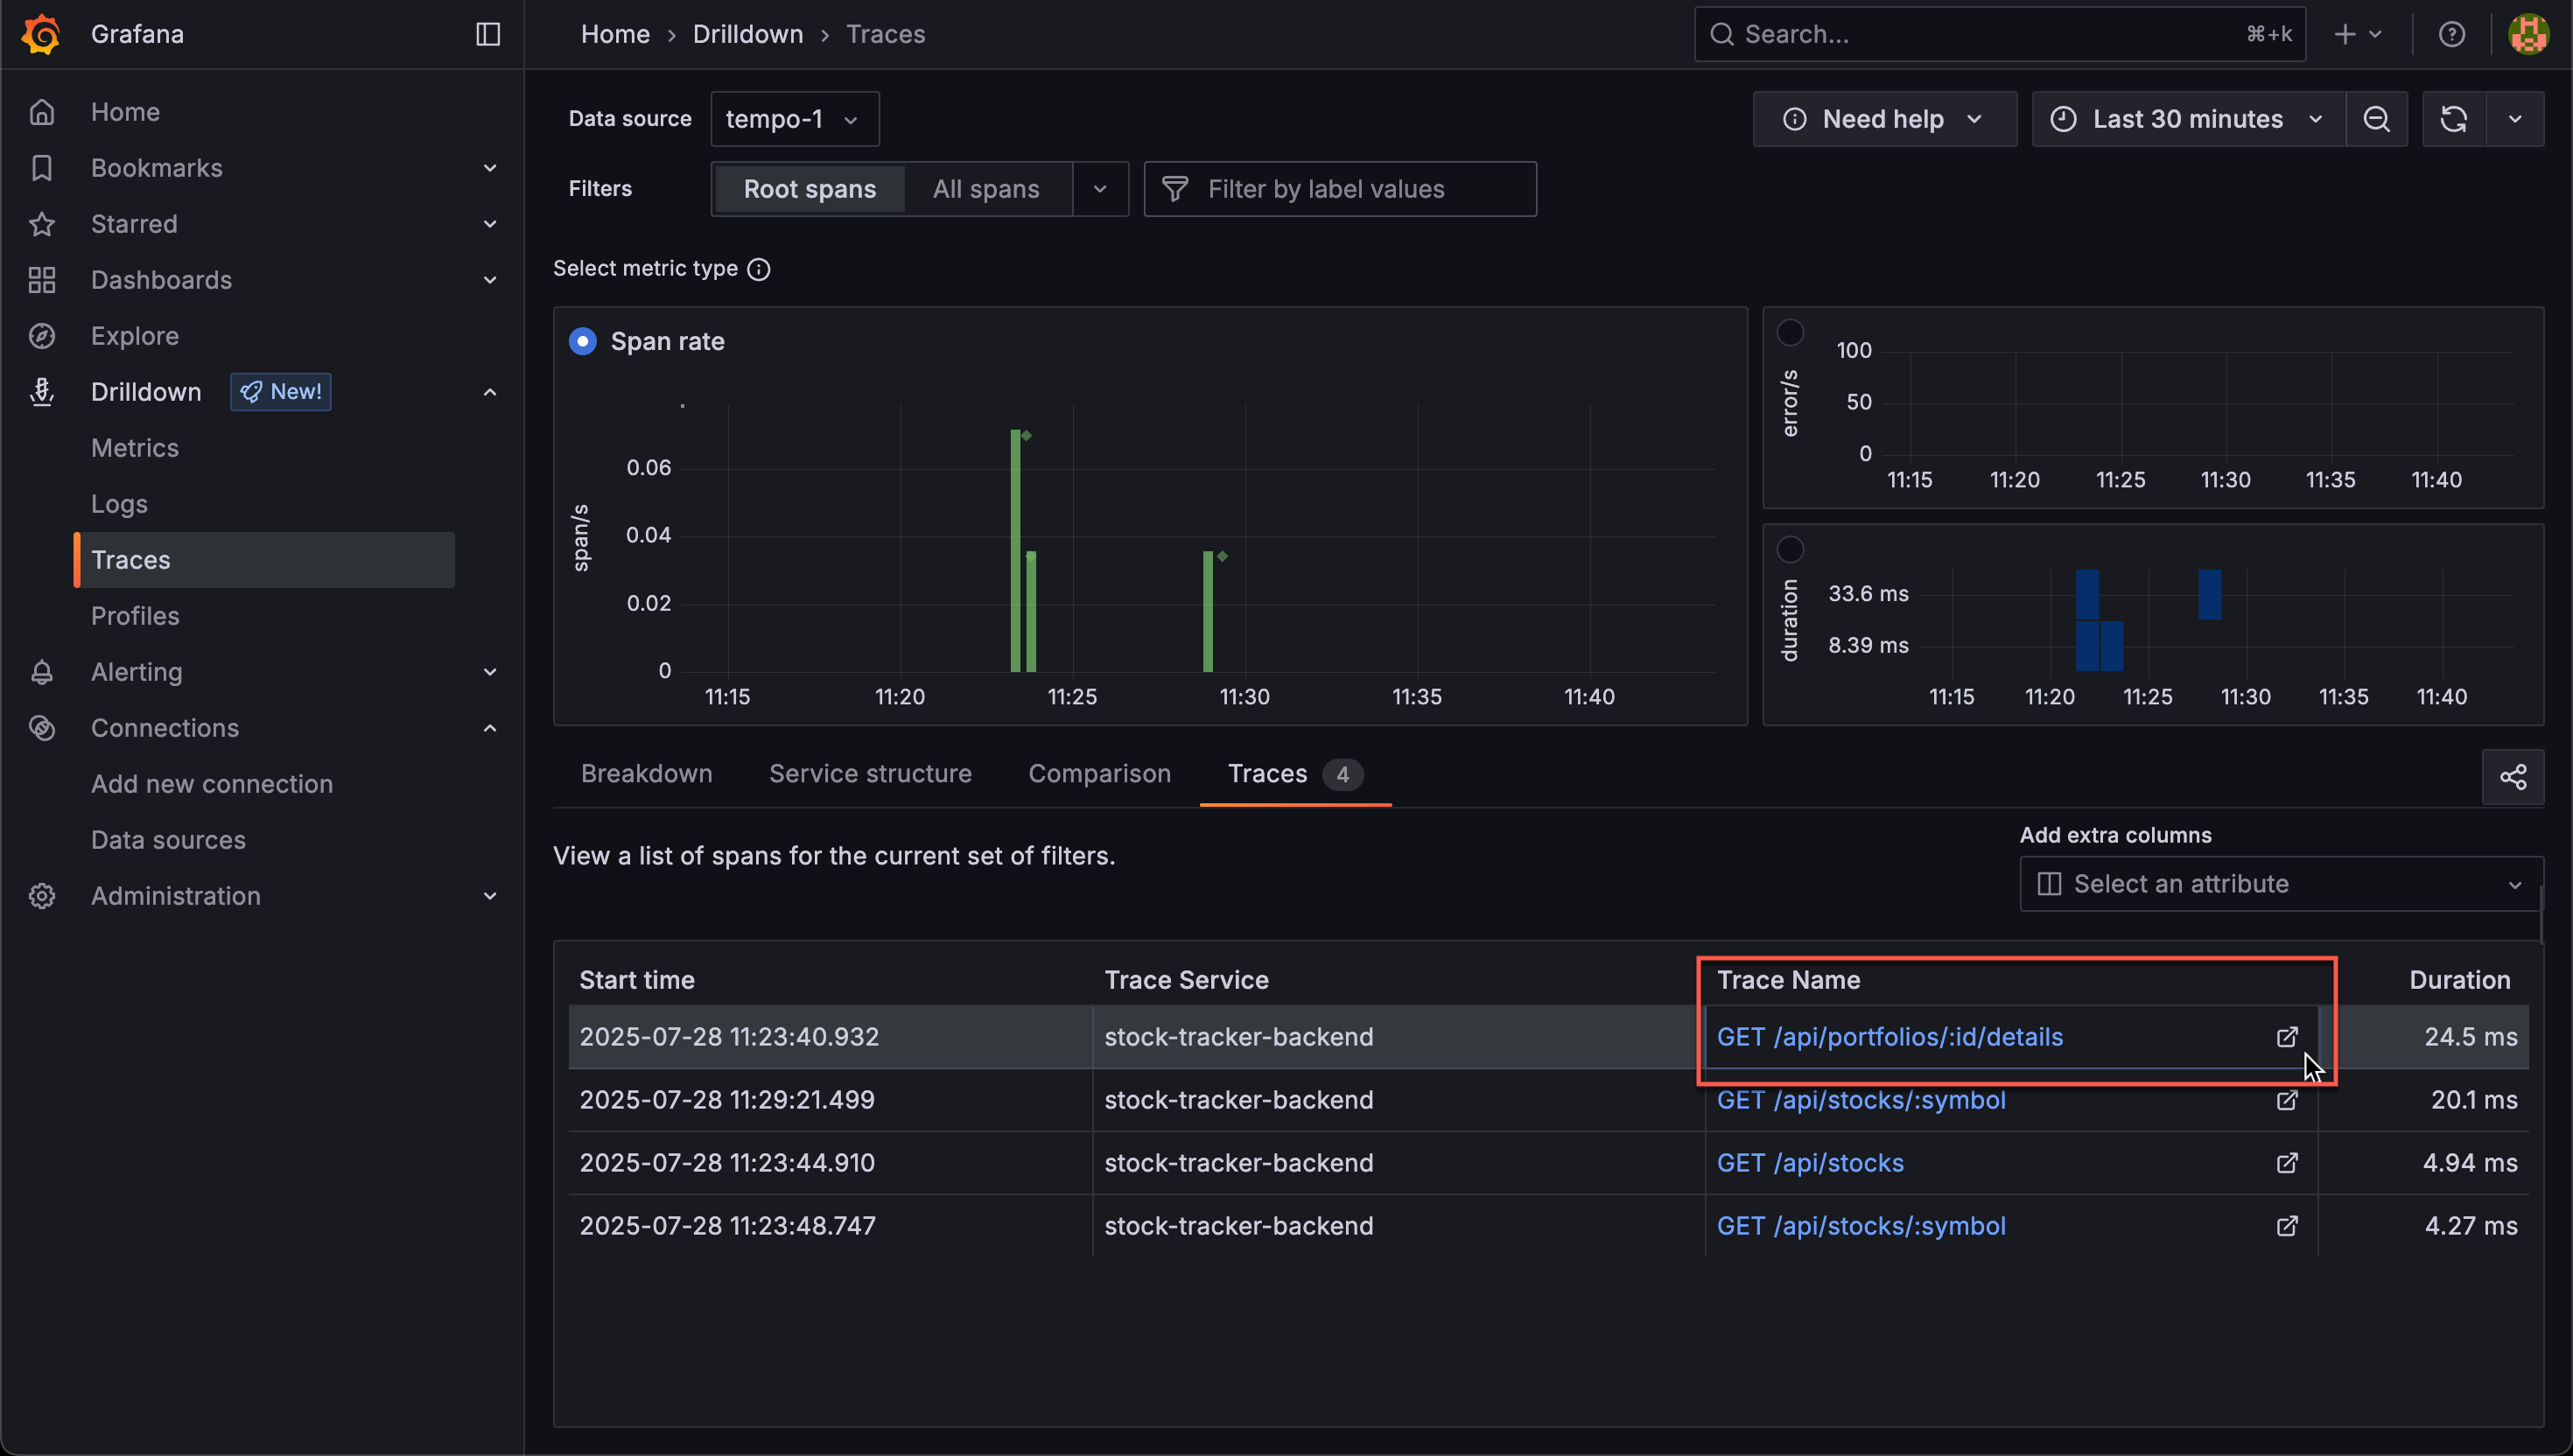
By clicking the Traces tab we get the individual traces recorded
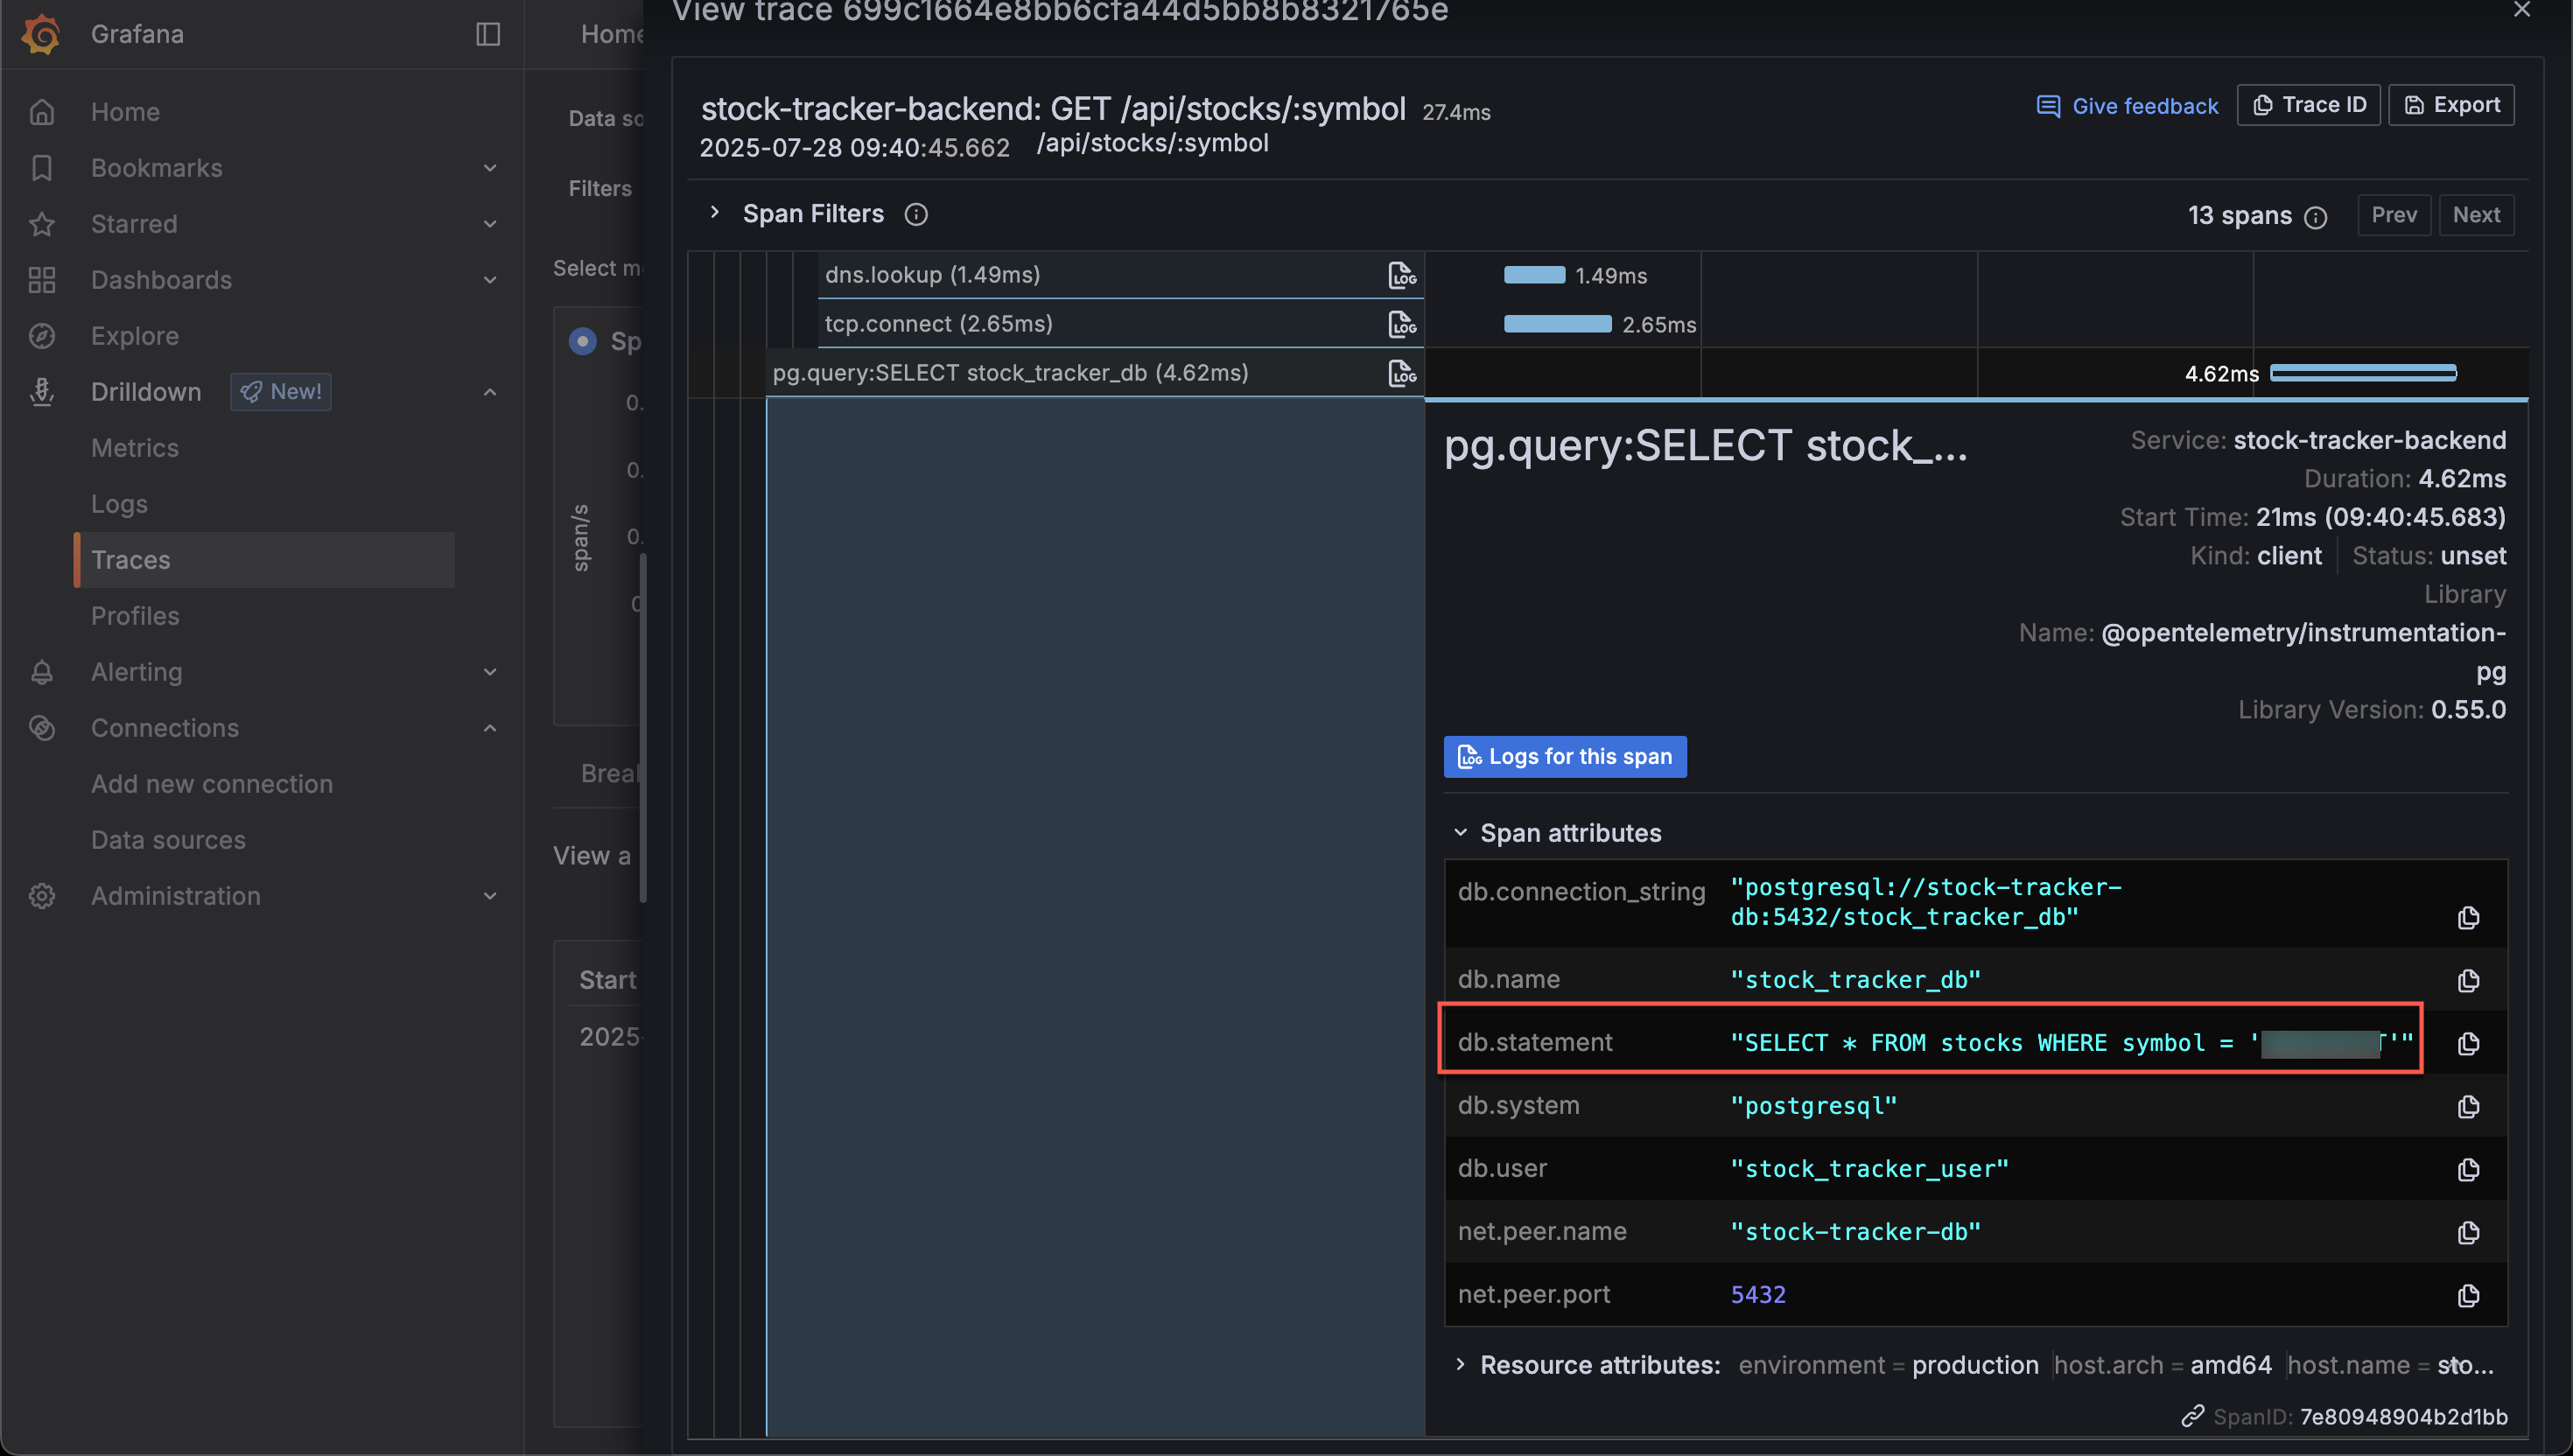
And by clicking one of them we can get even more details
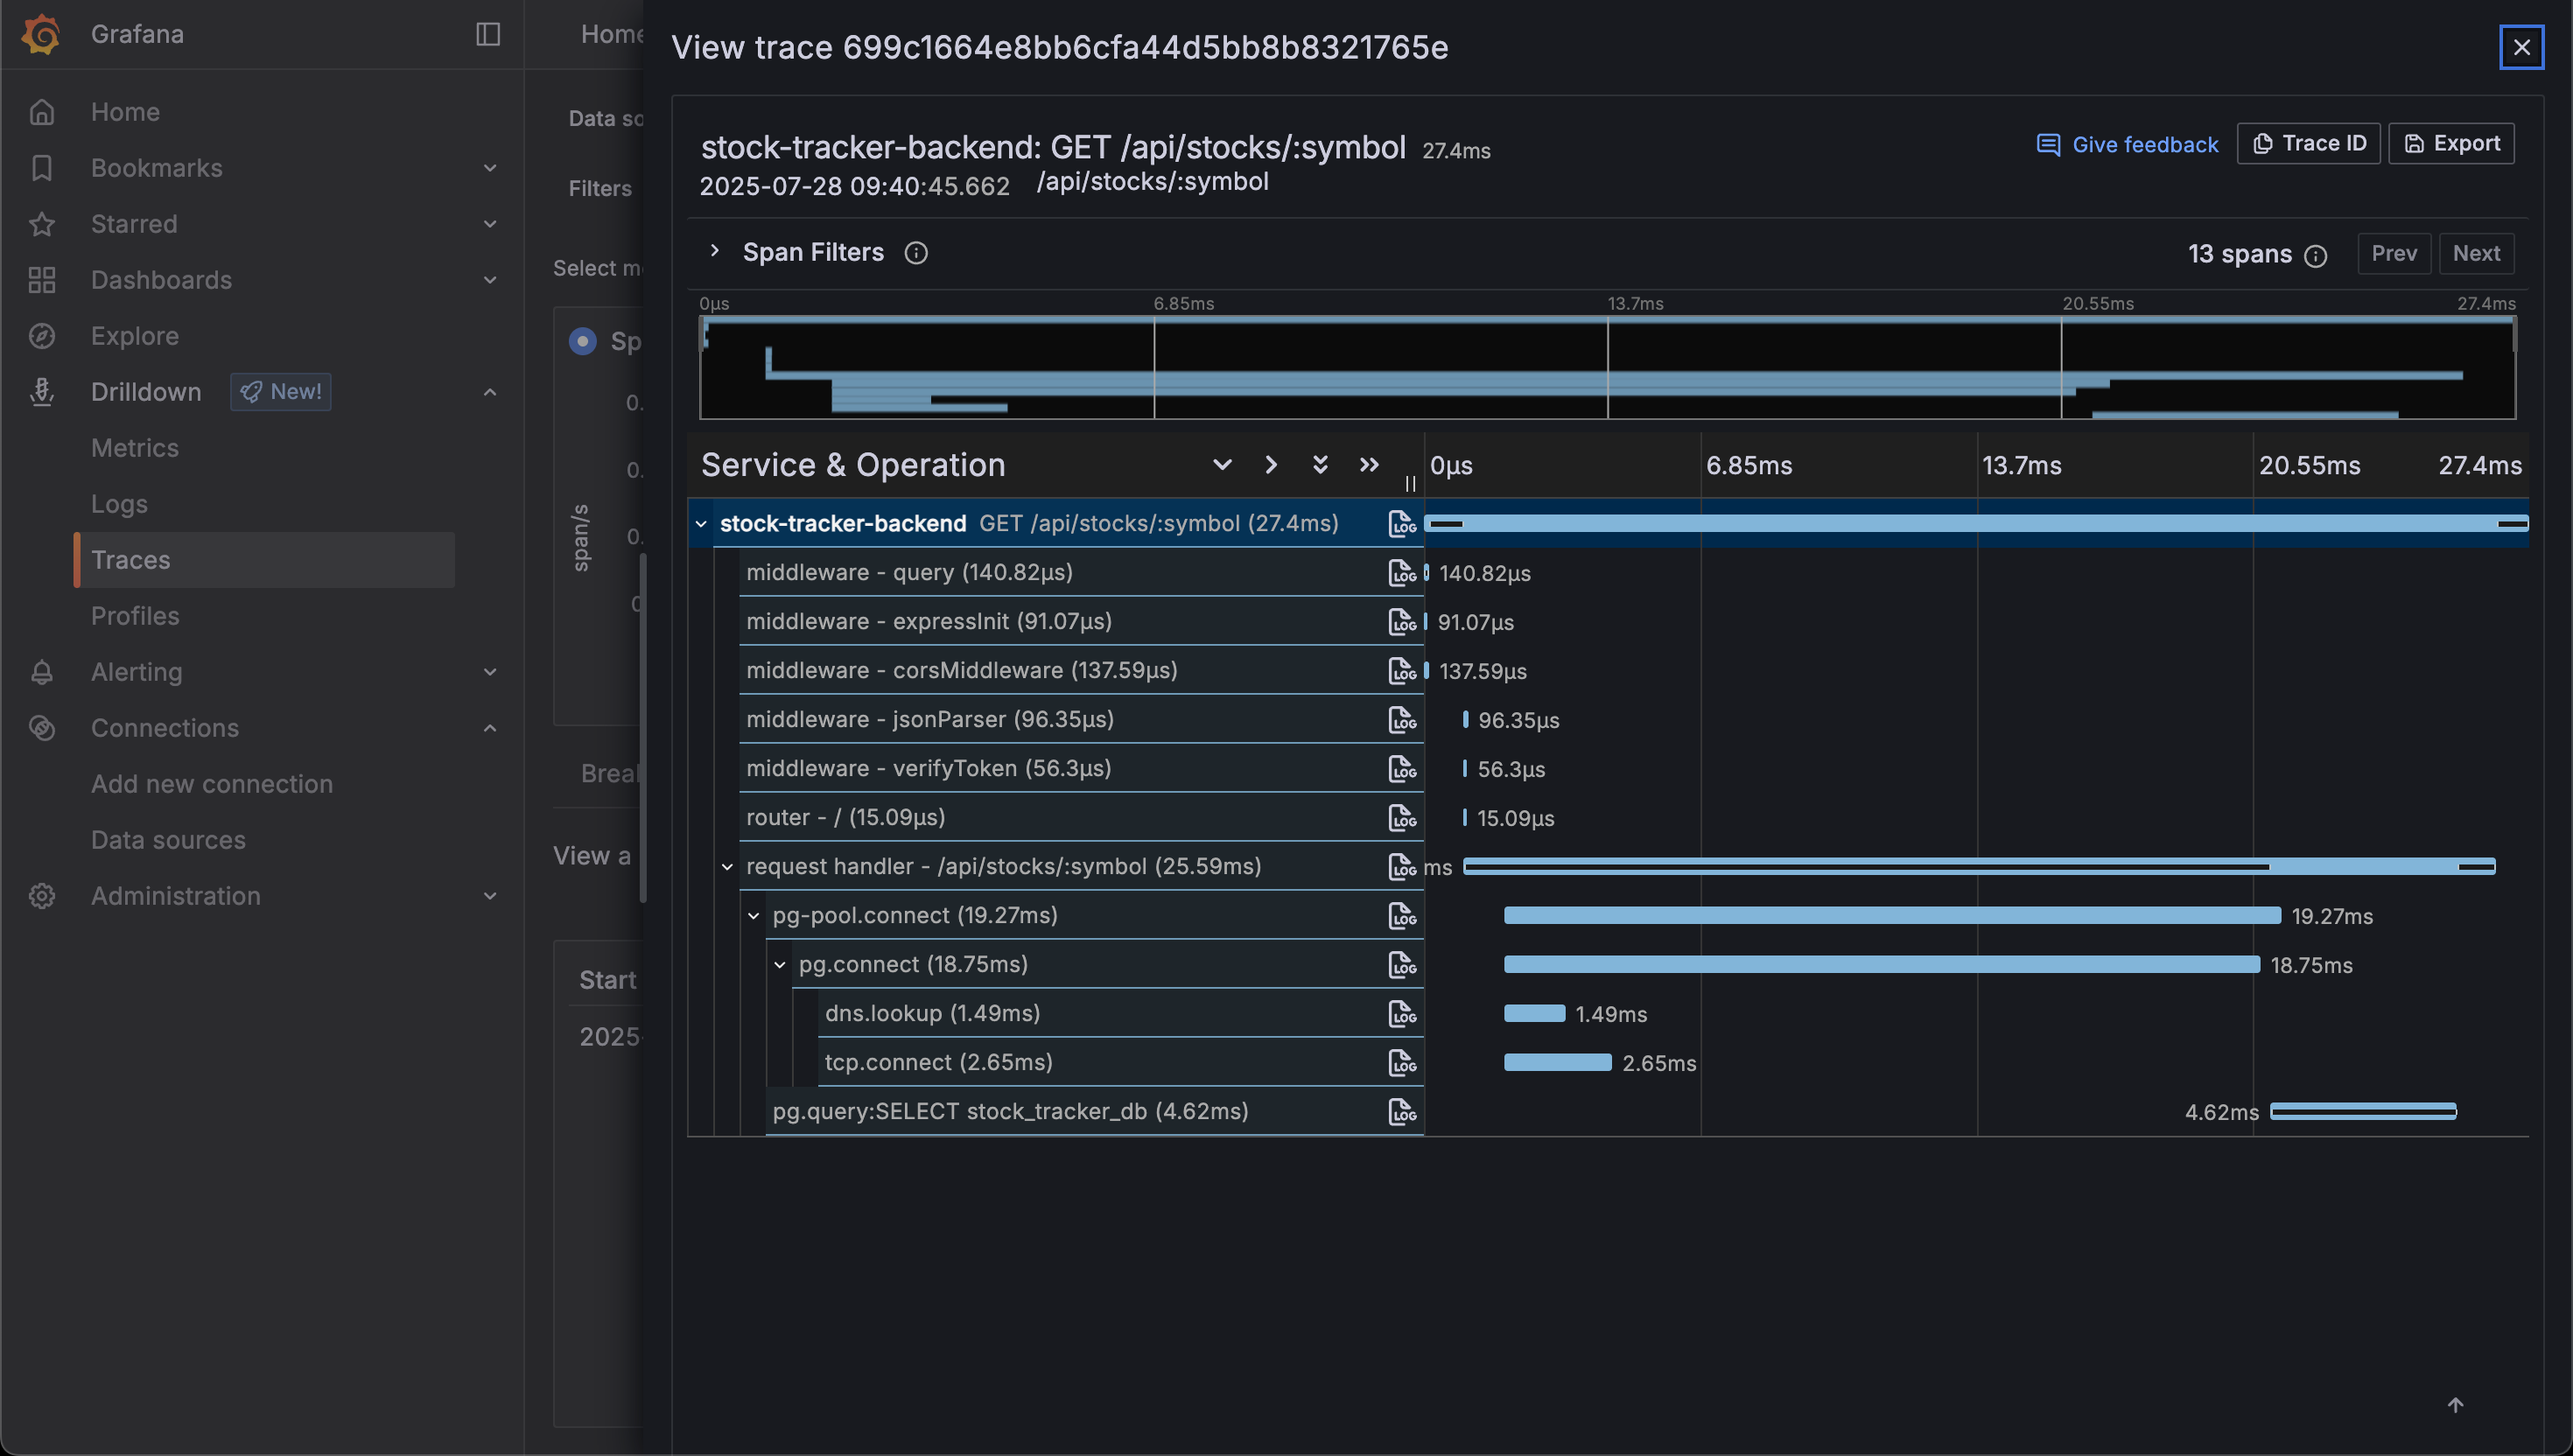
Right down to the actual database statement run
Metrics generator
Now, let's check out the Metrics generator in Tempo
The Metrics generator is a component that can create metrics from the traces ingested and write the metrics to Prometheus.
So, we'll update our Tempo config with the metrics_generator block, and also specify which generators to use in the overrides section
 1metrics_generator:
 2  registry:
 3    external_labels:
 4      source: tempo
 5  storage:
 6    path: /var/tempo/generator/wal
 7    remote_write:
 8      - url: http://<PROMETHEUS_SERVER>/api/v1/write
 9        send_exemplars: true
10  traces_storage:
11    path: /var/tempo/generator/traces
12
13overrides:
14  defaults:
15    ingestion:
16      rate_limit_bytes: 15000000
17    metrics_generator:
18      processors: [service-graphs, span-metrics, local-blocks] # enables metrics generator
19      #generate_native_histograms: both # My prometheus server doesn't have this feature enabled
Service graphs
Finally, we'll take a quick look at Service graphs.
The Metrics generator in Tempo has the service-graphs processor enabled in the config. This feature works by Tempo inspecting the traces and looking for spans with relationships, like the one between the API call for a stock and the backend's call to the database, and send this to Prometheus. However internally there's more relationships going on. All of the individual spans get's linked to a Trace. These relationships can then be visualized in a Service graph in Grafana.
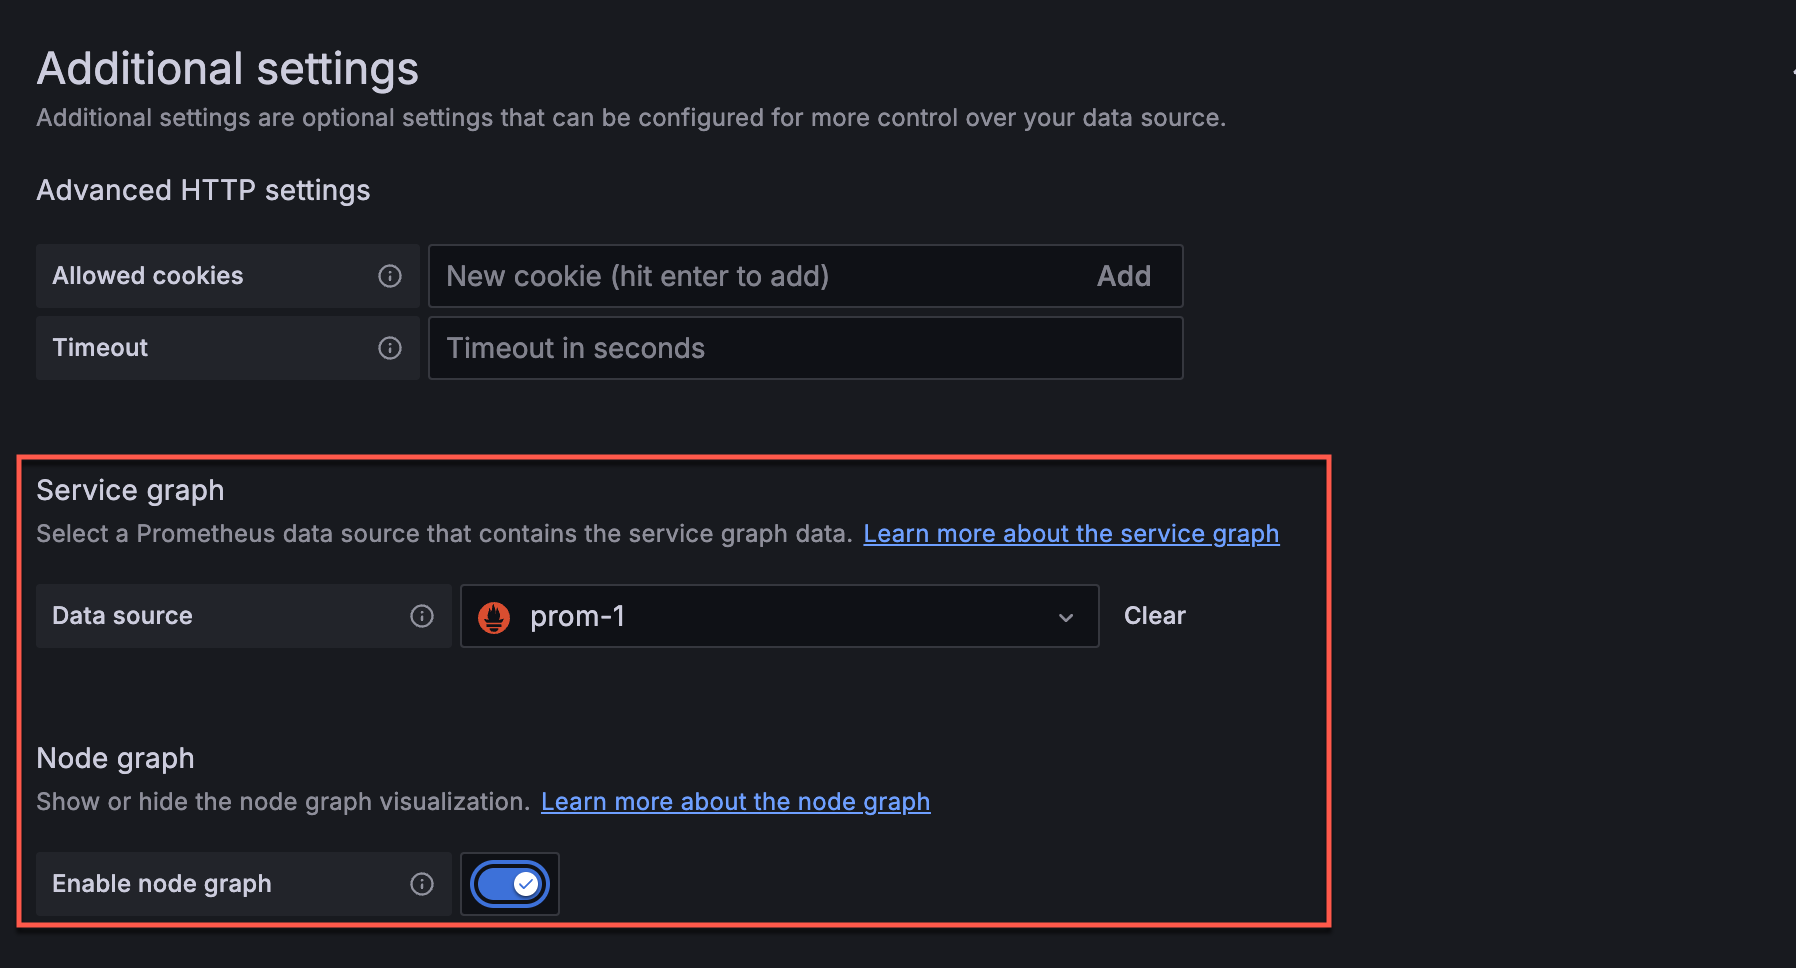
To make this work in Grafana we also need to update the Tempo datasource by configuring the Prometheus datasource for the graphs
With that enabled, let's head over to one of our Traces and see the magic
By clicking the link on the trace we get directed to the Explore feature and the Node graph tab. When expanding the
Node graph row we get a nice visualization of all calls made and we can quickly see the running time for individual calls
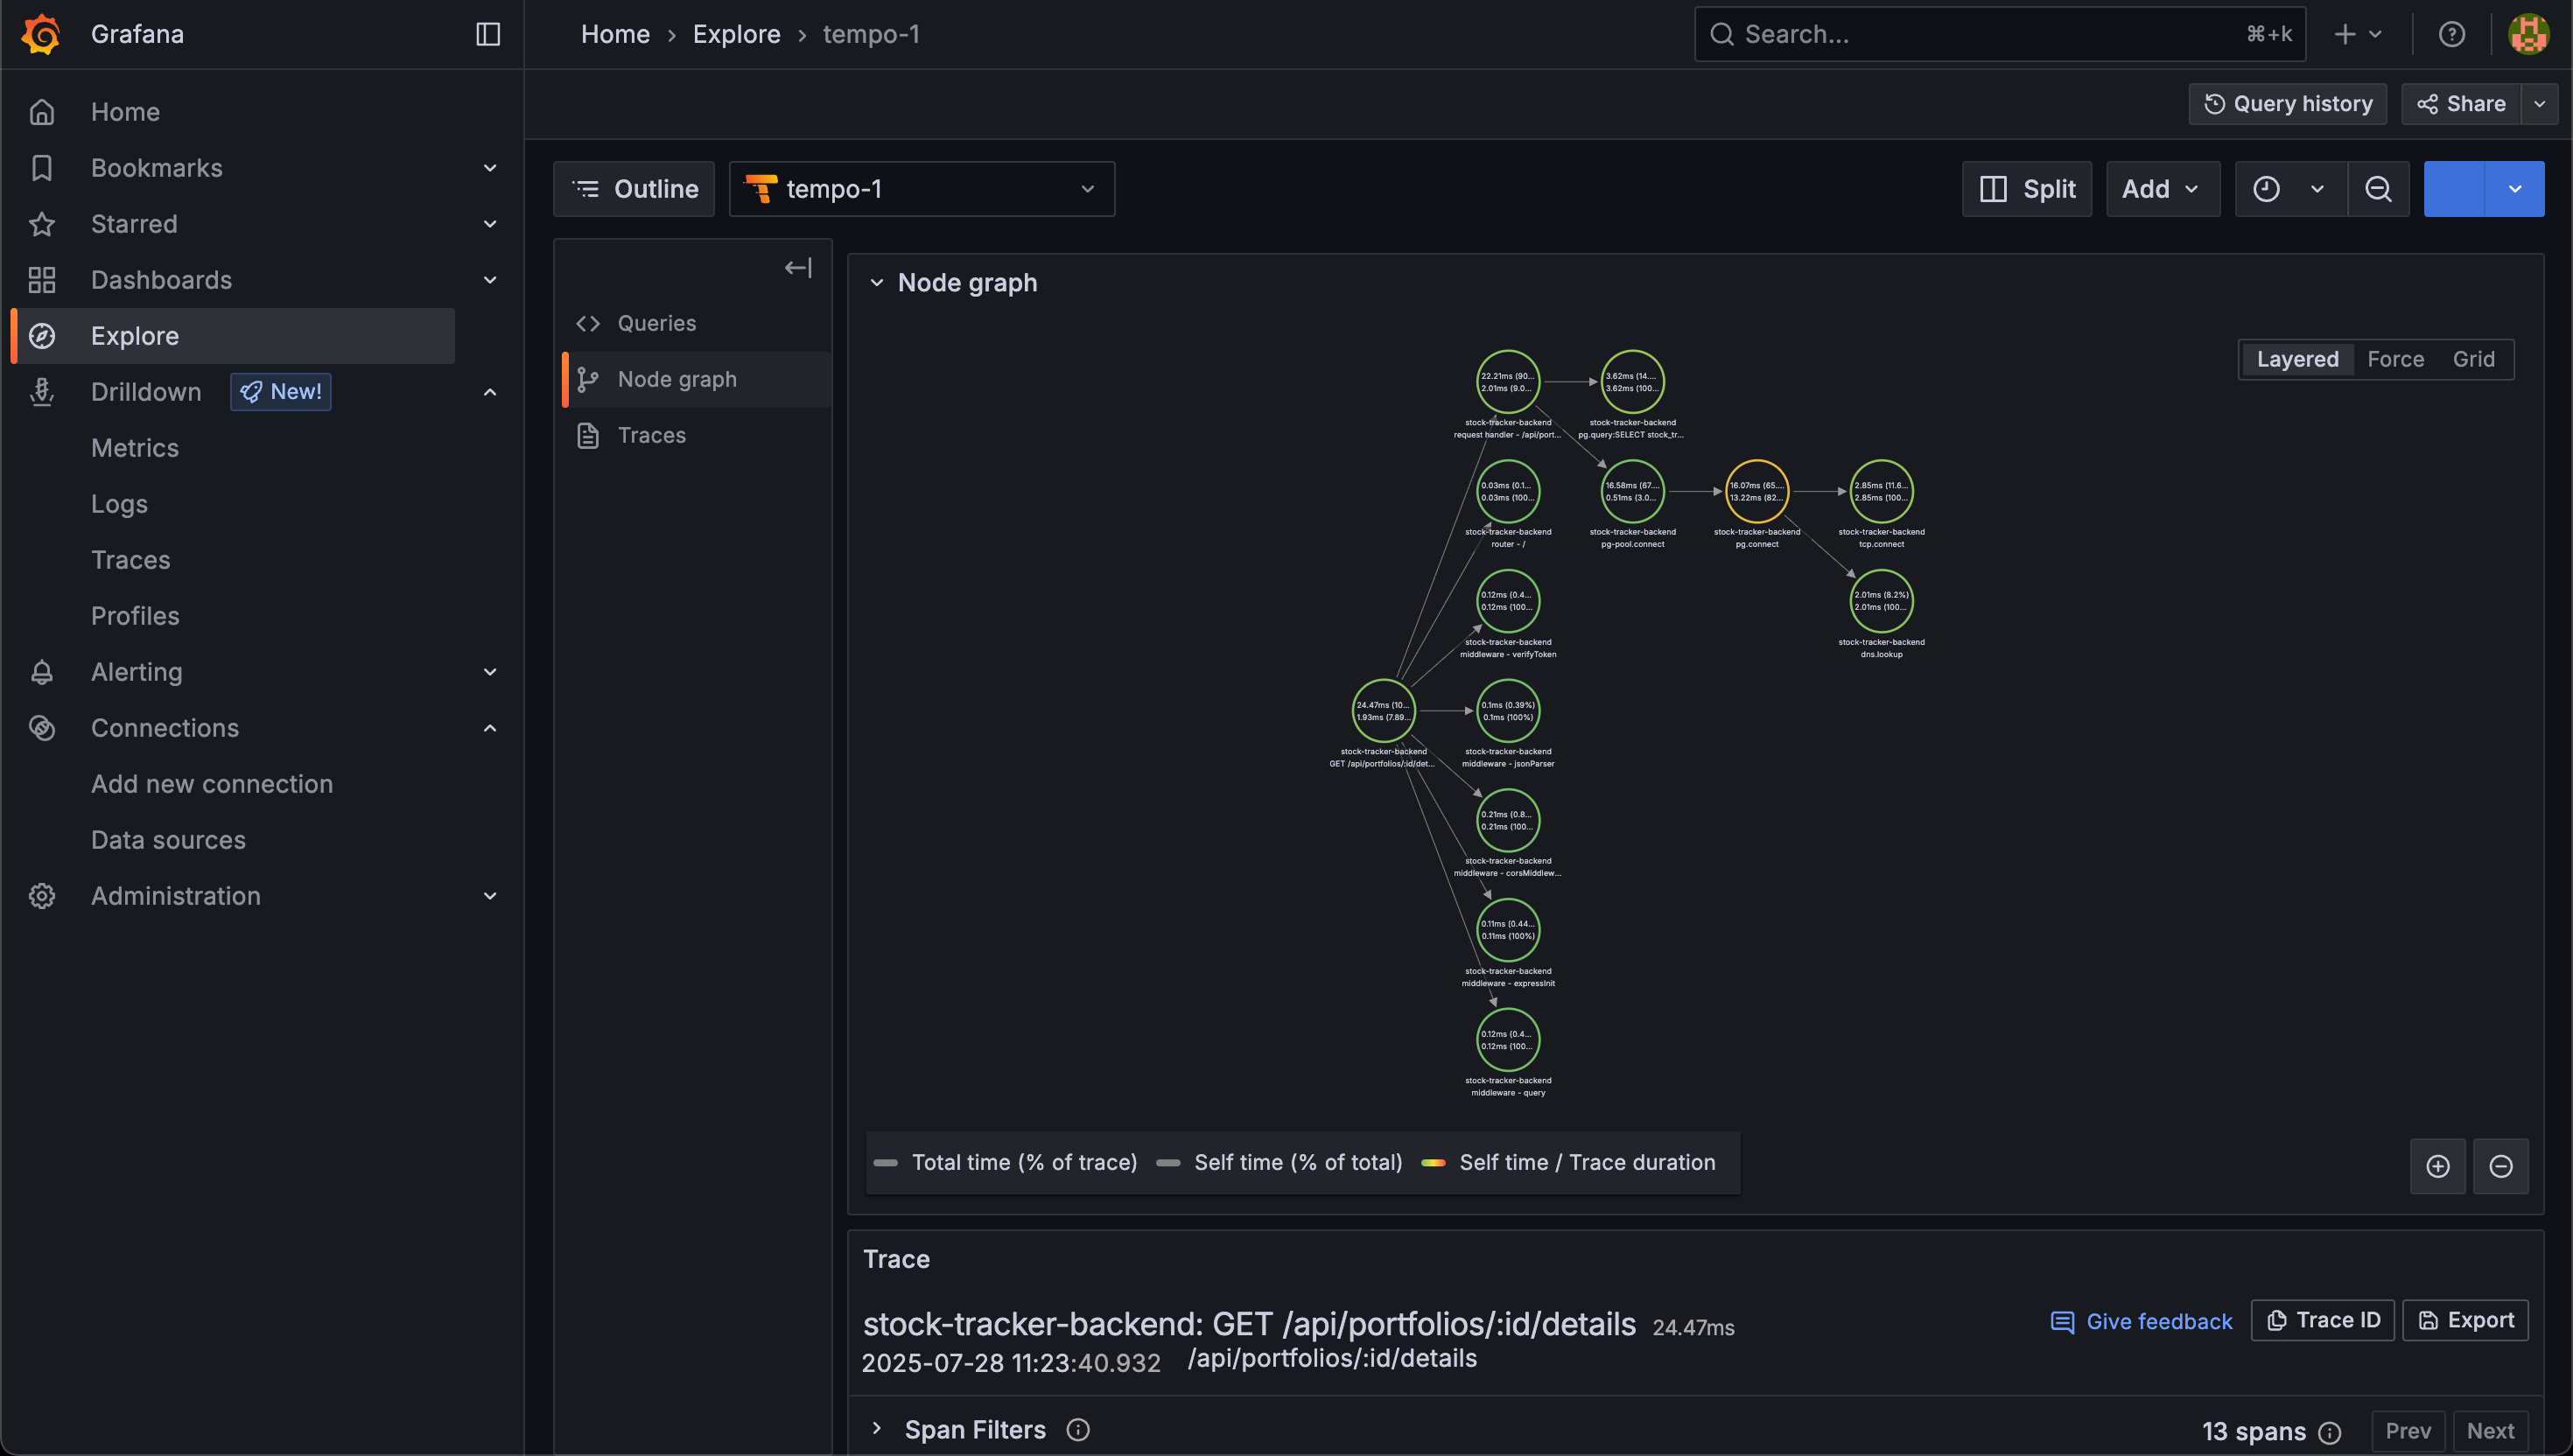
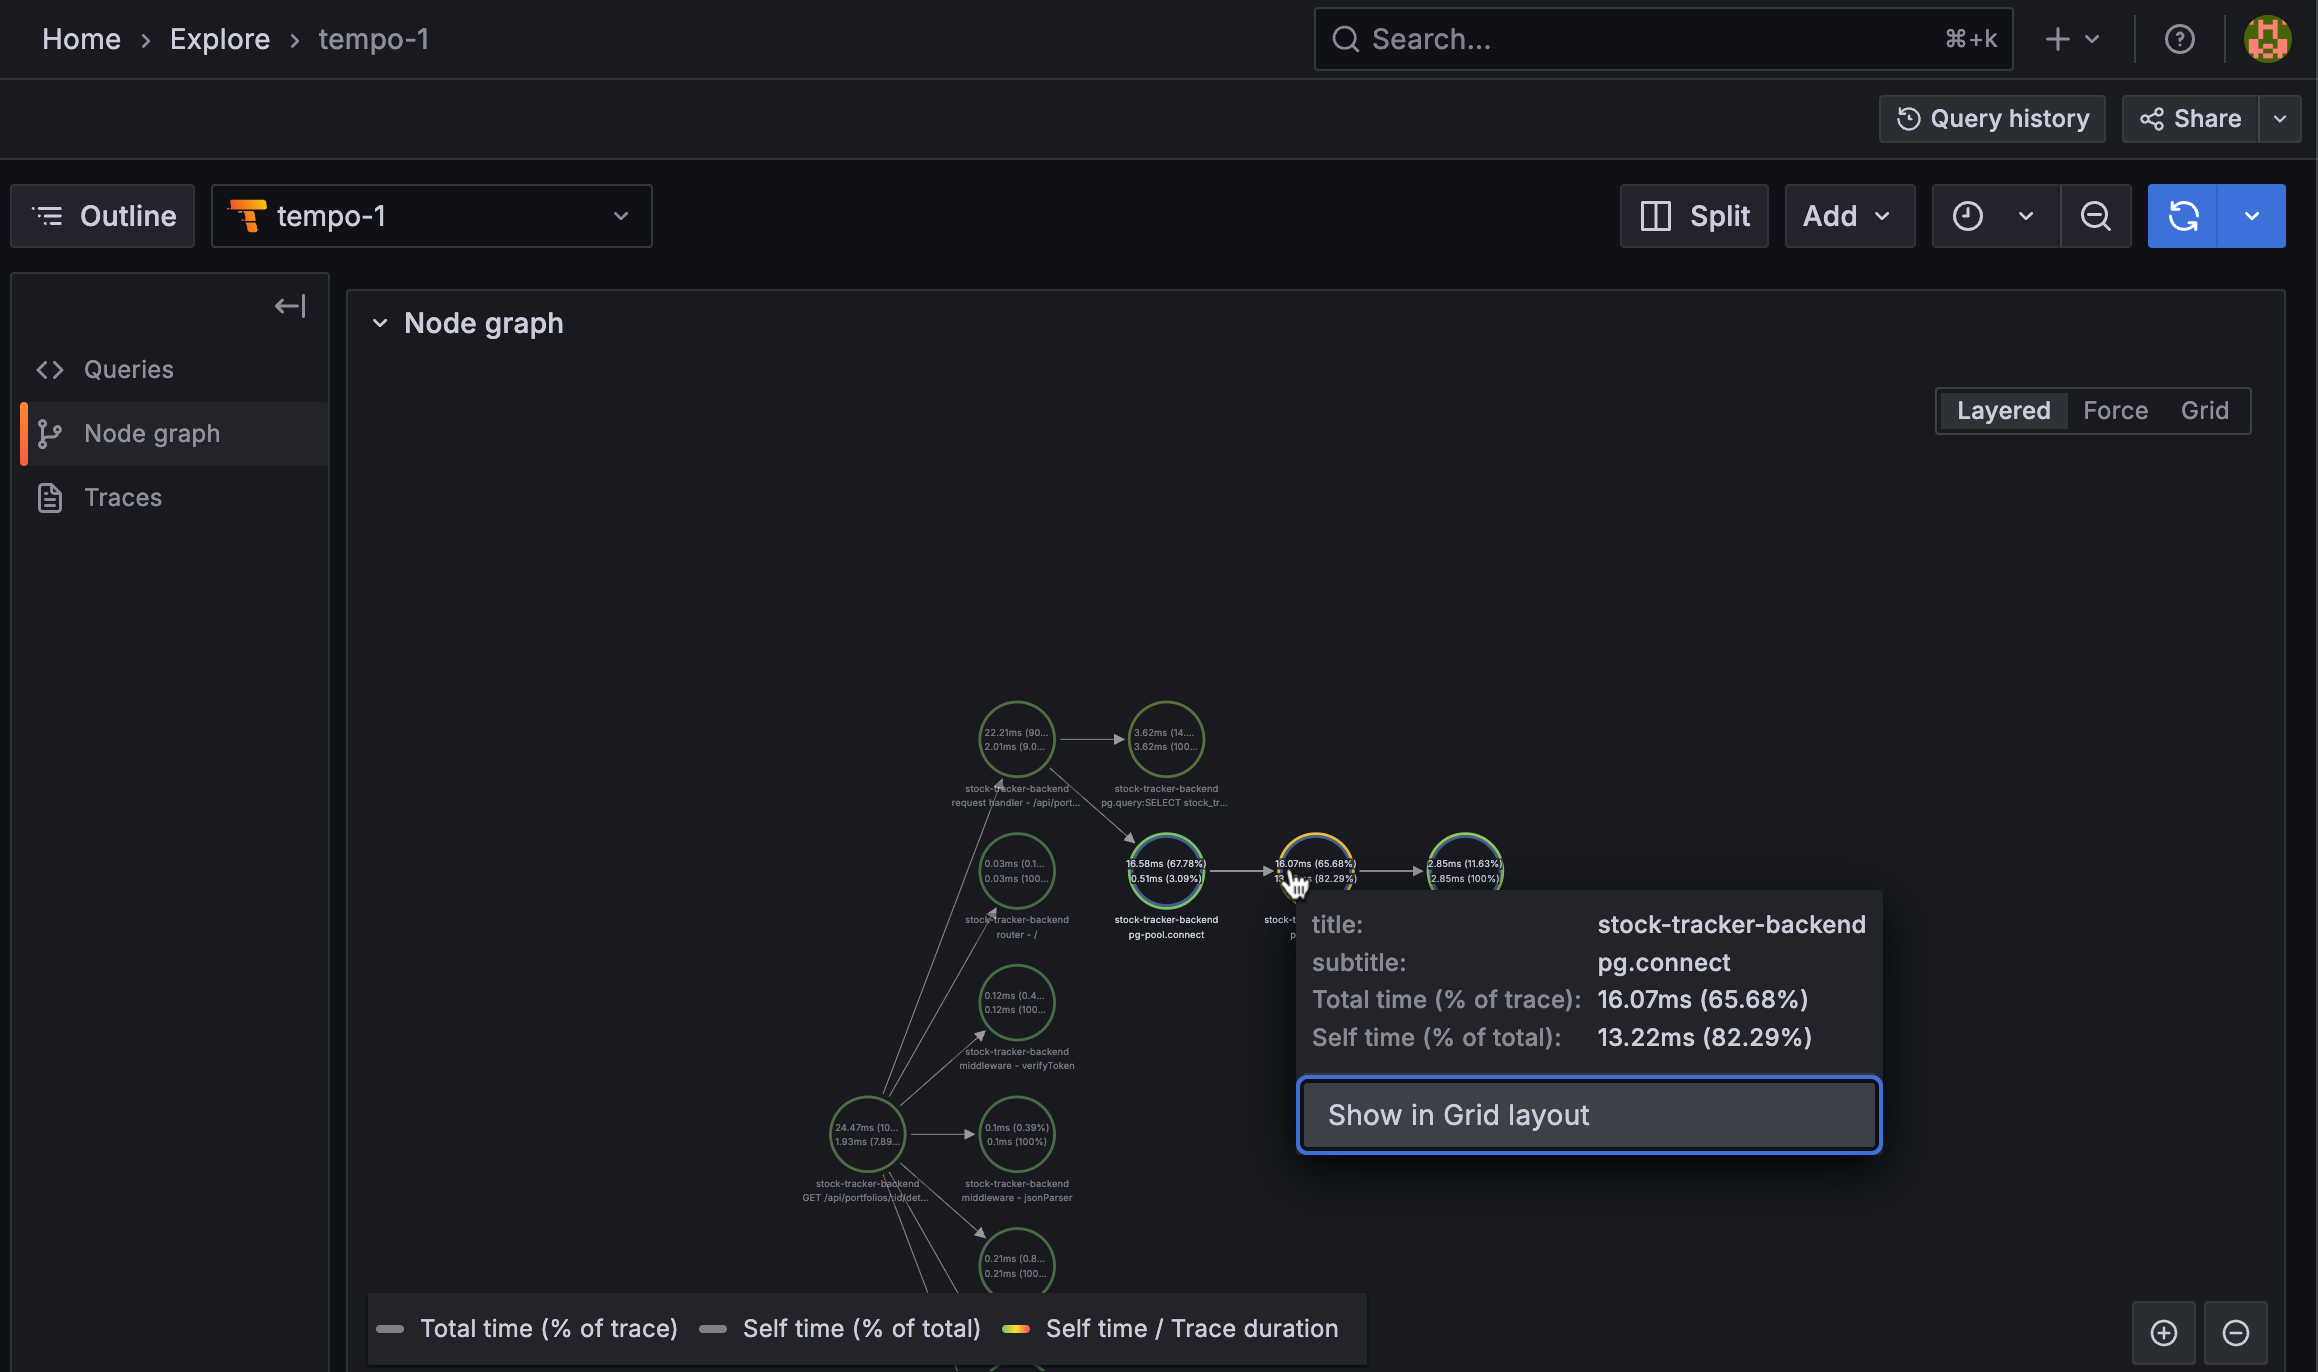
And by clicking one of them we get some more details, showing e.g. the total time and the percentage of the whole trace
Note that there is an option to enable service graphs in Alloy, but the Tempo documentation recommends that this is done by Tempo as it's more efficient
Logs
Lastly we'll look at logs which is one of the signals mentioned at the start of this post.
The OpenTelemetry Logs API for JavaScript is still experimental. It may change or be deprecated in future releases — use with caution in production environments
The code and configuration below is loosely stitched together from the available examples in the OpenTelemetry SDK documentation
Instrumenting logs in the app
We need to add a few packages to our Node.js app
1npm install @opentelemetry/sdk-logs @opentelemetry/api-logs @opentelemetry/exporter-logs-otlp-proto
With these in place we can update our instrumentation.js file with the logger code. Note that since we can't rely on autoinstrumentation as we do for Metrics and Traces we need to do some more configuration
 1const { resourceFromAttributes } = require('@opentelemetry/resources');
 2const { LoggerProvider, BatchLogRecordProcessor } = require('@opentelemetry/sdk-logs');
 3const { OTLPLogExporter } = require('@opentelemetry/exporter-logs-otlp-proto');
 4const logsAPI = require('@opentelemetry/api-logs');
 5
 6// Create the LogExporter
 7const logExporter = new OTLPLogExporter({
 8    url: process.env.OTLP_LOG_EXPORTER_URL || 'http://localhost:4318/v1/logs',
 9    headers: {
10      'Content-Type': 'application/x-protobuf',
11    },
12  });
13
14// Create a LoggerProvider
15const loggerProvider = new LoggerProvider({
16    resource: resourceFromAttributes({
17      'service.name': process.env.APP_NAMESPACE || 'stock-tracker',
18      'service.version': process.env.APP_VERSION || '0.1.0',
19      'service.namespace': process.env.OTEL_SERVICE_NAME || 'stock-tracker-backend'
20    }),
21    processors: [new BatchLogRecordProcessor(logExporter)],
22});
23
24// Register the provider globally
25logsAPI.logs.setGlobalLoggerProvider(loggerProvider);
In this example we're defining the OTLP resource attributes with resourceFromAttributes as I couldn't get the defaults to work as before.
Now, to be able to send logs to our Alloy collector we need to make use of the global LoggerProvider. For some reusability I've created a small module which can be used
 1// otel-logger.js
 2
 3const { logs } = require('@opentelemetry/api-logs');
 4
 5// Get the global logger provider (set in instrumentation.js)
 6const appName = process.env.OTEL_SERVICE_NAME || 'stock-tracker-backend';
 7const logger = logs.getLogger(appName);
 8
 9// Optional: wrap it with convenience methods
10function logInfo(message, attributes = {}) {
11  logger.emit({
12    severityText: 'INFO',
13    body: message,
14    attributes,
15  });
16}
17
18function logError(message, attributes = {}) {
19  logger.emit({
20    severityText: 'ERROR',
21    body: message,
22    attributes,
23  });
24}
25
26// Export the logger and helper methods
27module.exports = {
28  logger,
29  logInfo,
30  logError,
31};
And in my code I can now use one of the logXYZ functions to write log lines for OTLP to export.
 1const { logInfo, logError } = require('../otel-logger');
 2
 3router.get('/:symbol', async (req, res) => {
 4  console.debug(`Searching for stock with symbol ${req.params.symbol}`);
 5  logInfo(`Searching for stock with symbol ${req.params.symbol}`);
 6  const { symbol } = req.params;
 7
 8  const result = await pool.query(
 9    `SELECT * FROM stocks WHERE symbol = '${symbol}'`,
10  );
11
12  res.json(result.rows[0]);
13});
The logging done here is strictly for the application and will not include logs from our infrastructure. Note that there's other ways to configure logging also in a containerized environments with sidecars and so forth, but this setup is to show how one could put it together with OTel and Loki
Collector config for logs
For Alloy to receive and forward logs we'll modify our collector config. We'll also look at how to do some processing before passing it on.
 1otelcol.receiver.otlp "default" {
 2  http {}
 3
 4  output {
 5    metrics = [otelcol.exporter.prometheus.default.input]
 6    traces = [otelcol.exporter.otlp.tempo.input]
 7    logs = [otelcol.processor.attributes.default.input]
 8  }
 9}
10otelcol.processor.attributes "default" {
11  action {
12    key = "loki.resource.labels"
13    action = "insert"
14    value = "service.name, service.namespace"
15  }
16
17  output {
18    logs = [otelcol.exporter.loki.default.input]
19  }
20}
21otelcol.exporter.loki "default" {
22  forward_to = [loki.write.default.receiver]
23}
24loki.write "default" {
25  endpoint {
26    url = "http://<LOKI_SERVER>/loki/api/v1/push"
27  }
28}
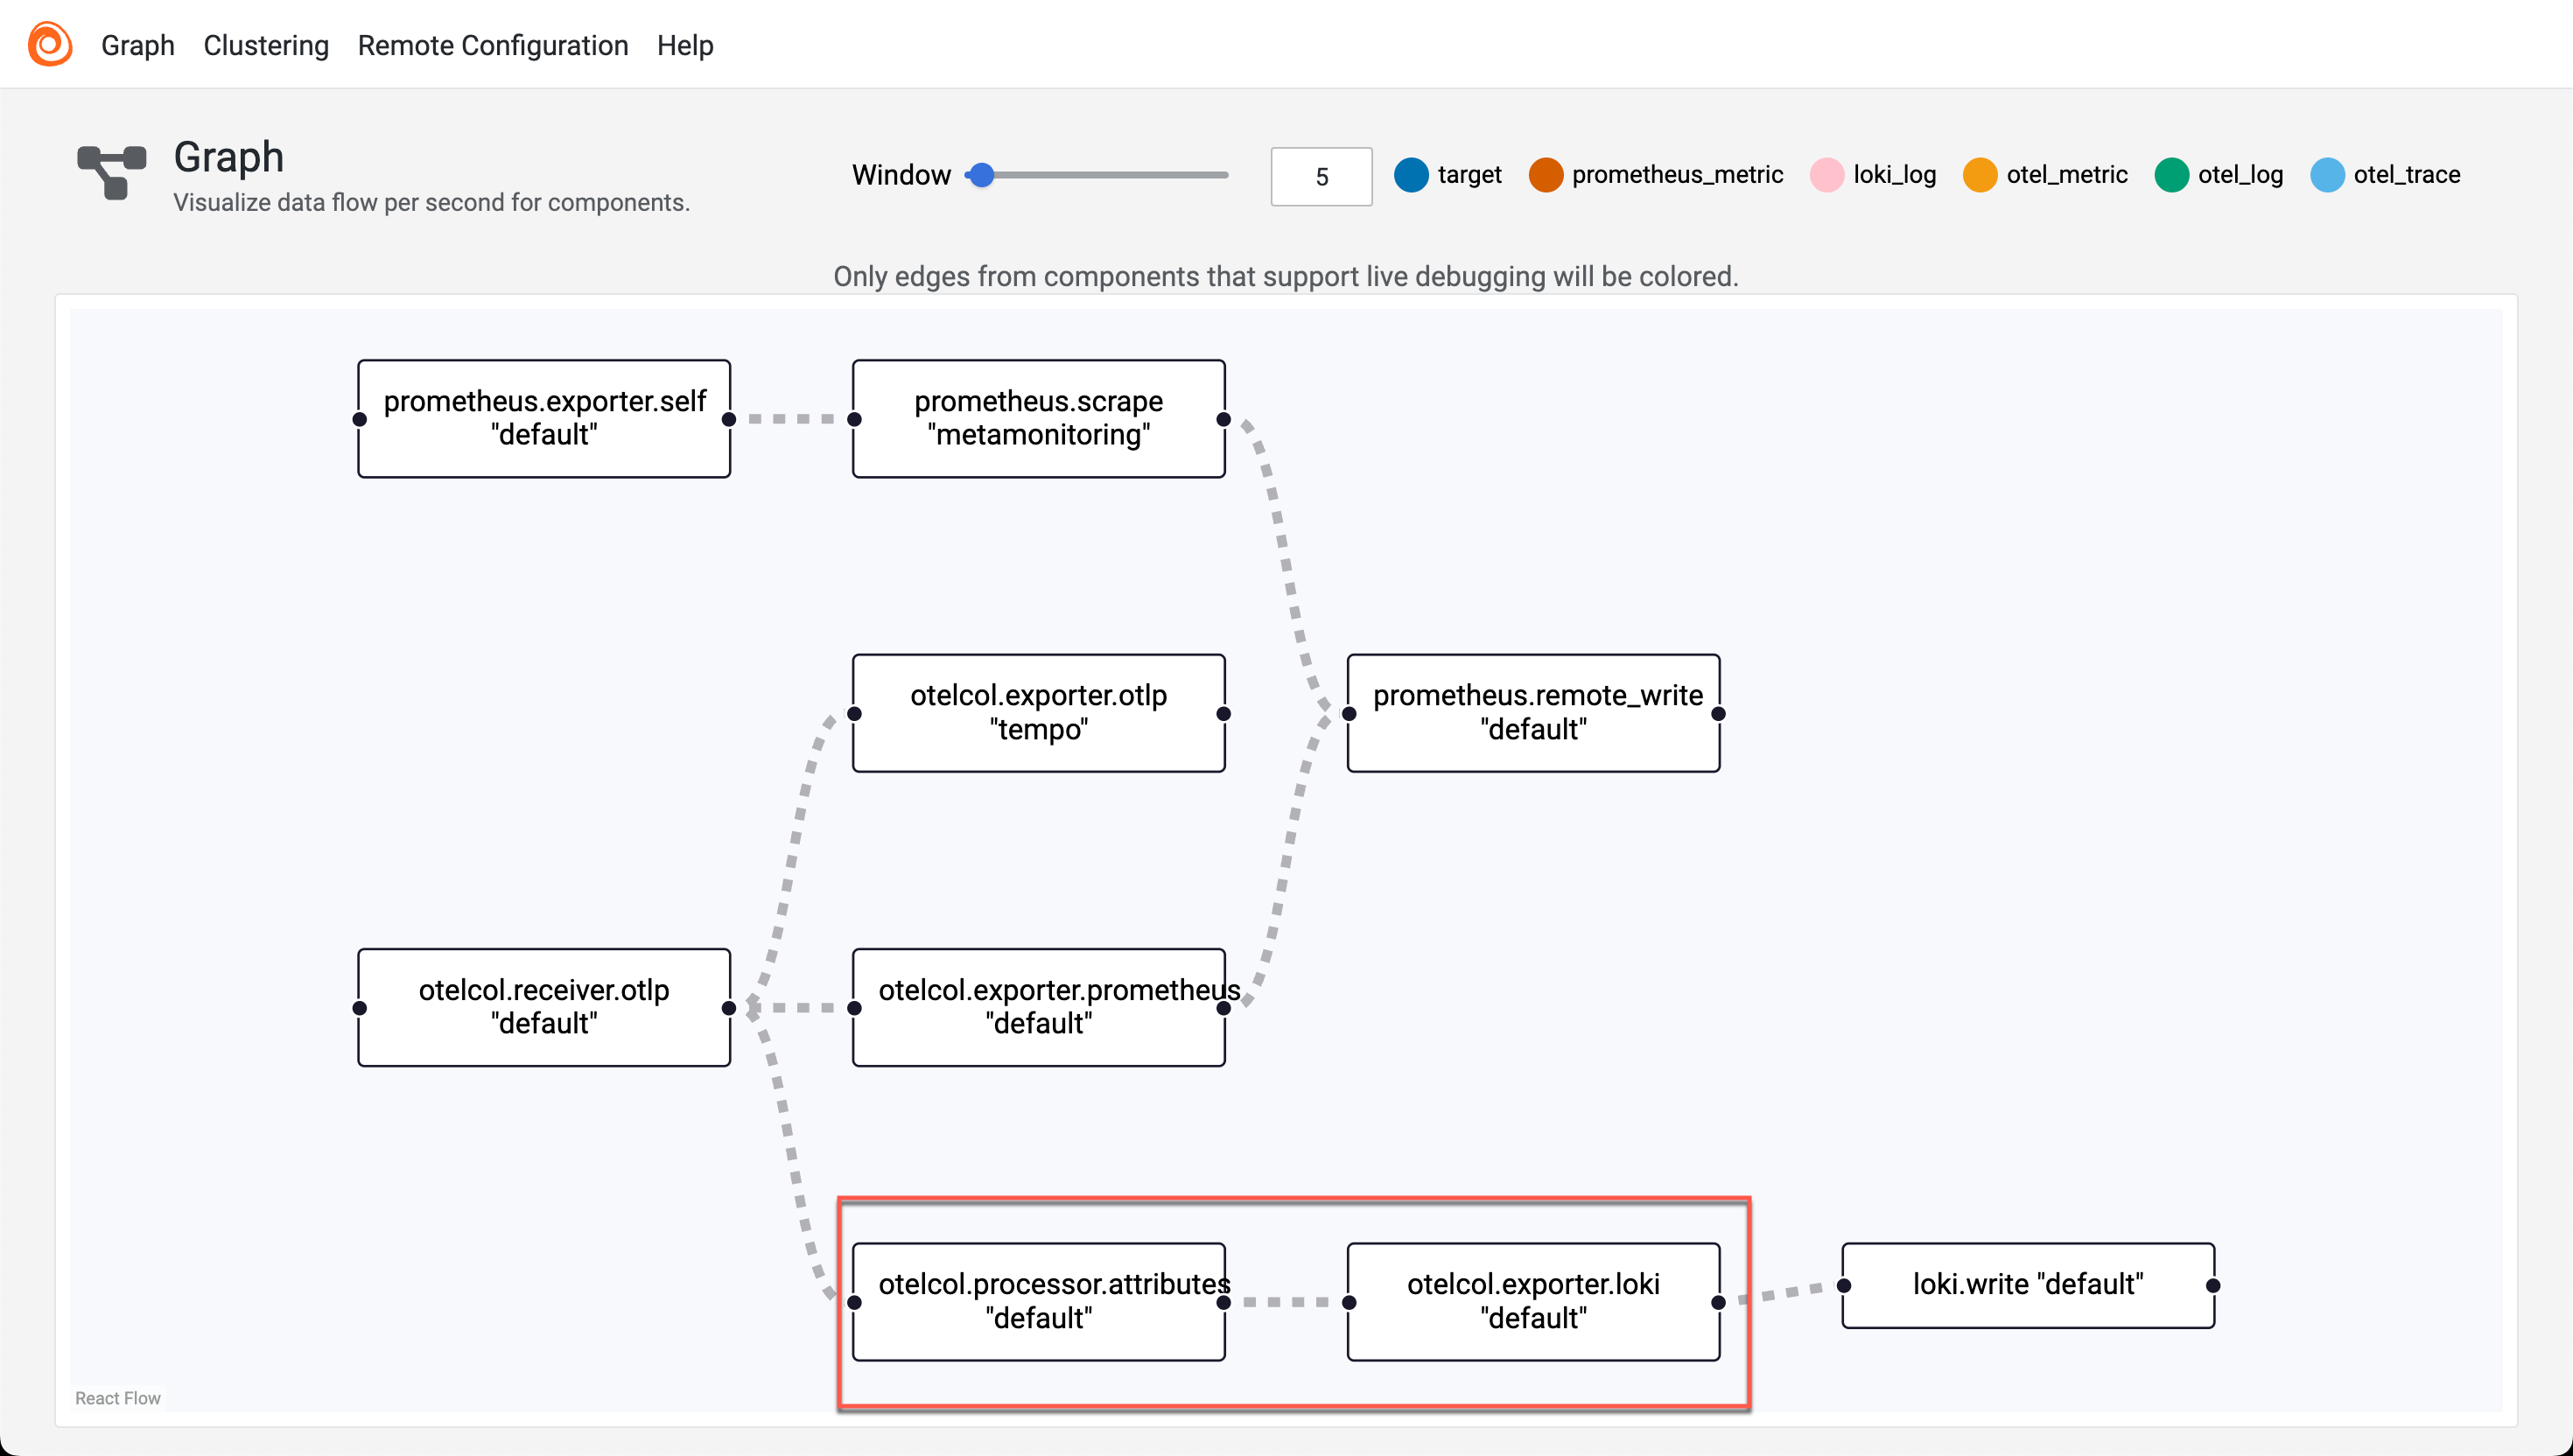
We'll add logs as one of the outputs from the existing otelcol.receiver.otlp component. This will forward the logs to a new component otelcol.processor.attributes named "default". This will process the logs and convert two of the resource labels to Loki labels. After processing the labels this component will output to the new component otelcol.exporter.loki named "default". This will in turn utilize the existing loki.write component to send the logs on to our Loki server
With this in place we get the new components and connections in the Alloy UI
Visualizing app logs in Grafana
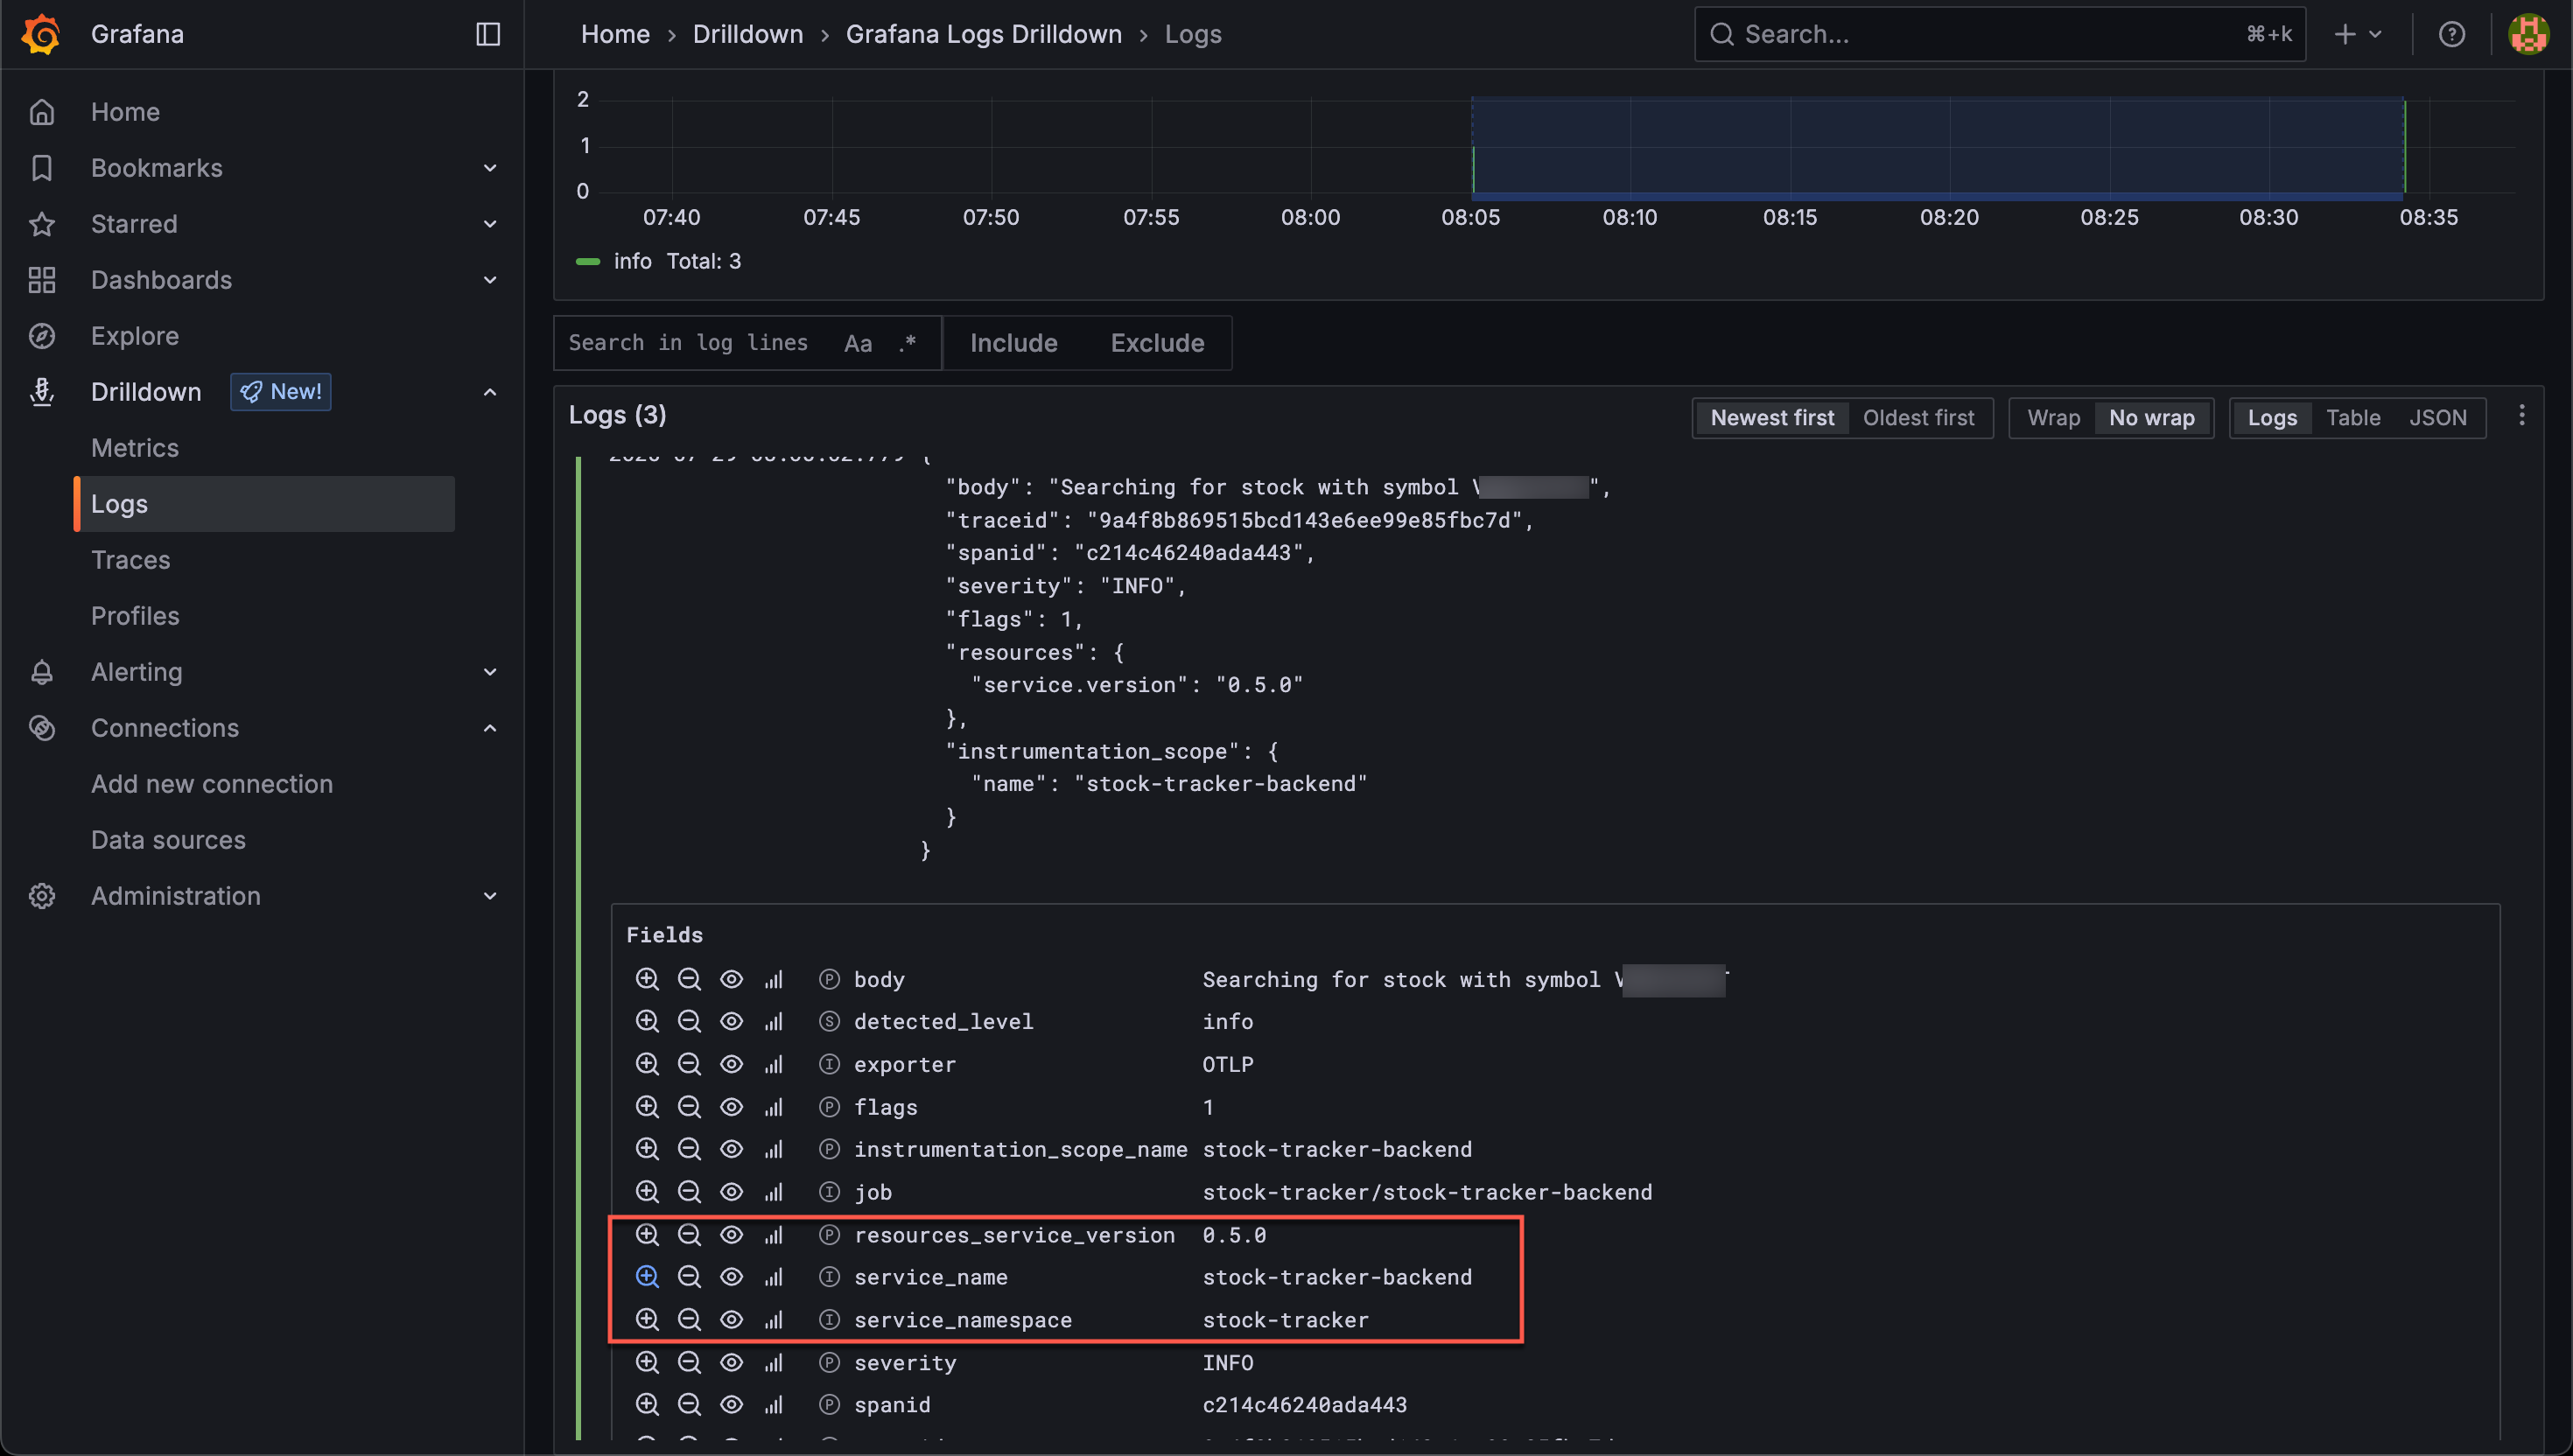
Over in Grafana we can verify that our logs is appearing
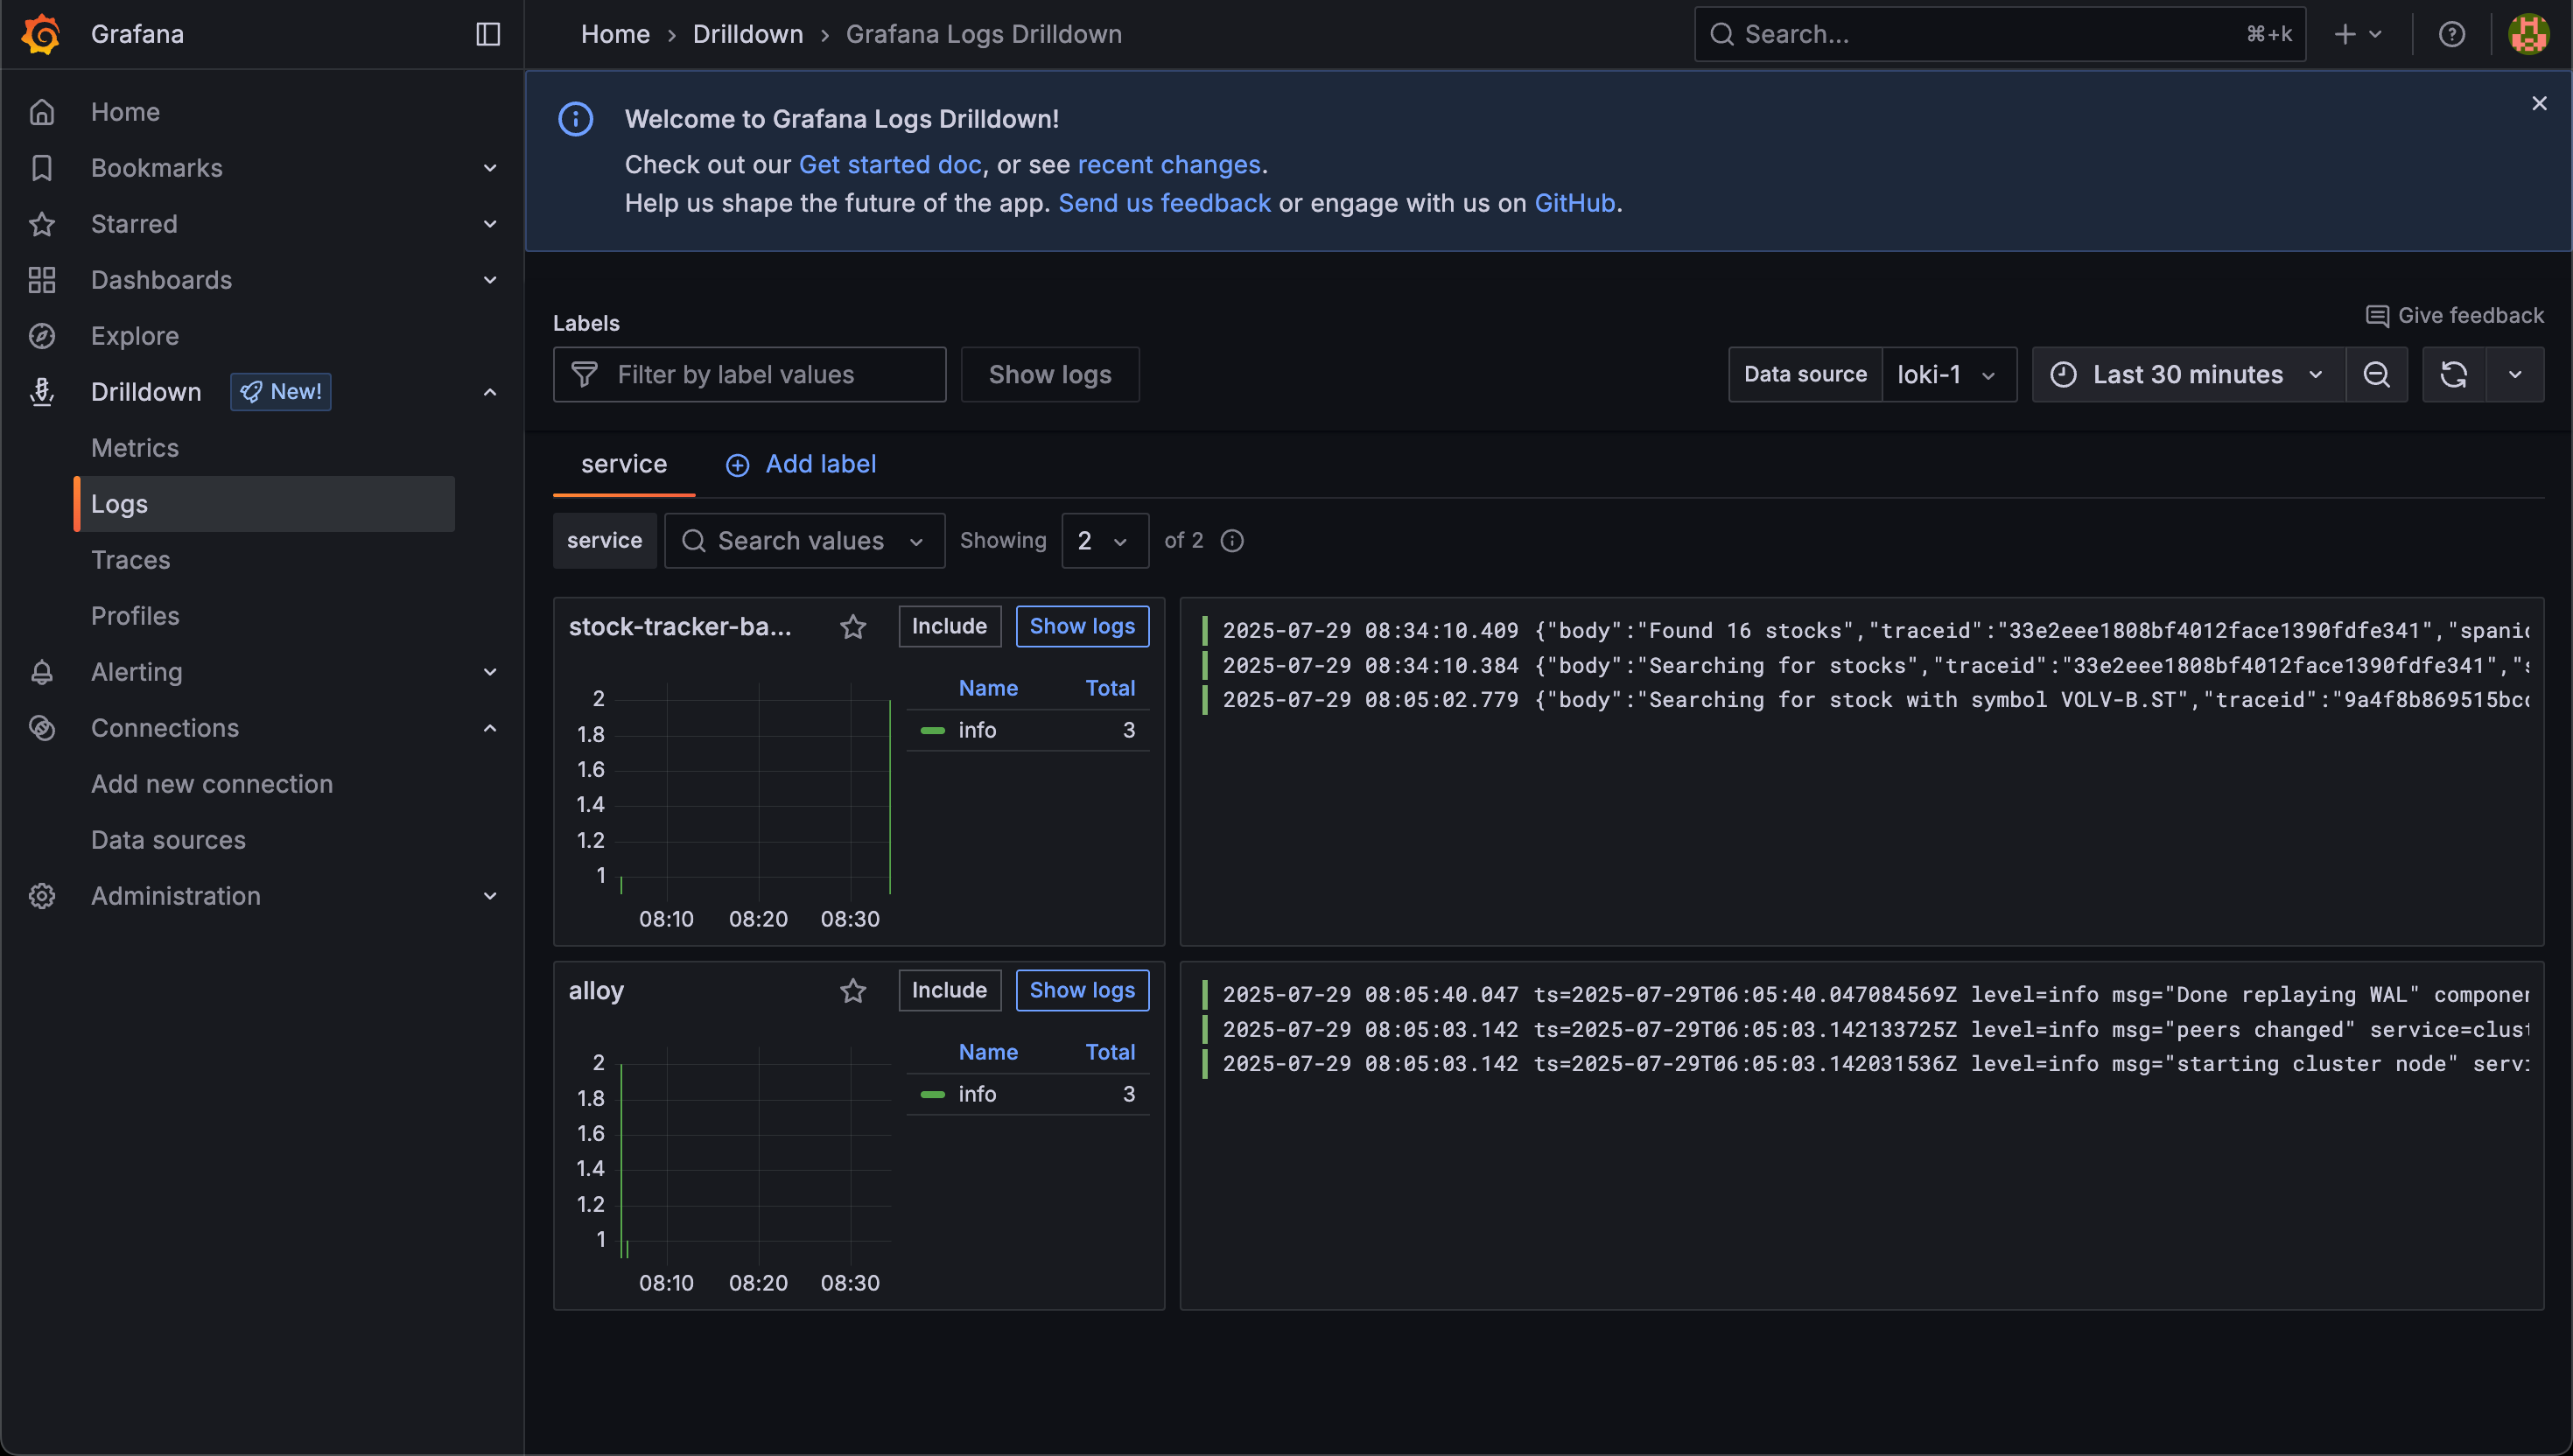
The logs has a few different fields as we can see. The service_name and service_namespace has been promoted to Loki labels whereas the service_version is left as one of the resource attributes.
Traces to Logs
Now, the final feature we'll take a look at is the Traces to Logs
This feature will let us navigate from a span in a trace to a connected logline
To enable it we'll modify our Tempo datasource in Grafana and point the "Trace to logs" to the Loki datasource
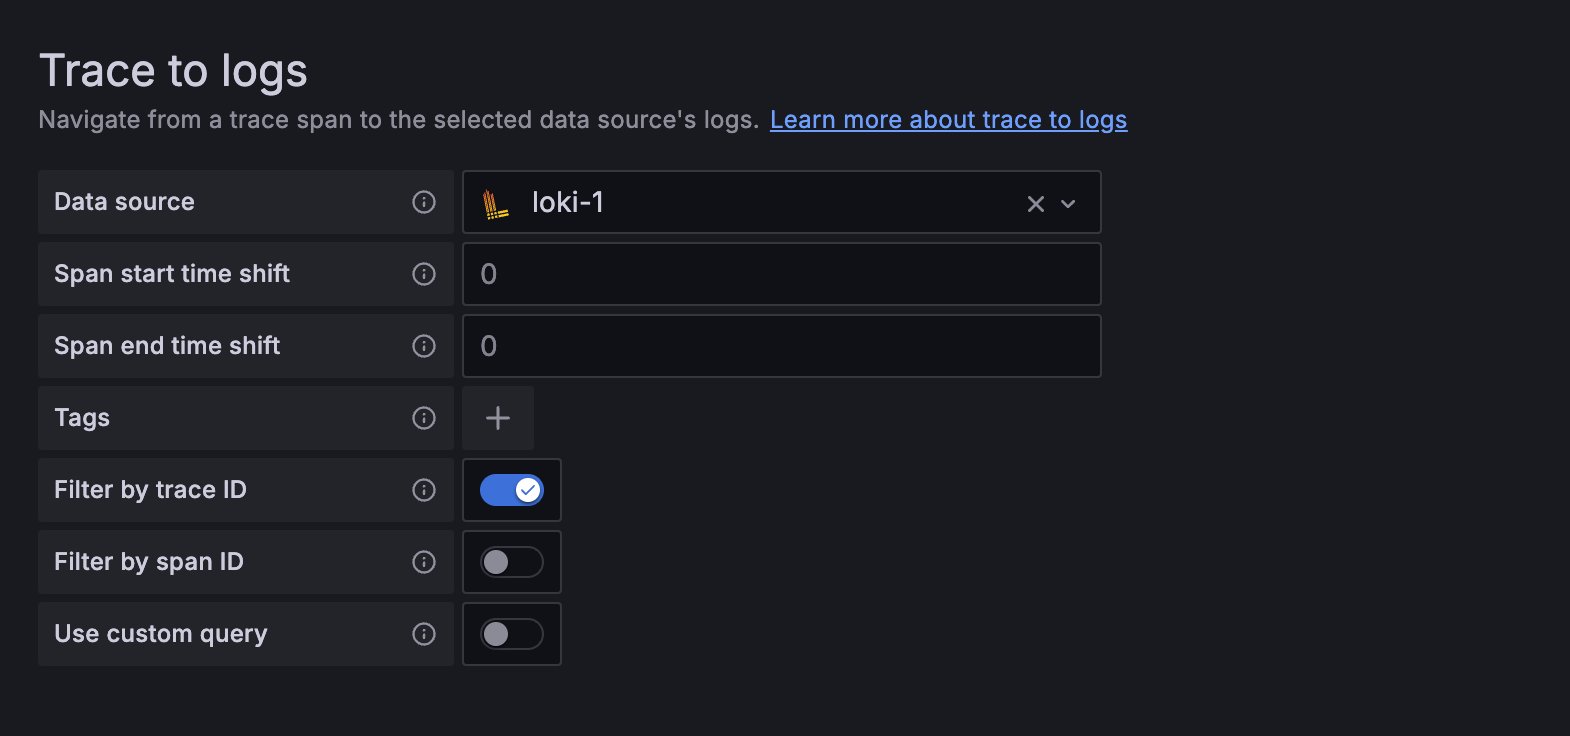
In the configuration there's a possibility to use different tags and do custom queries, we'll leave that for now and just go with the defaults.
With this in place we get an icon on a Span and if we click this we get a split view in the Explore UI with the corresponding logs from Loki
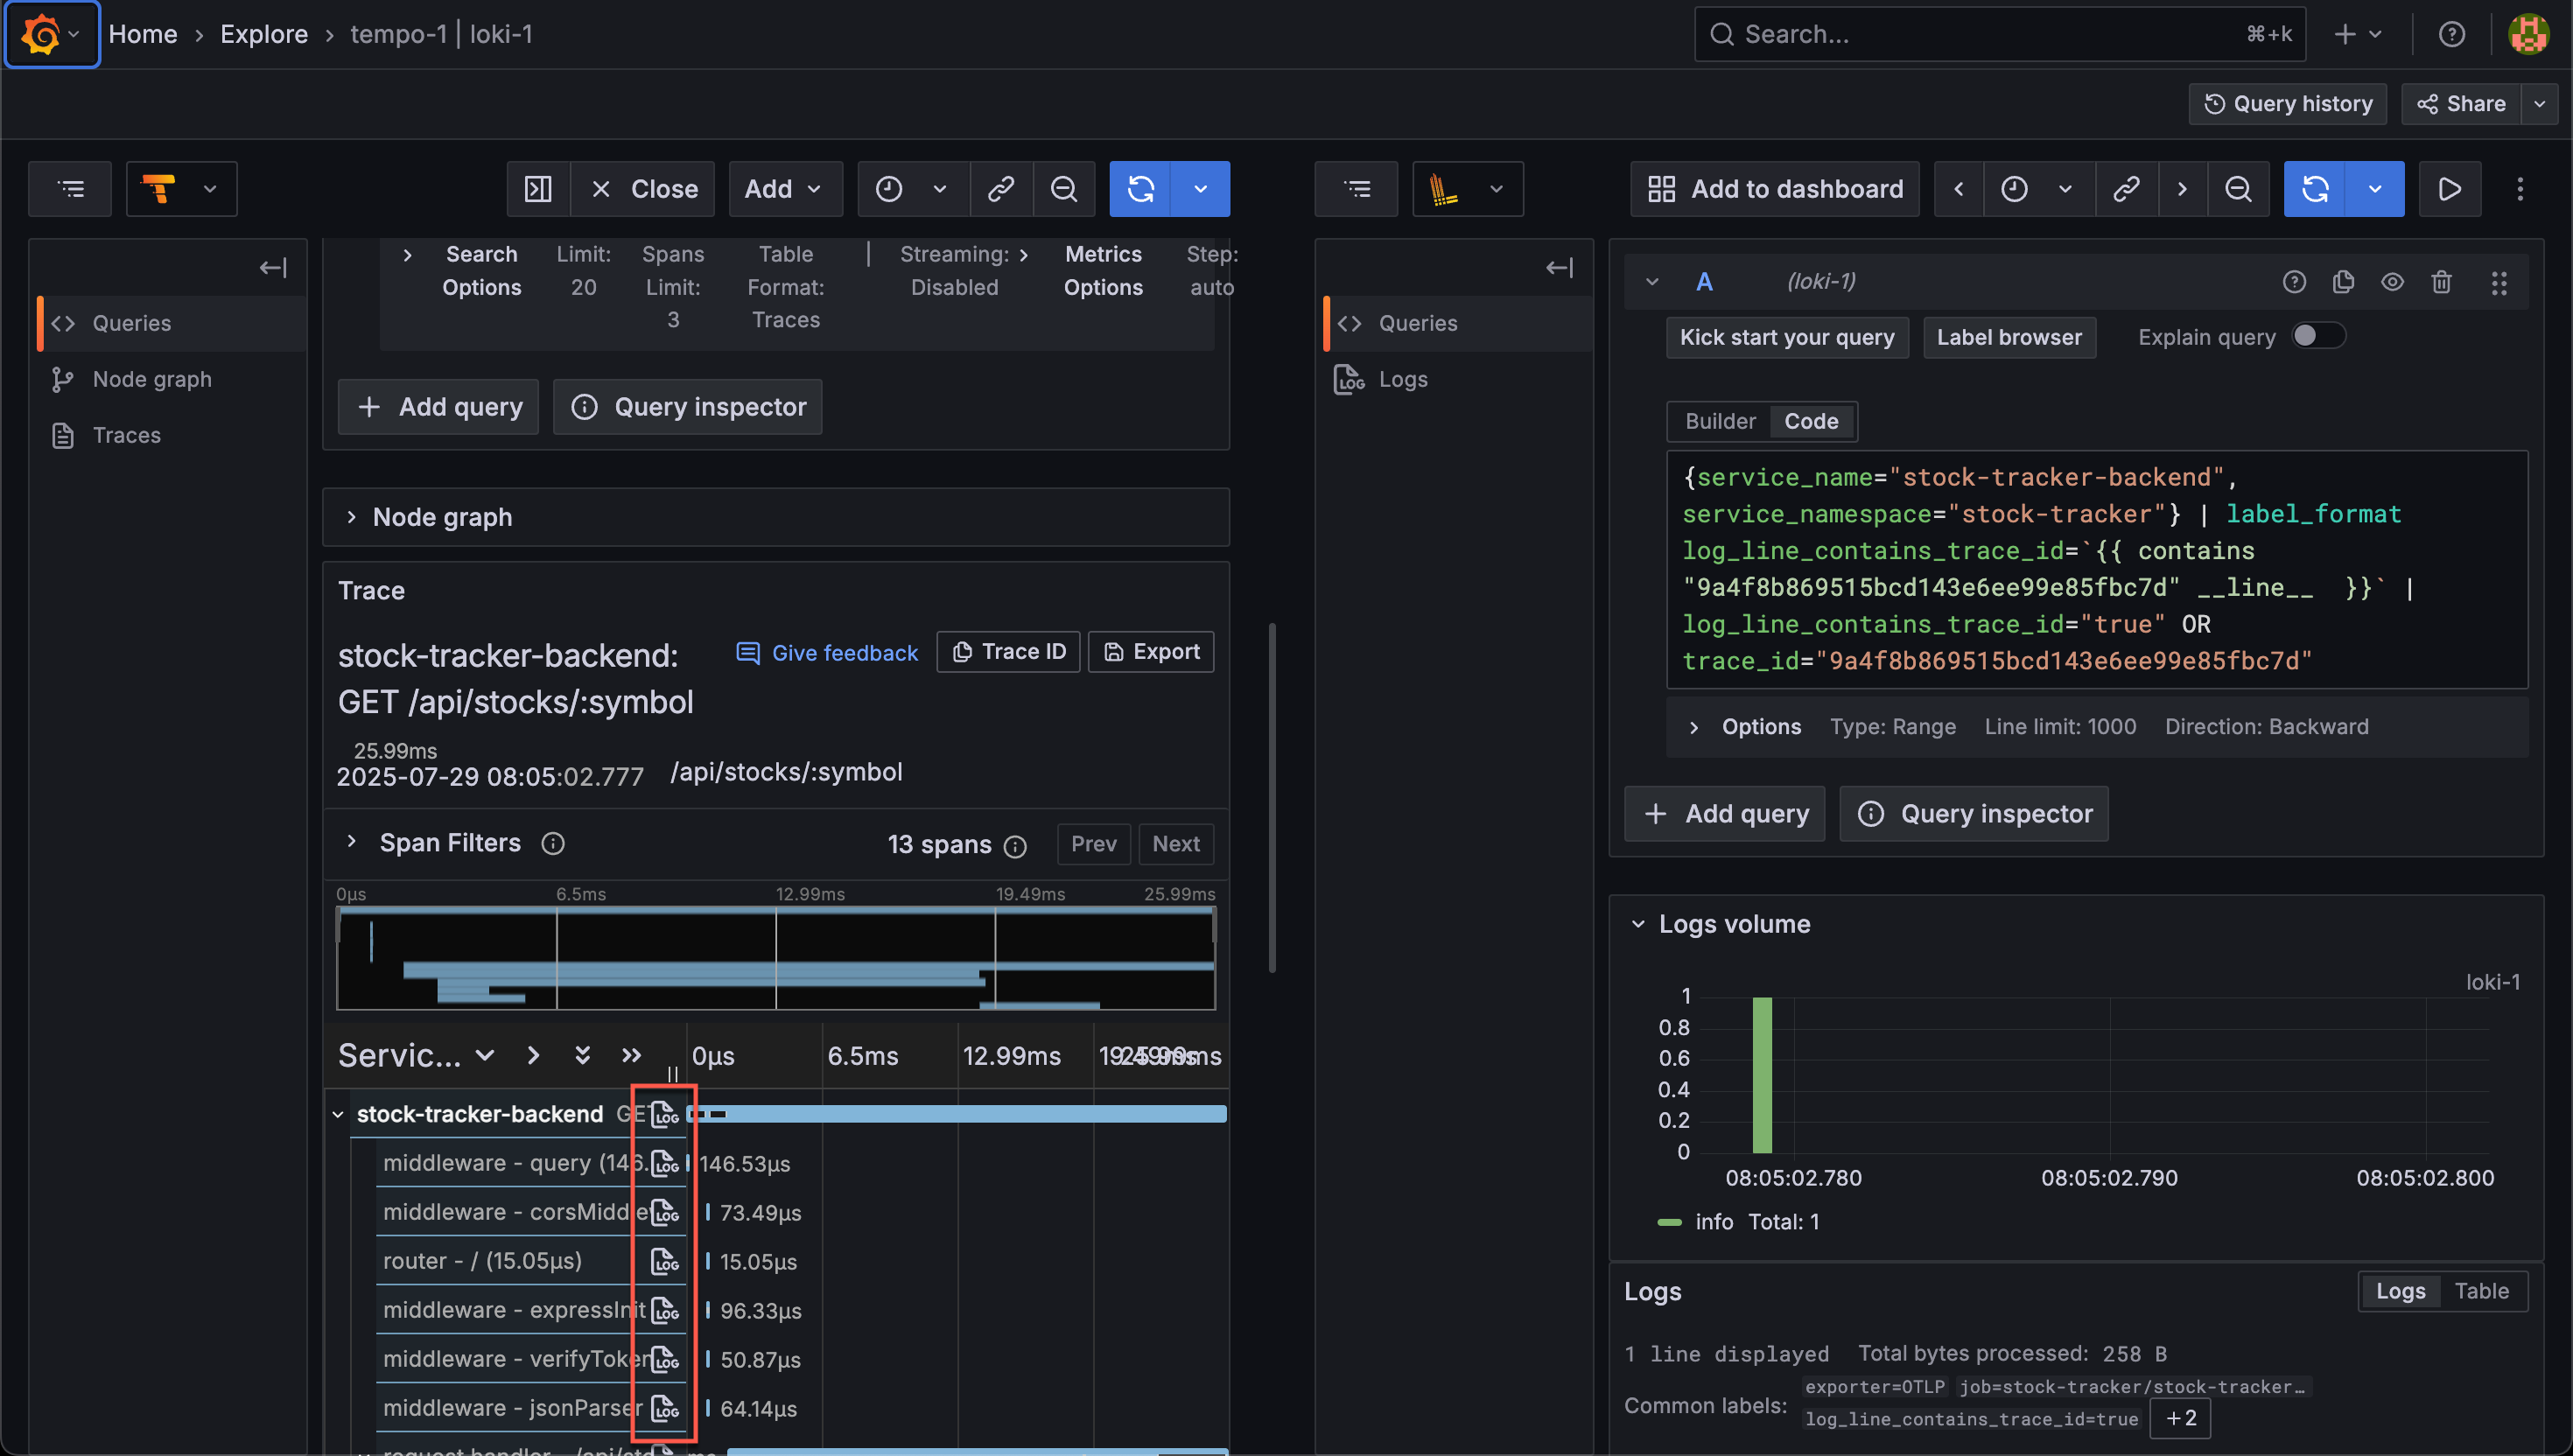
Since Loki doesn't have a trace_id label at this point we'll also match on lines containing the id in the message.
Traces to Metrics
Grafana also has the ability to link between a trace/span and a metric, but that's a feature for a later post.
Application code and variables
This post has included several code snippets and examples. The application code is not available on Github, but to summarize the configuration and code used the following Gists are available
The app is run with the following Environment variables. Note that there are some duplicates here (i.e, version and namespace), but this has been done to keep the more default / well-known attributes / variables from my custom ones.
| Key | Value |
|---|---|
| OTLP_METRIC_EXPORTER_URL | <URL_TO_ALLOY_METRICS_COLLECTOR> |
| OTLP_TRACE_EXPORTER_URL | <URL_TO_ALLOY_TRACE_COLLECTOR> |
| OTEL_SERVICE_NAME | <APP_NAME> |
| OTEL_RESOURCE_ATTRIBUTES | service.version=VERSION,environment=production,service.namespace=NAMESPACE |
| APP_VERSION | <APP_VERSION> |
| APP_NAMESPACE | <APP_NAMESPACE> |
Summary
In this rather lengthy post we've seen how to instrumenting an application with the OpenTelemetry SDK to send signals from our application to different observability backends. Our app is connected to a collector, Grafana Alloy, which processes and forwards the signals from the application to metric, tracing and logging backends respectively.
We've also seen how to start visualizing these signals with Grafana, and we've seen some of the links we can do between them.
Although there's a lot going on in this post most of it is more stitching default stuff together, like the autoinstrumentation of metrics and traces and the Alloy components. There's lots of powerful features in these components that can do amazing stuff for the observability of your applications and infrastructure.
Please feel free to reach out if you have any questions or comments. Thanks for reading!