Installing Grafana Loki
In this post we'll take a quick look at Grafana Loki and how to install it's OSS version on a virtual machine. Loki is Grafana Labs backend for logs from infrastructure components and applications. It is a part of the Grafana LGTM stack and together with the other components of the stack it delivers a full observability platform for your apps and infrastructure.
The purpose of this mini-series is to explore and show how things fit together. It's not meant for setting up a production environment.
The other posts in this mini-series
What differentiates Loki from other logging platforms is that it only indexes metadata and not the full log lines. This makes the ingestion of logs much faster, the indexes tiny, the queries faster and it reduces cost. The PromQL query language available in Grafana is powerful and let's us explore the logs. With Alertmanager we can also create alerts on log data.
Install Loki
Installing Loki on Linux is easiest through the Grafana package repositories.
1sudo mkdir -p /etc/apt/keyrings/
2wget -q -O - https://apt.grafana.com/gpg.key | gpg --dearmor | sudo tee /etc/apt/keyrings/grafana.gpg > /dev/null
3echo "deb [signed-by=/etc/apt/keyrings/grafana.gpg] https://apt.grafana.com stable main" | sudo tee /etc/apt/sources.list.d/grafana.list
4sudo apt-get update
5sudo apt-get install loki
In this post and the mini-series we'll focus on the OSS versions of the components installed on Linux. Grafana also has a cloud offering that's really neat if you quickly want to get up and running. It's free version would fit a lot of smaller use-cases supporting 10k metrics, 50GB of logs and traces, 14 days retention and more. See more in the pricing plans
Configure
With Loki installed we can go ahead and take a look at the config. We'll go with the defaults provided by the installer, but we'll have to make a few changes from what's provided by the installer since we might get this warning on the service

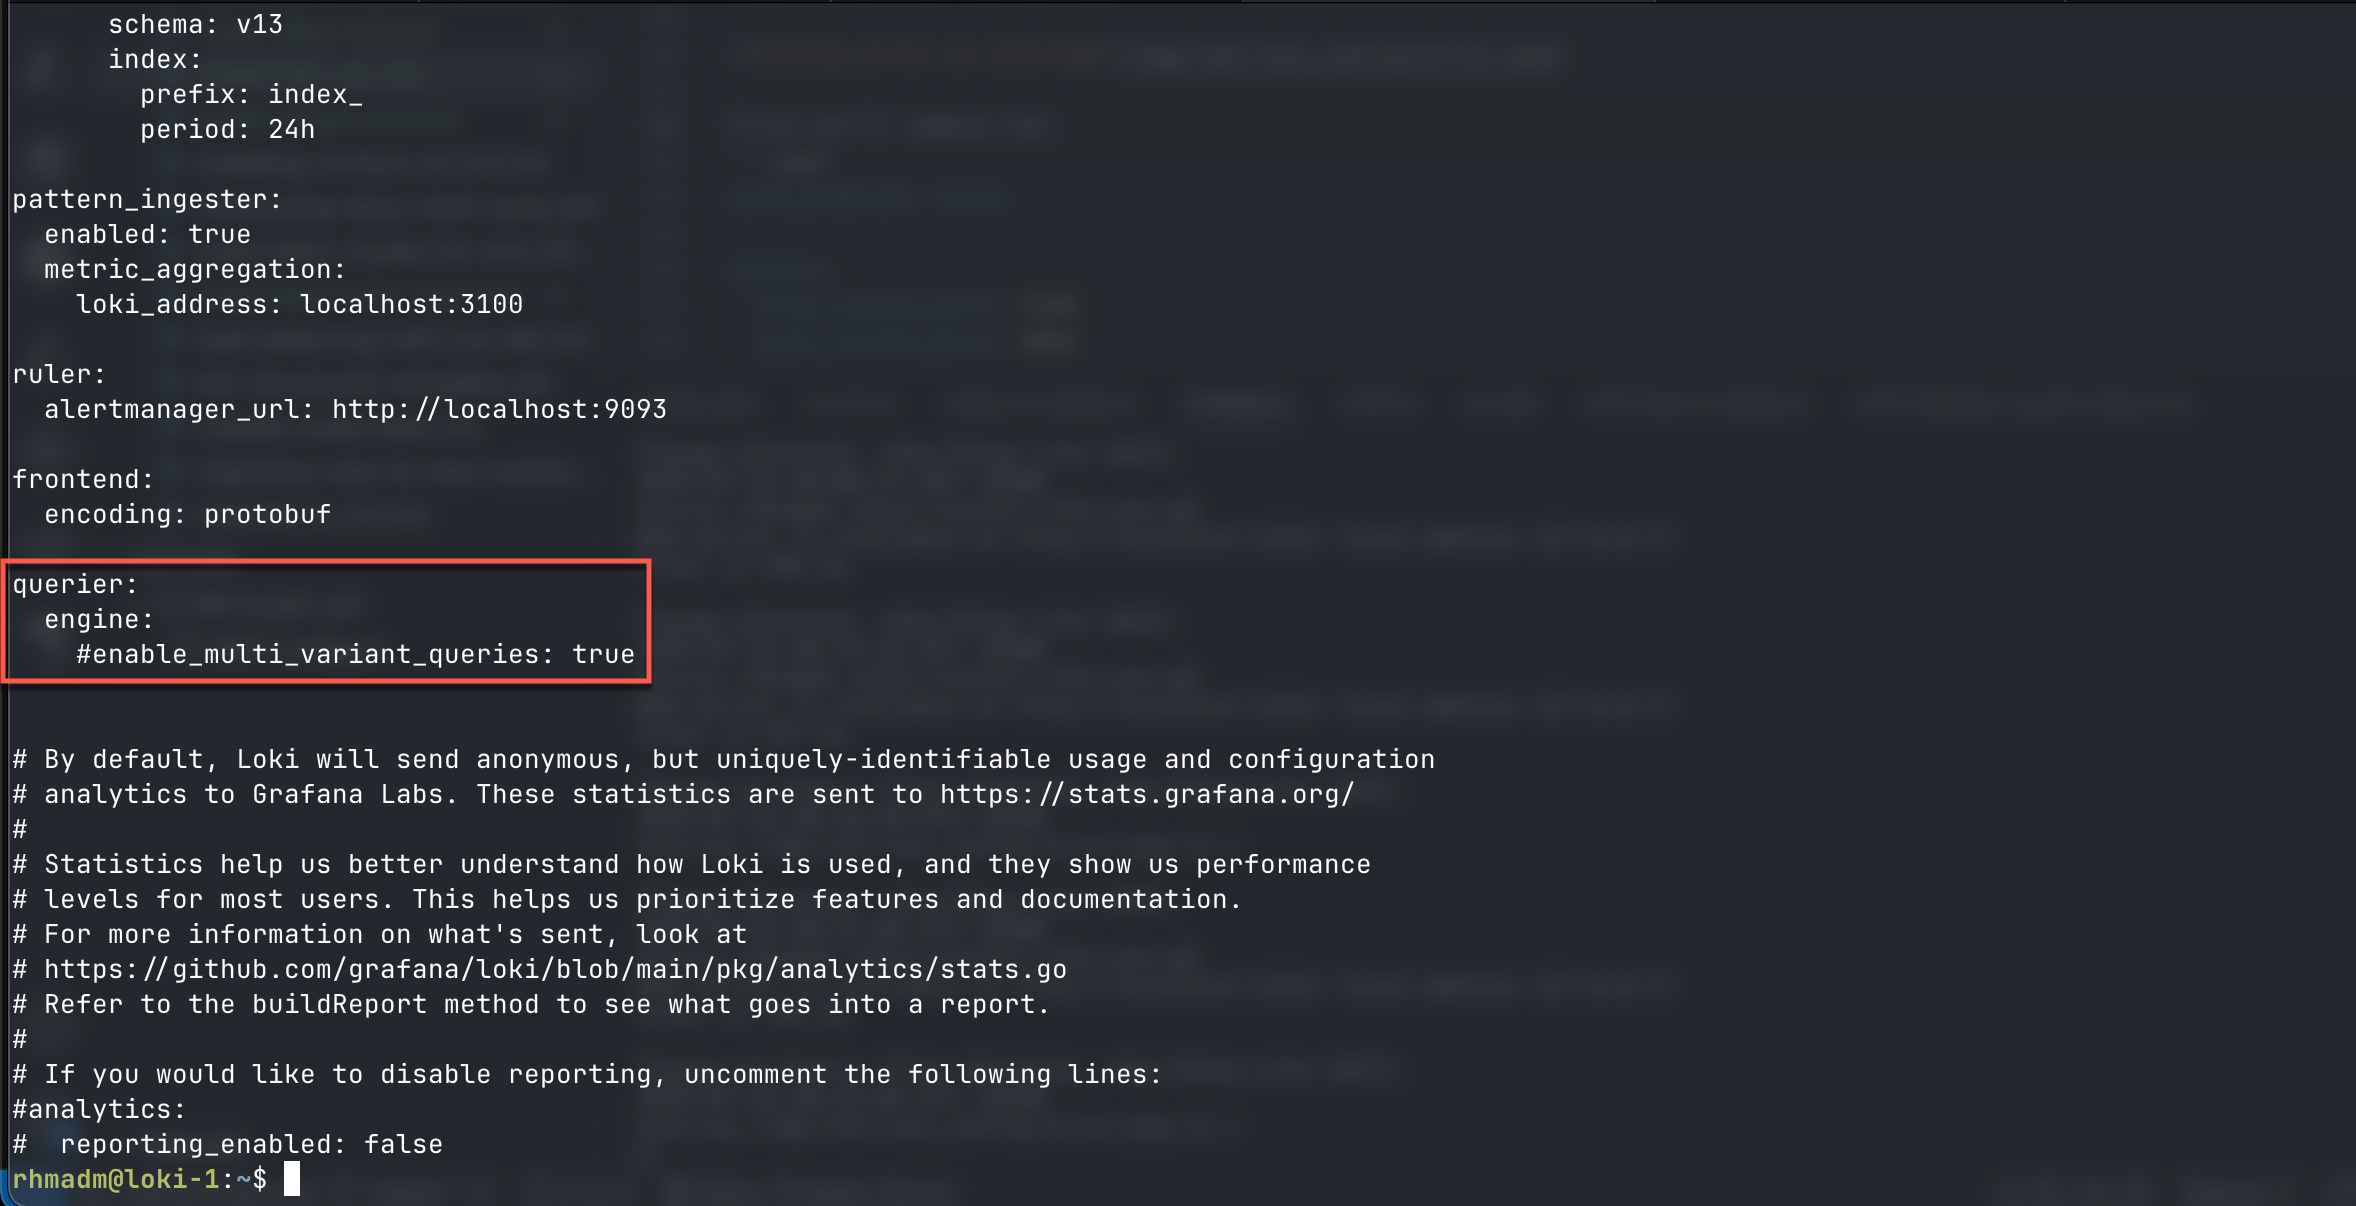
First we'll remove the enable_multi_variant_queries option in the querier: part of the config.yml file and move it under limits_config
 1auth_enabled: false
 2
 3server:
 4  http_listen_port: 3100
 5  grpc_listen_port: 9096
 6  log_level: debug
 7  grpc_server_max_concurrent_streams: 1000
 8
 9common:
10  instance_addr: 127.0.0.1
11  path_prefix: /tmp/loki
12  storage:
13    filesystem:
14      chunks_directory: /tmp/loki/chunks
15      rules_directory: /tmp/loki/rules
16  replication_factor: 1
17  ring:
18    kvstore:
19      store: inmemory
20
21query_range:
22  results_cache:
23    cache:
24      embedded_cache:
25        enabled: true
26        max_size_mb: 100
27
28limits_config:
29  metric_aggregation_enabled: true
30  enable_multi_variant_queries: true
31
32schema_config:
33  configs:
34    - from: 2020-10-24
35      store: tsdb
36      object_store: filesystem
37      schema: v13
38      index:
39        prefix: index_
40        period: 24h
41
42pattern_ingester:
43  enabled: true
44  metric_aggregation:
45    loki_address: localhost:3100
46
47ruler:
48  alertmanager_url: http://localhost:9093
49
50frontend:
51  encoding: protobuf
52
53querier:
54  engine:
55    #enable_multi_variant_queries: true
56
57analytics:
58  reporting_enabled: false
There's an issue posted on this on the Loki Github repo
The enable_multi_variant_queries option is an experimental feature and we could omit it altogether
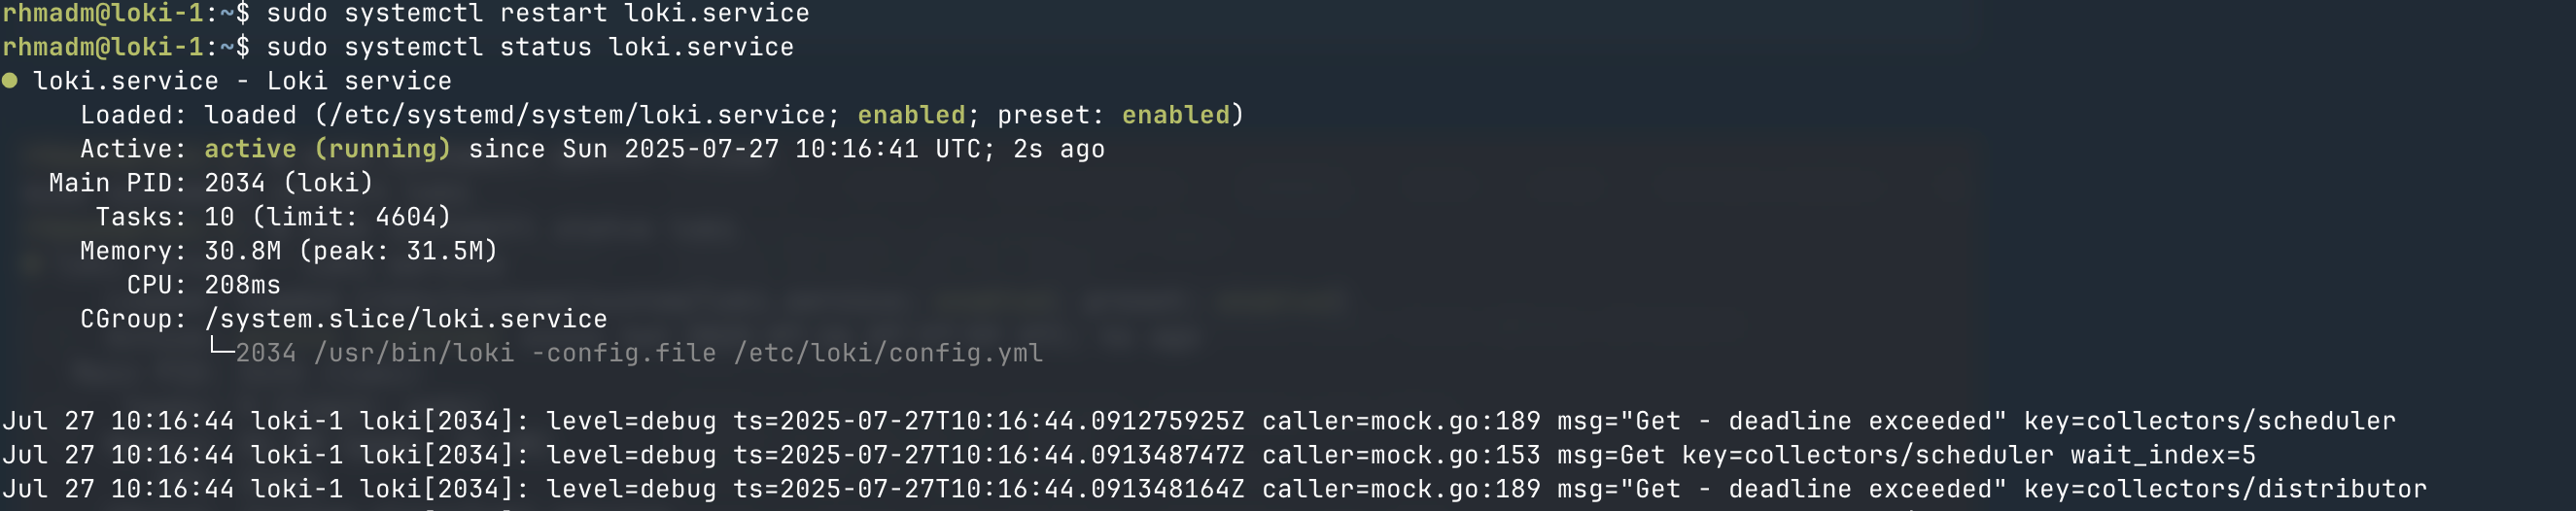
And now we can go ahead and restart Loki
1sudo systemctl restart loki
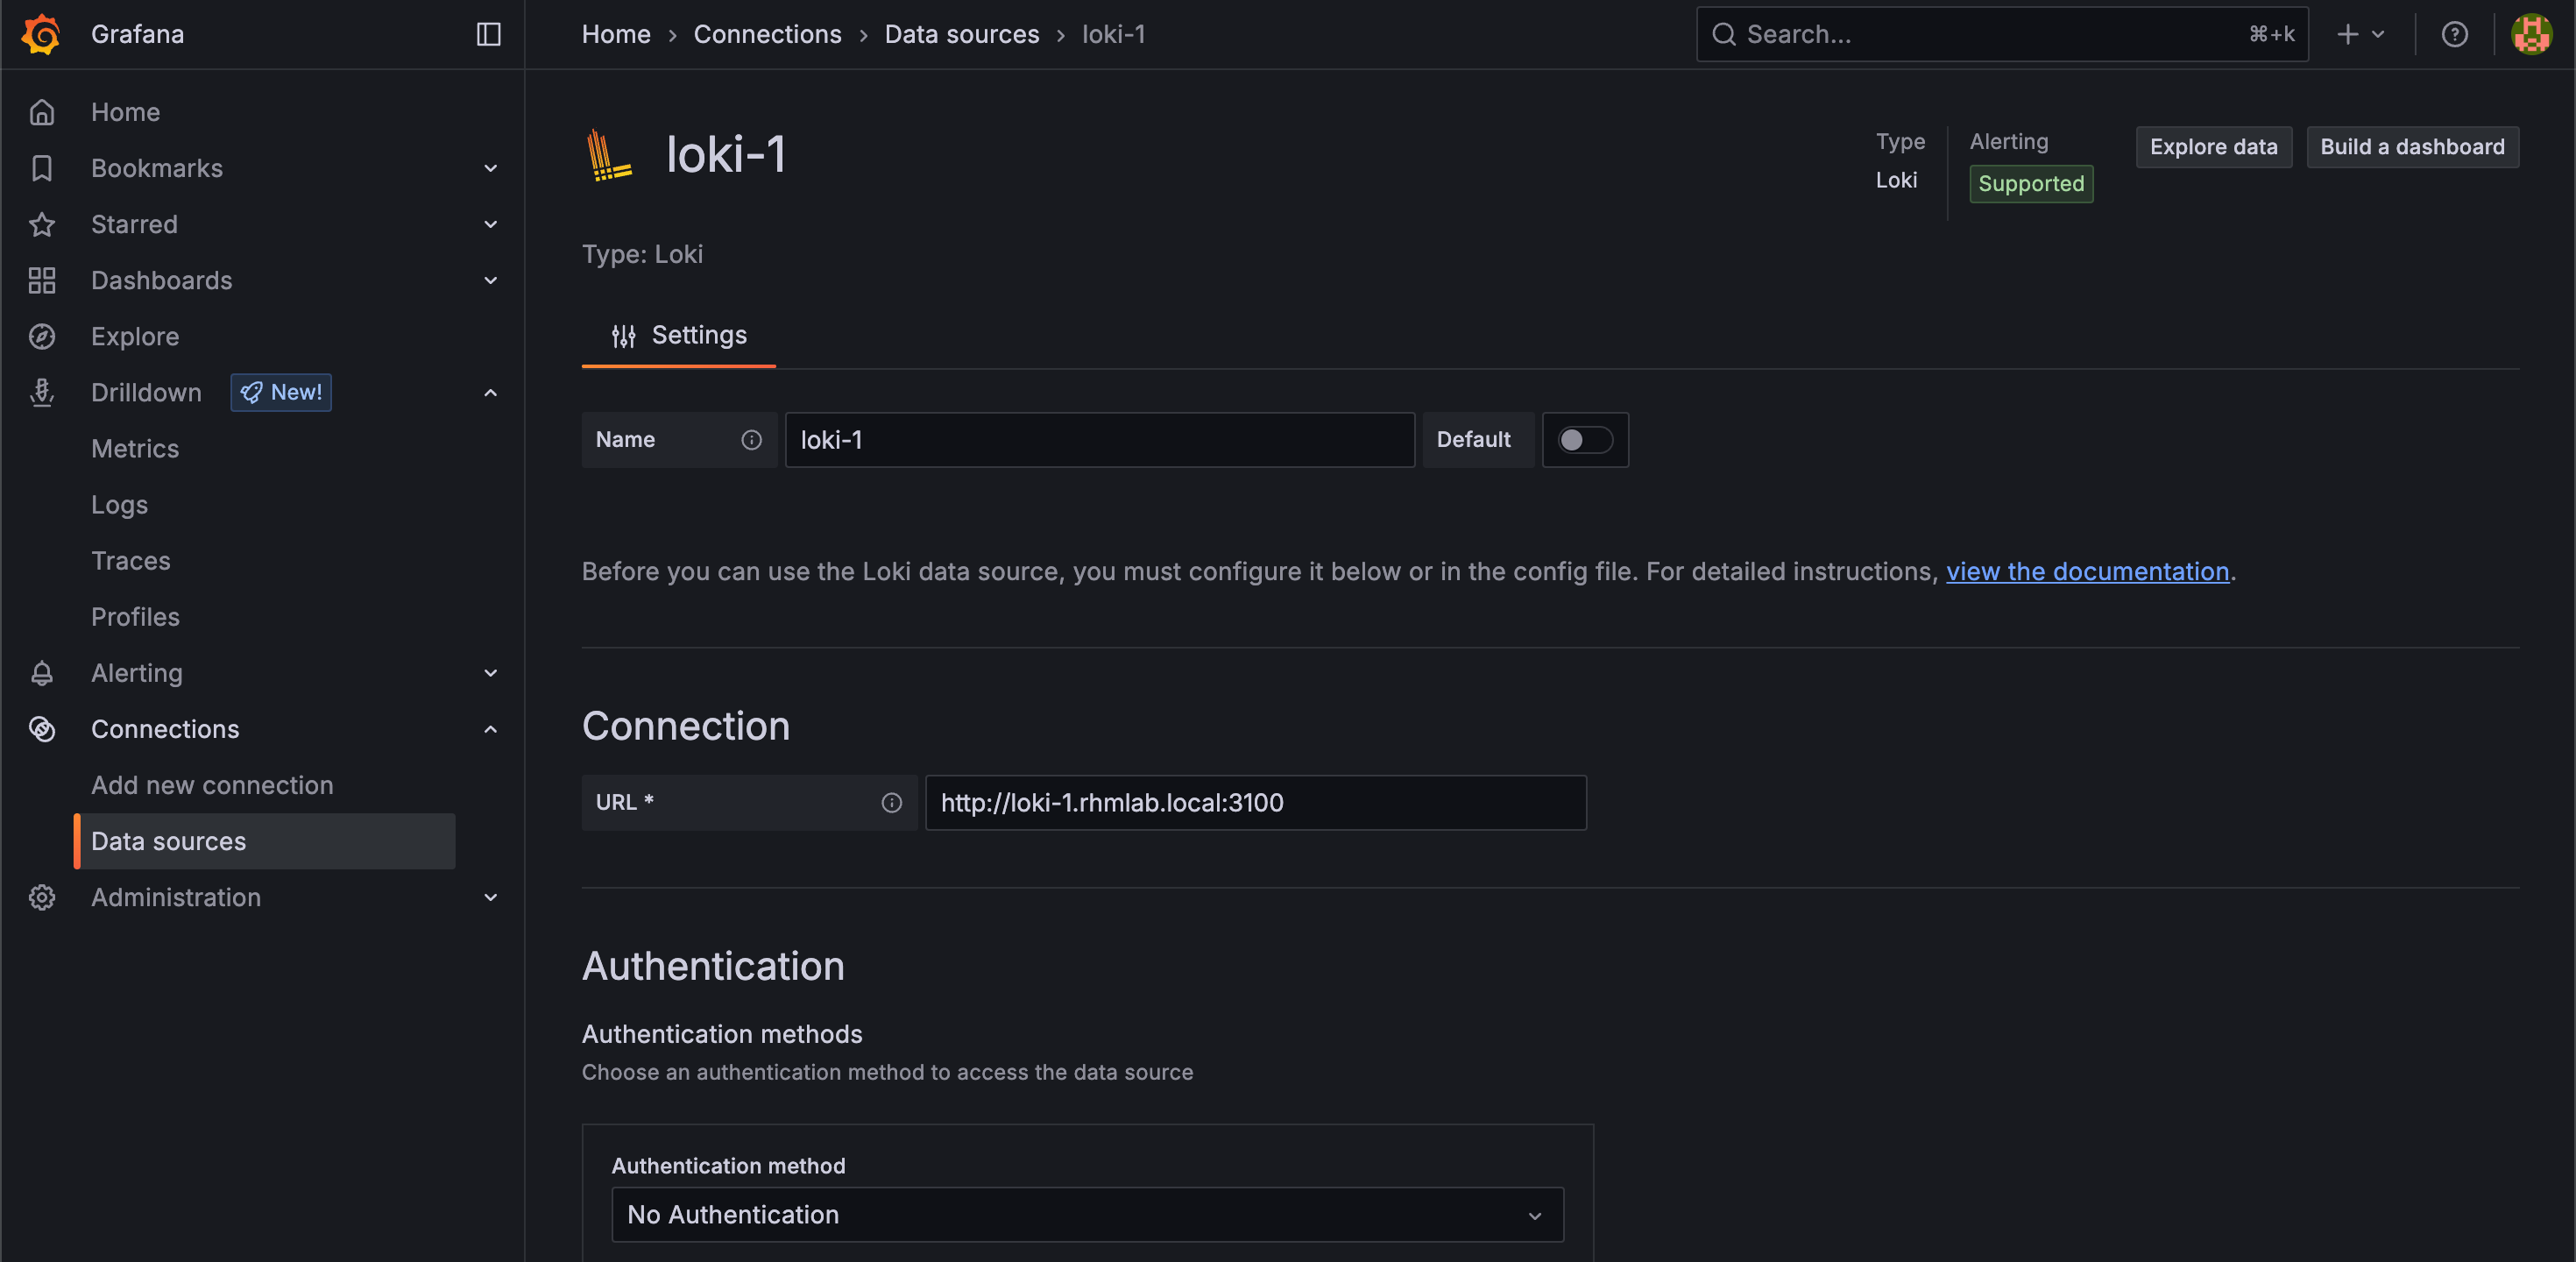
Integrate with Grafana
Now, for visualizing and searching the logs we'll integrate Loki with Grafana. So we'll go ahead and create a datasource in Grafana
At this point there's no logs available, but we'll soon enough have some logs written to Loki by Grafana Alloy