Installing Grafana Alloy
In this post, which is part of a mini-series on the Grafana LGTM stack, we'll take a look at Grafana Alloy.
Grafana Alloy is an open-source OpenTelemetry collector. It supports both metrics, logs, traces and profiles and can natively ingest those in backends like Prometheus, OpenTelemetry, Mimir, Loki and Tempo. We'll explore this in this mini-series.
The purpose of this mini-series is to explore and show how things fit together. It's not meant for setting up a production environment.
The other posts in this mini-series
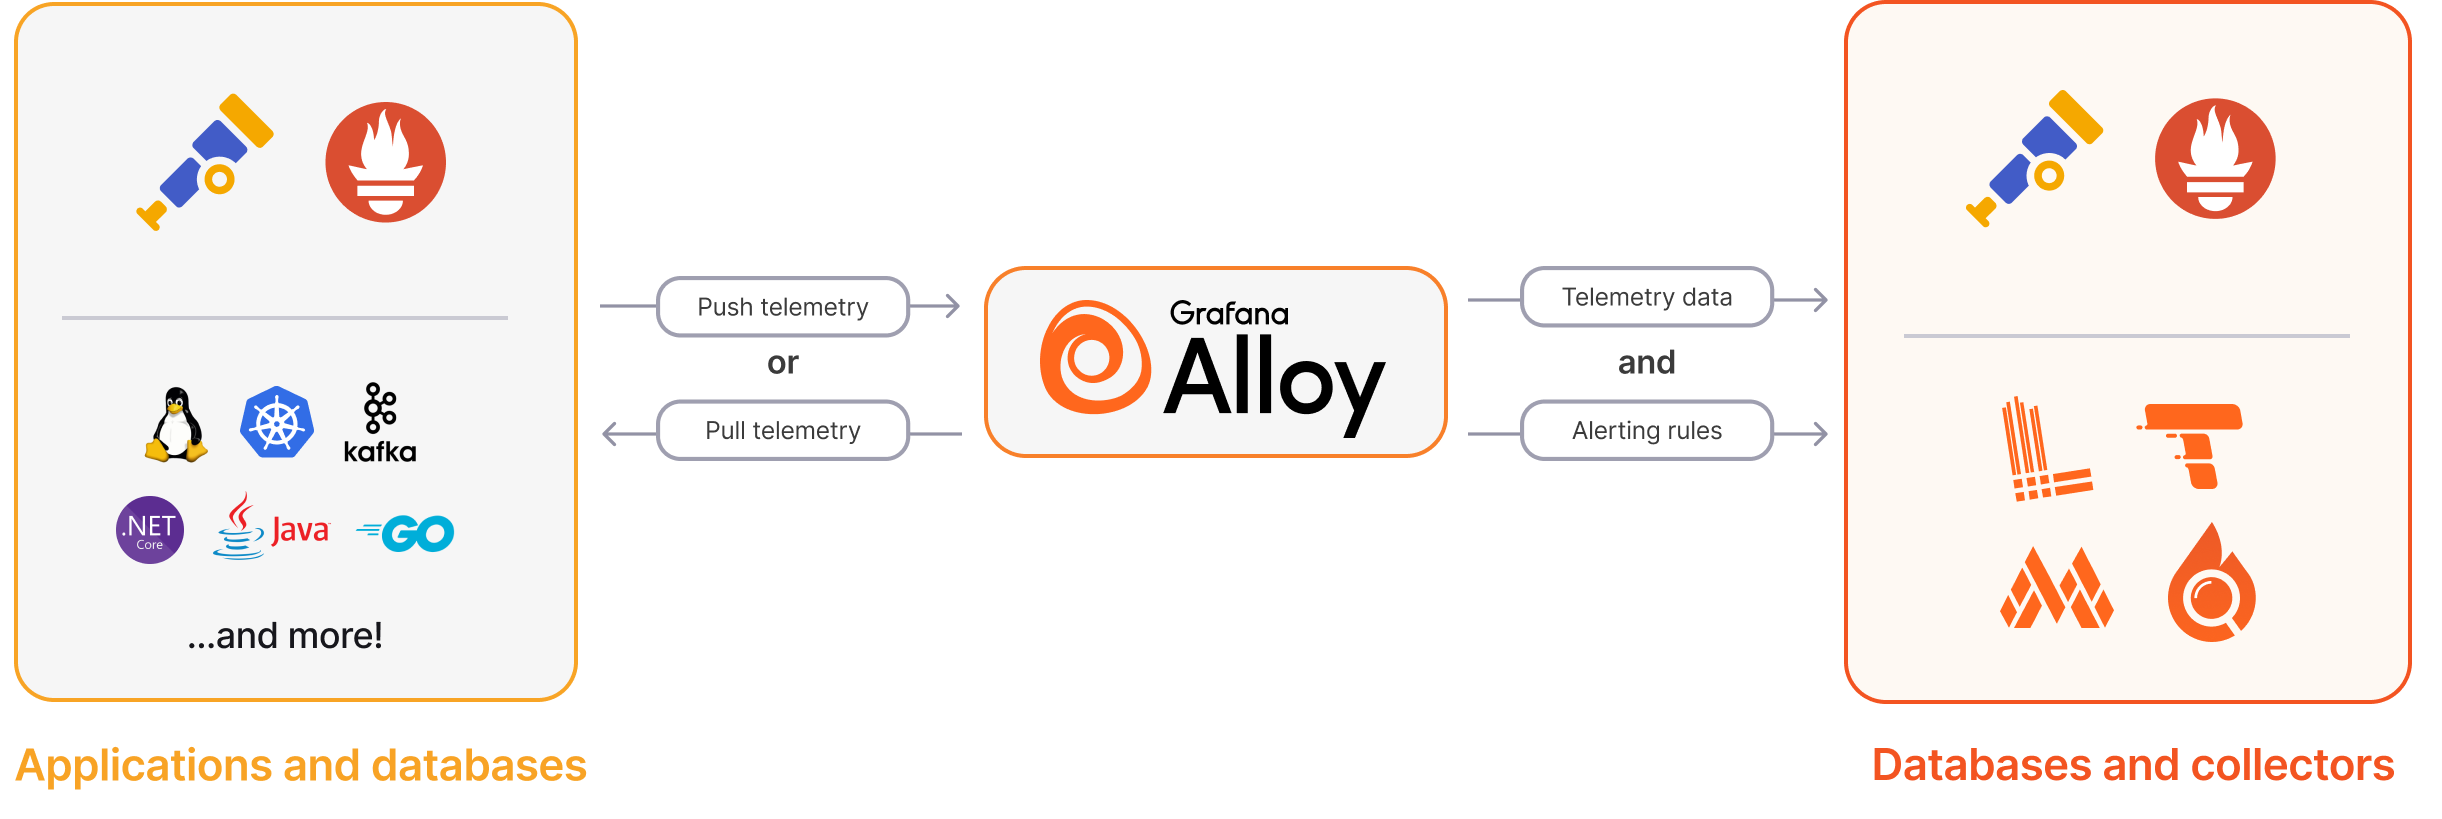
As the diagram borrowed from grafana.com shows, Alloy can sit between your infrastructure, apps and databases and pull or receive telemetry data which it can process and transform and finally write to OpenTelemetry compatible databases or collectors and the Grafana LGTM stack.
Alloy is a light-weight collector which is the successor of the Grafana Agent which soon will reach EOL
In this post and the mini-series we'll focus on the OSS versions of the components installed on Linux. Grafana also has a cloud offering that's really neat if you quickly want to get up and running. It's free version would fit a lot of smaller use-cases supporting 10k metrics, 50GB of logs and traces, 14 days retention and more. See more in the pricing plans
Before diving in, let's quickly also mention that there's a few options for OpenTelemetry and collectors. What Grafana Alloy promises is that it "combines all the observability signals that are vital to run combined infrastructure and application monitoring workloads at scale"
So, if you're searching for an OpenTelemetry collector there's others out there as well, but in my case I have several parts of the Grafana LGTM stack installed already, and I like that I can use Alloy both for collecting metrics, forward logs and traces.
When looking at OpenTelemetry and integrating applications one could technically send OpenTelemetry data directly to backends, but a collector (or multiple) is recommended to offload things like retries, filtering etc from the app.
Now, with that background let's go ahead and see how we can install Alloy on a virtual machine.
Installing Grafana Alloy OSS
From the Alloy documentation we have different possibilities for installing Alloy. We can install Alloy on Docker, Kubernetes, Linux, macOS, or Windows. In our case we'll use an Ubuntu 22.04 virtual machine so we'll follow the install guide for Linux
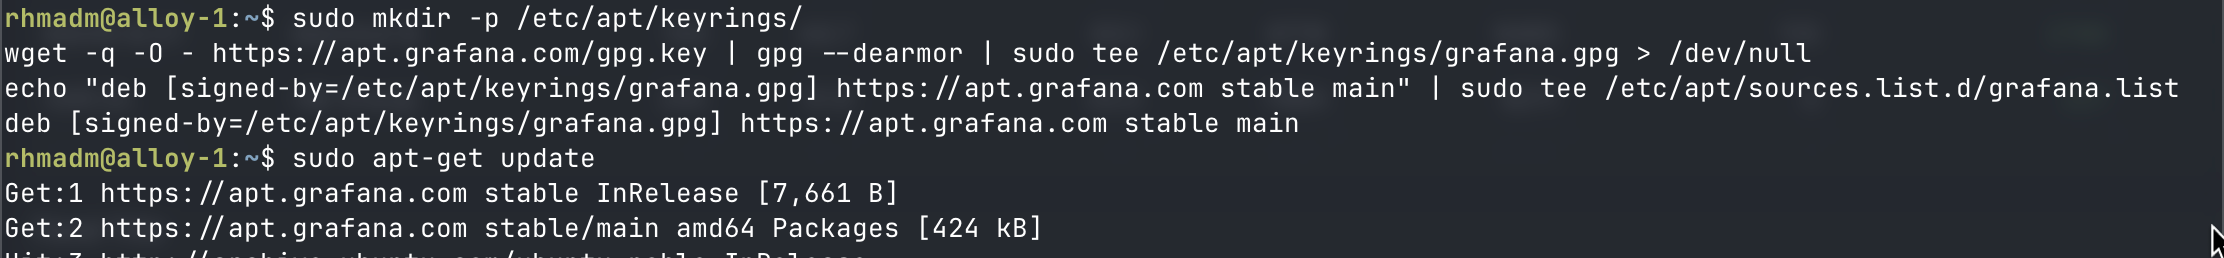
First of let's add the Grafana repository to our VM.
1sudo mkdir -p /etc/apt/keyrings/
2wget -q -O - https://apt.grafana.com/gpg.key | gpg --dearmor | sudo tee /etc/apt/keyrings/grafana.gpg > /dev/null
3echo "deb [signed-by=/etc/apt/keyrings/grafana.gpg] https://apt.grafana.com stable main" | sudo tee /etc/apt/sources.list.d/grafana.list
4sudo apt-get update
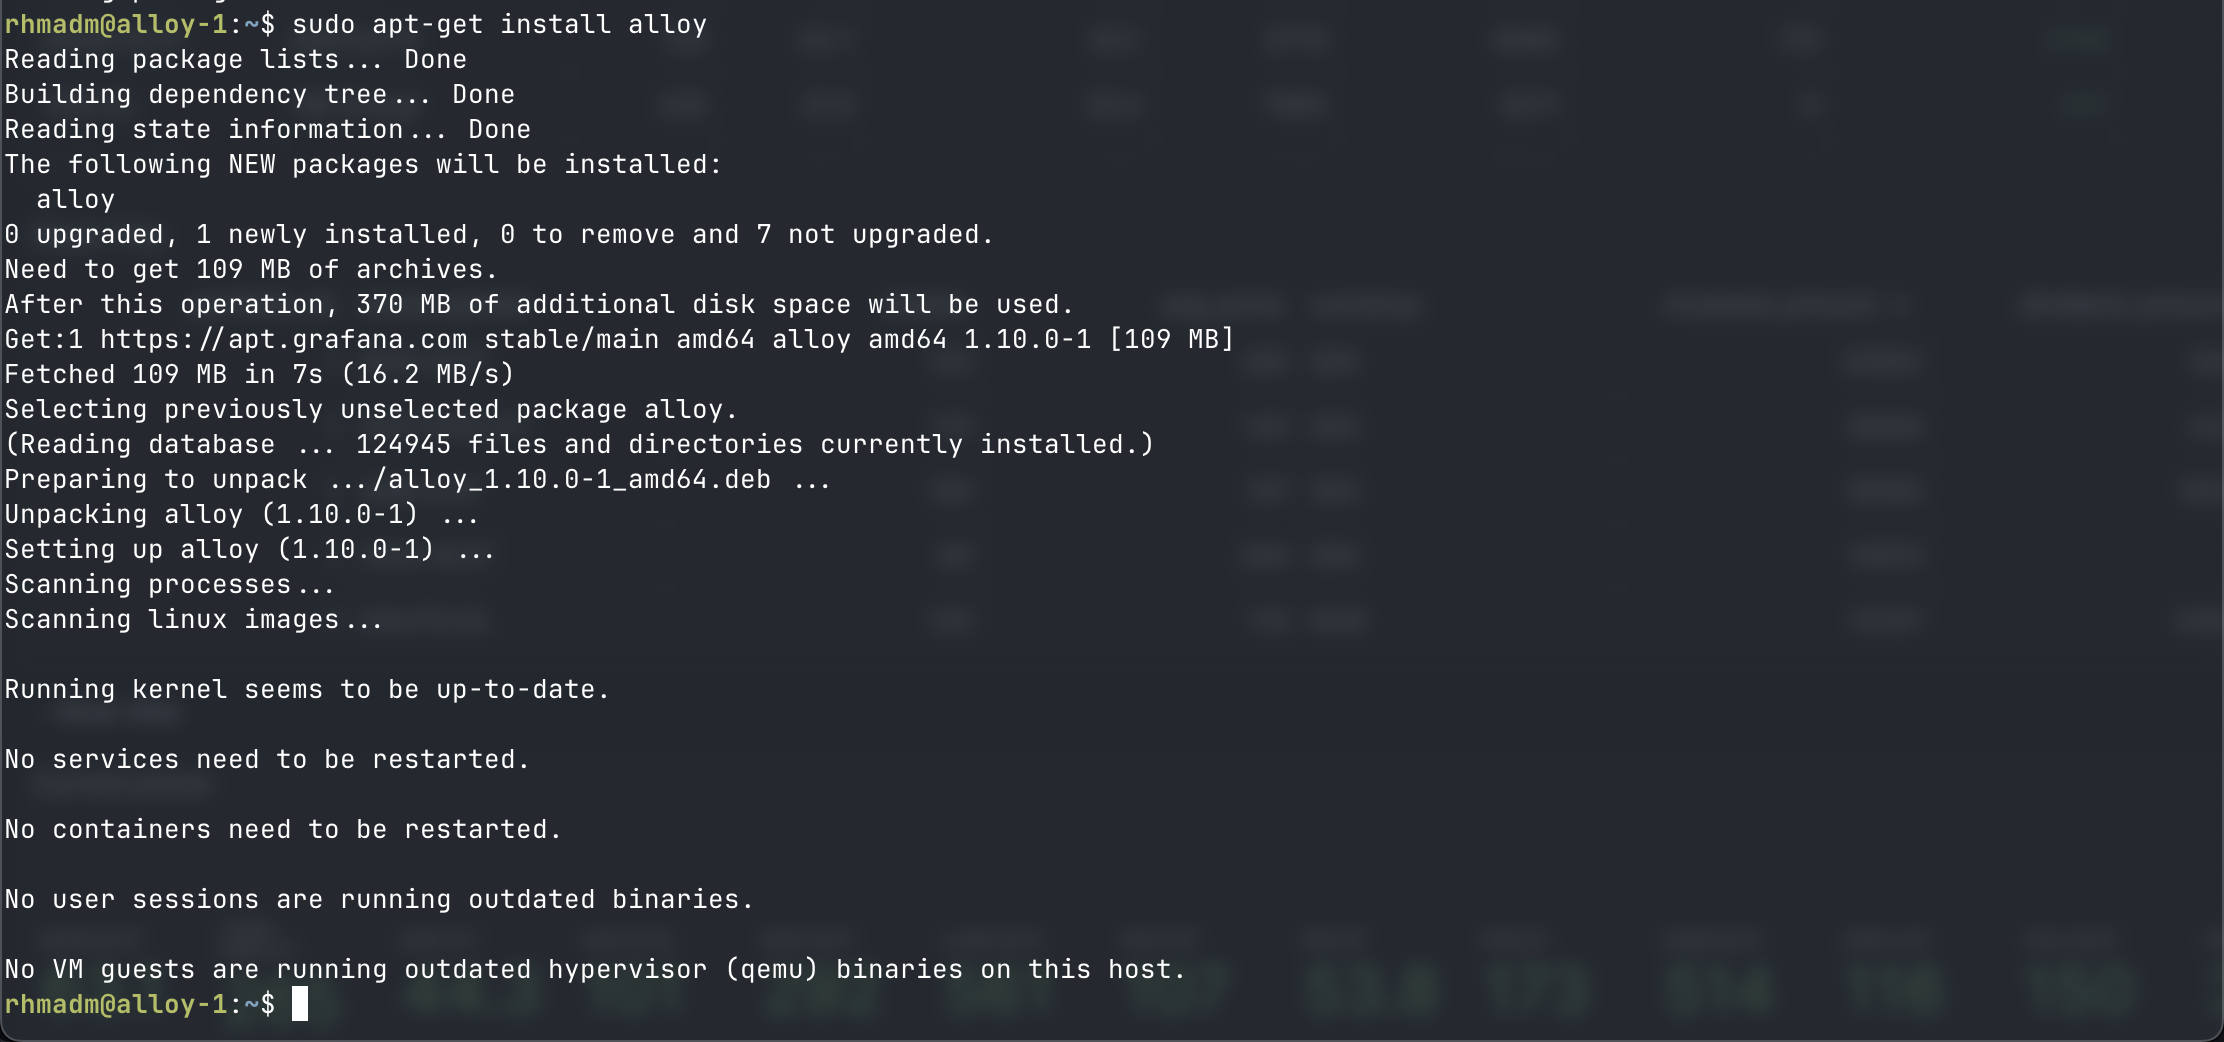
And with that in place we can go ahead and install Alloy from the package repo
1sudo apt-get install alloy
Now let's make sure to start and enable the service and ensure it's running
1sudo systemctl enable alloy.service
2sudo systemctl start alloy.service
3sudo systemctl status alloy.service
Configuration
The configuration for Alloy lies in the /etc/alloy/config.alloy file
One of the configurations we'll set right of the bat is the ability to expose the UI
https://grafana.com/docs/alloy/v1.10/configure/linux/#pass-additional-command-line-flags
For making this work we also have to pass a command line flag which is done in the /etc/default/alloy file
We'll add --server.http.listen-addr=<ip:port> to the CUSTOM_ARGS option
 1## Path:
 2## Description: Grafana Alloy settings
 3## Type:        string
 4## Default:     ""
 5## ServiceRestart: alloy
 6#
 7# Command line options for Alloy.
 8#
 9# The configuration file holding the Alloy config.
10CONFIG_FILE="/etc/alloy/config.alloy"
11
12# User-defined arguments to pass to the run command.
13CUSTOM_ARGS="--server.http.listen-addr=<IP_ADDRESS>:12345"
14
15# Restart on system upgrade. Defaults to true.
16RESTART_ON_UPGRADE=true
Now let's reload Alloy
1sudo systemctl reload alloy
And head to our browser and test the UI
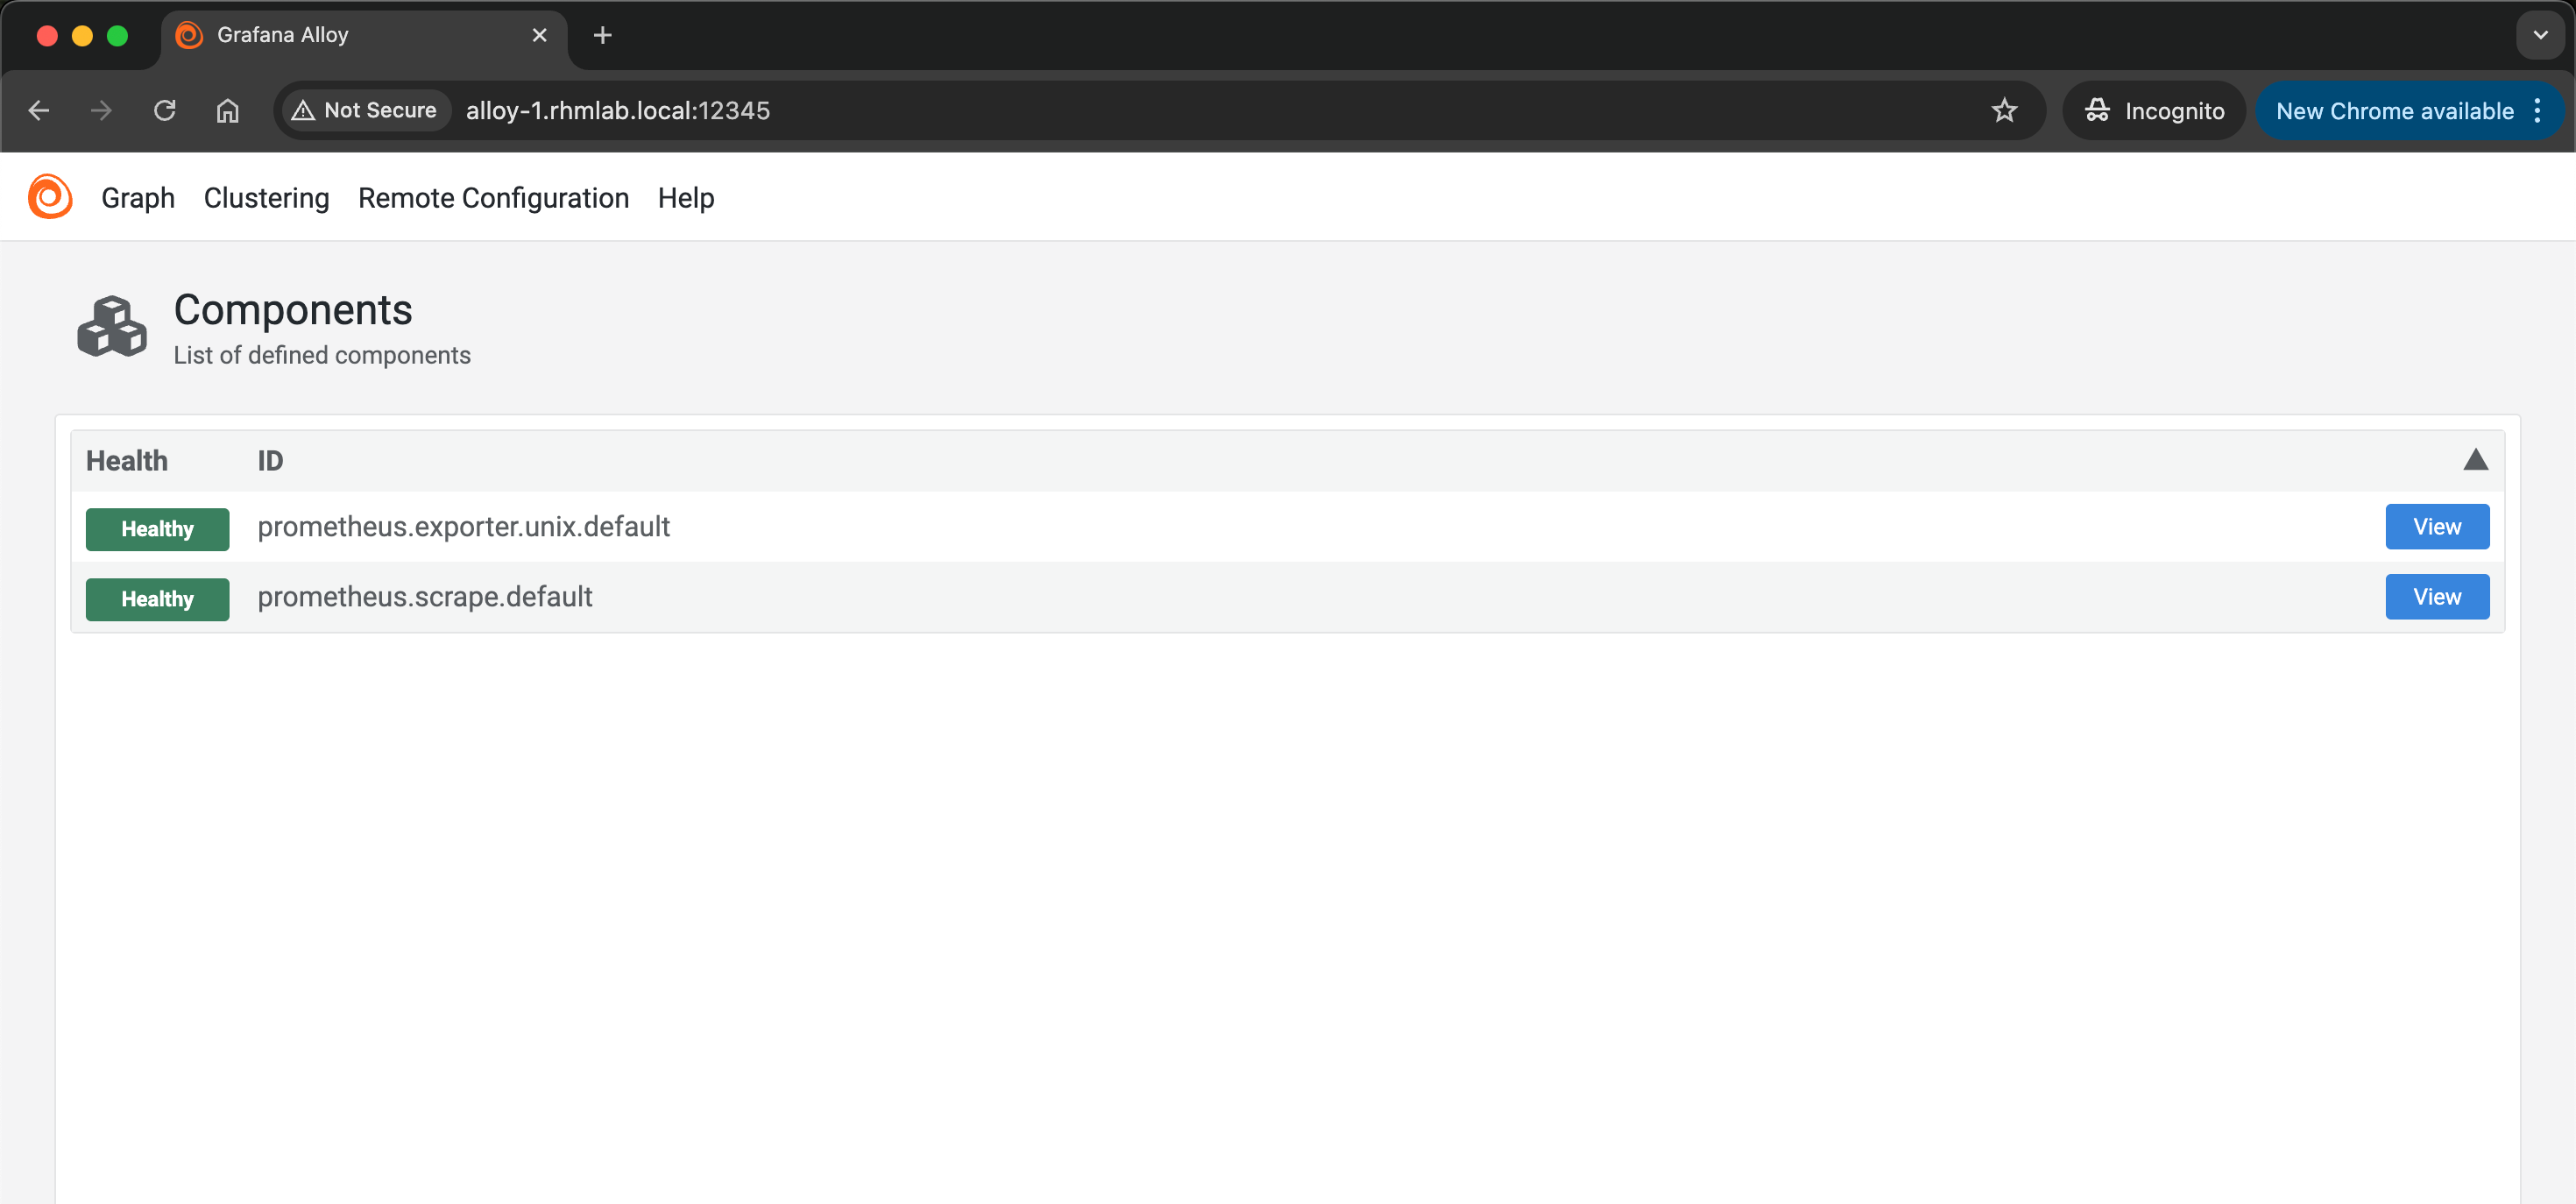
The UI is loading and it shows two configured Prometheus components.
We'll modify these a bit and add a reference to our existing Prometheus server to have it receiving metrics from Alloy.
Connect Alloy to Prometheus
Let's modify our configuration file to have Alloy writing to Prometheus.
Note that for this to work the Prometheus server needs to be configured to receive metrics through the remote_write functionality
We'll add the prometheus.exporter.self component which makes Alloy export metrics from itself.
1prometheus.exporter.self "default" {
2}
Now we'll add a a scrape config for scraping those metrics. It's named metamonitoring, but it could have been named something else. Notice that it connects to the exporter by it's name and with the targets extension, prometheus.exporter.self.default.targets. We also add the forward_to action and specify it to use a remote_write component by name, default.
1prometheus.scrape "metamonitoring" {
2  targets    = prometheus.exporter.self.default.targets
3  forward_to = [prometheus.remote_write.default.receiver]
4}
The remote_write component is specifying where to write those Prometheus metrics. This is named default but it could have been named something else. Note however that the name of the component is used in other components so these naturally needs to be updated accordingly.
1prometheus.remote_write "default" {
2  endpoint {
3    url = "http://<PROMETHEUS_SERVER>/api/v1/write"
4  }
5}
With all that in place the full configuration file at this point
 1logging {
 2  level = "warn"
 3}
 4
 5prometheus.exporter.self "default" {
 6}
 7
 8prometheus.scrape "metamonitoring" {
 9  targets    = prometheus.exporter.self.default.targets
10  forward_to = [prometheus.remote_write.default.receiver]
11}
12
13prometheus.remote_write "default" {
14  endpoint {
15    url = "http://<PROMETHEUS_SERVER>/api/v1/write"
16  }
17}
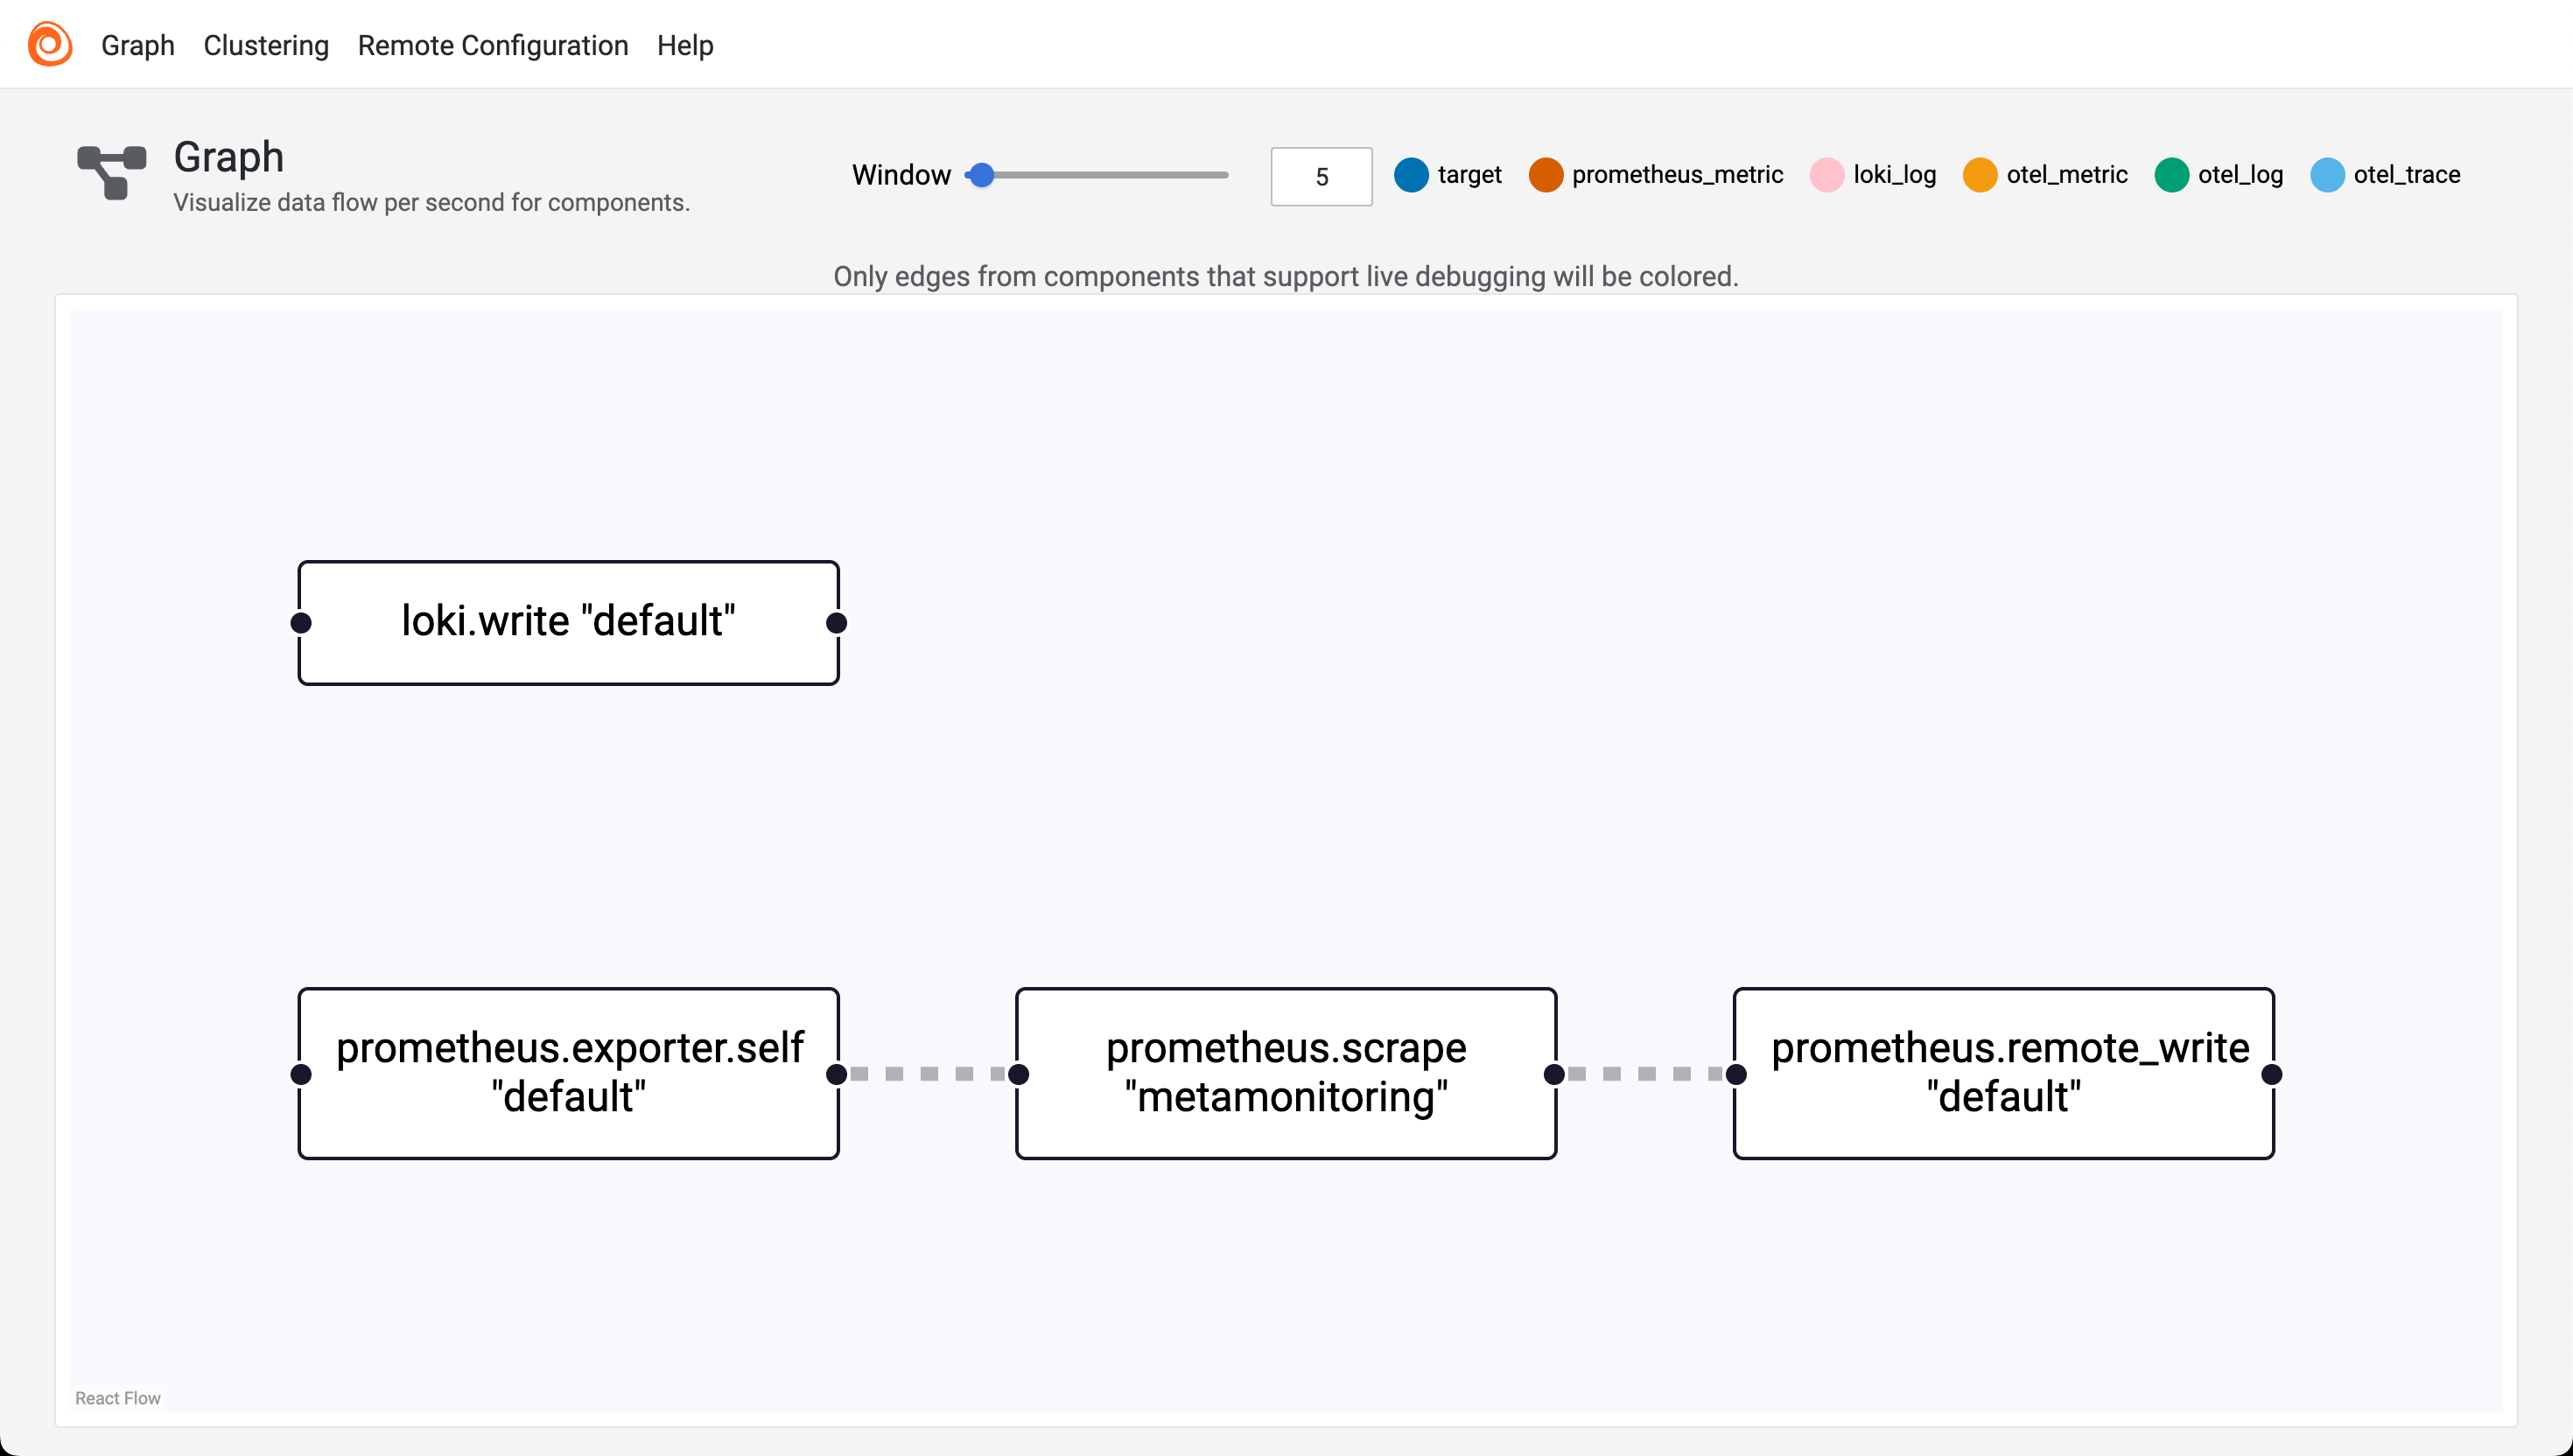
After reloading Alloy we can go back to the UI and check our components
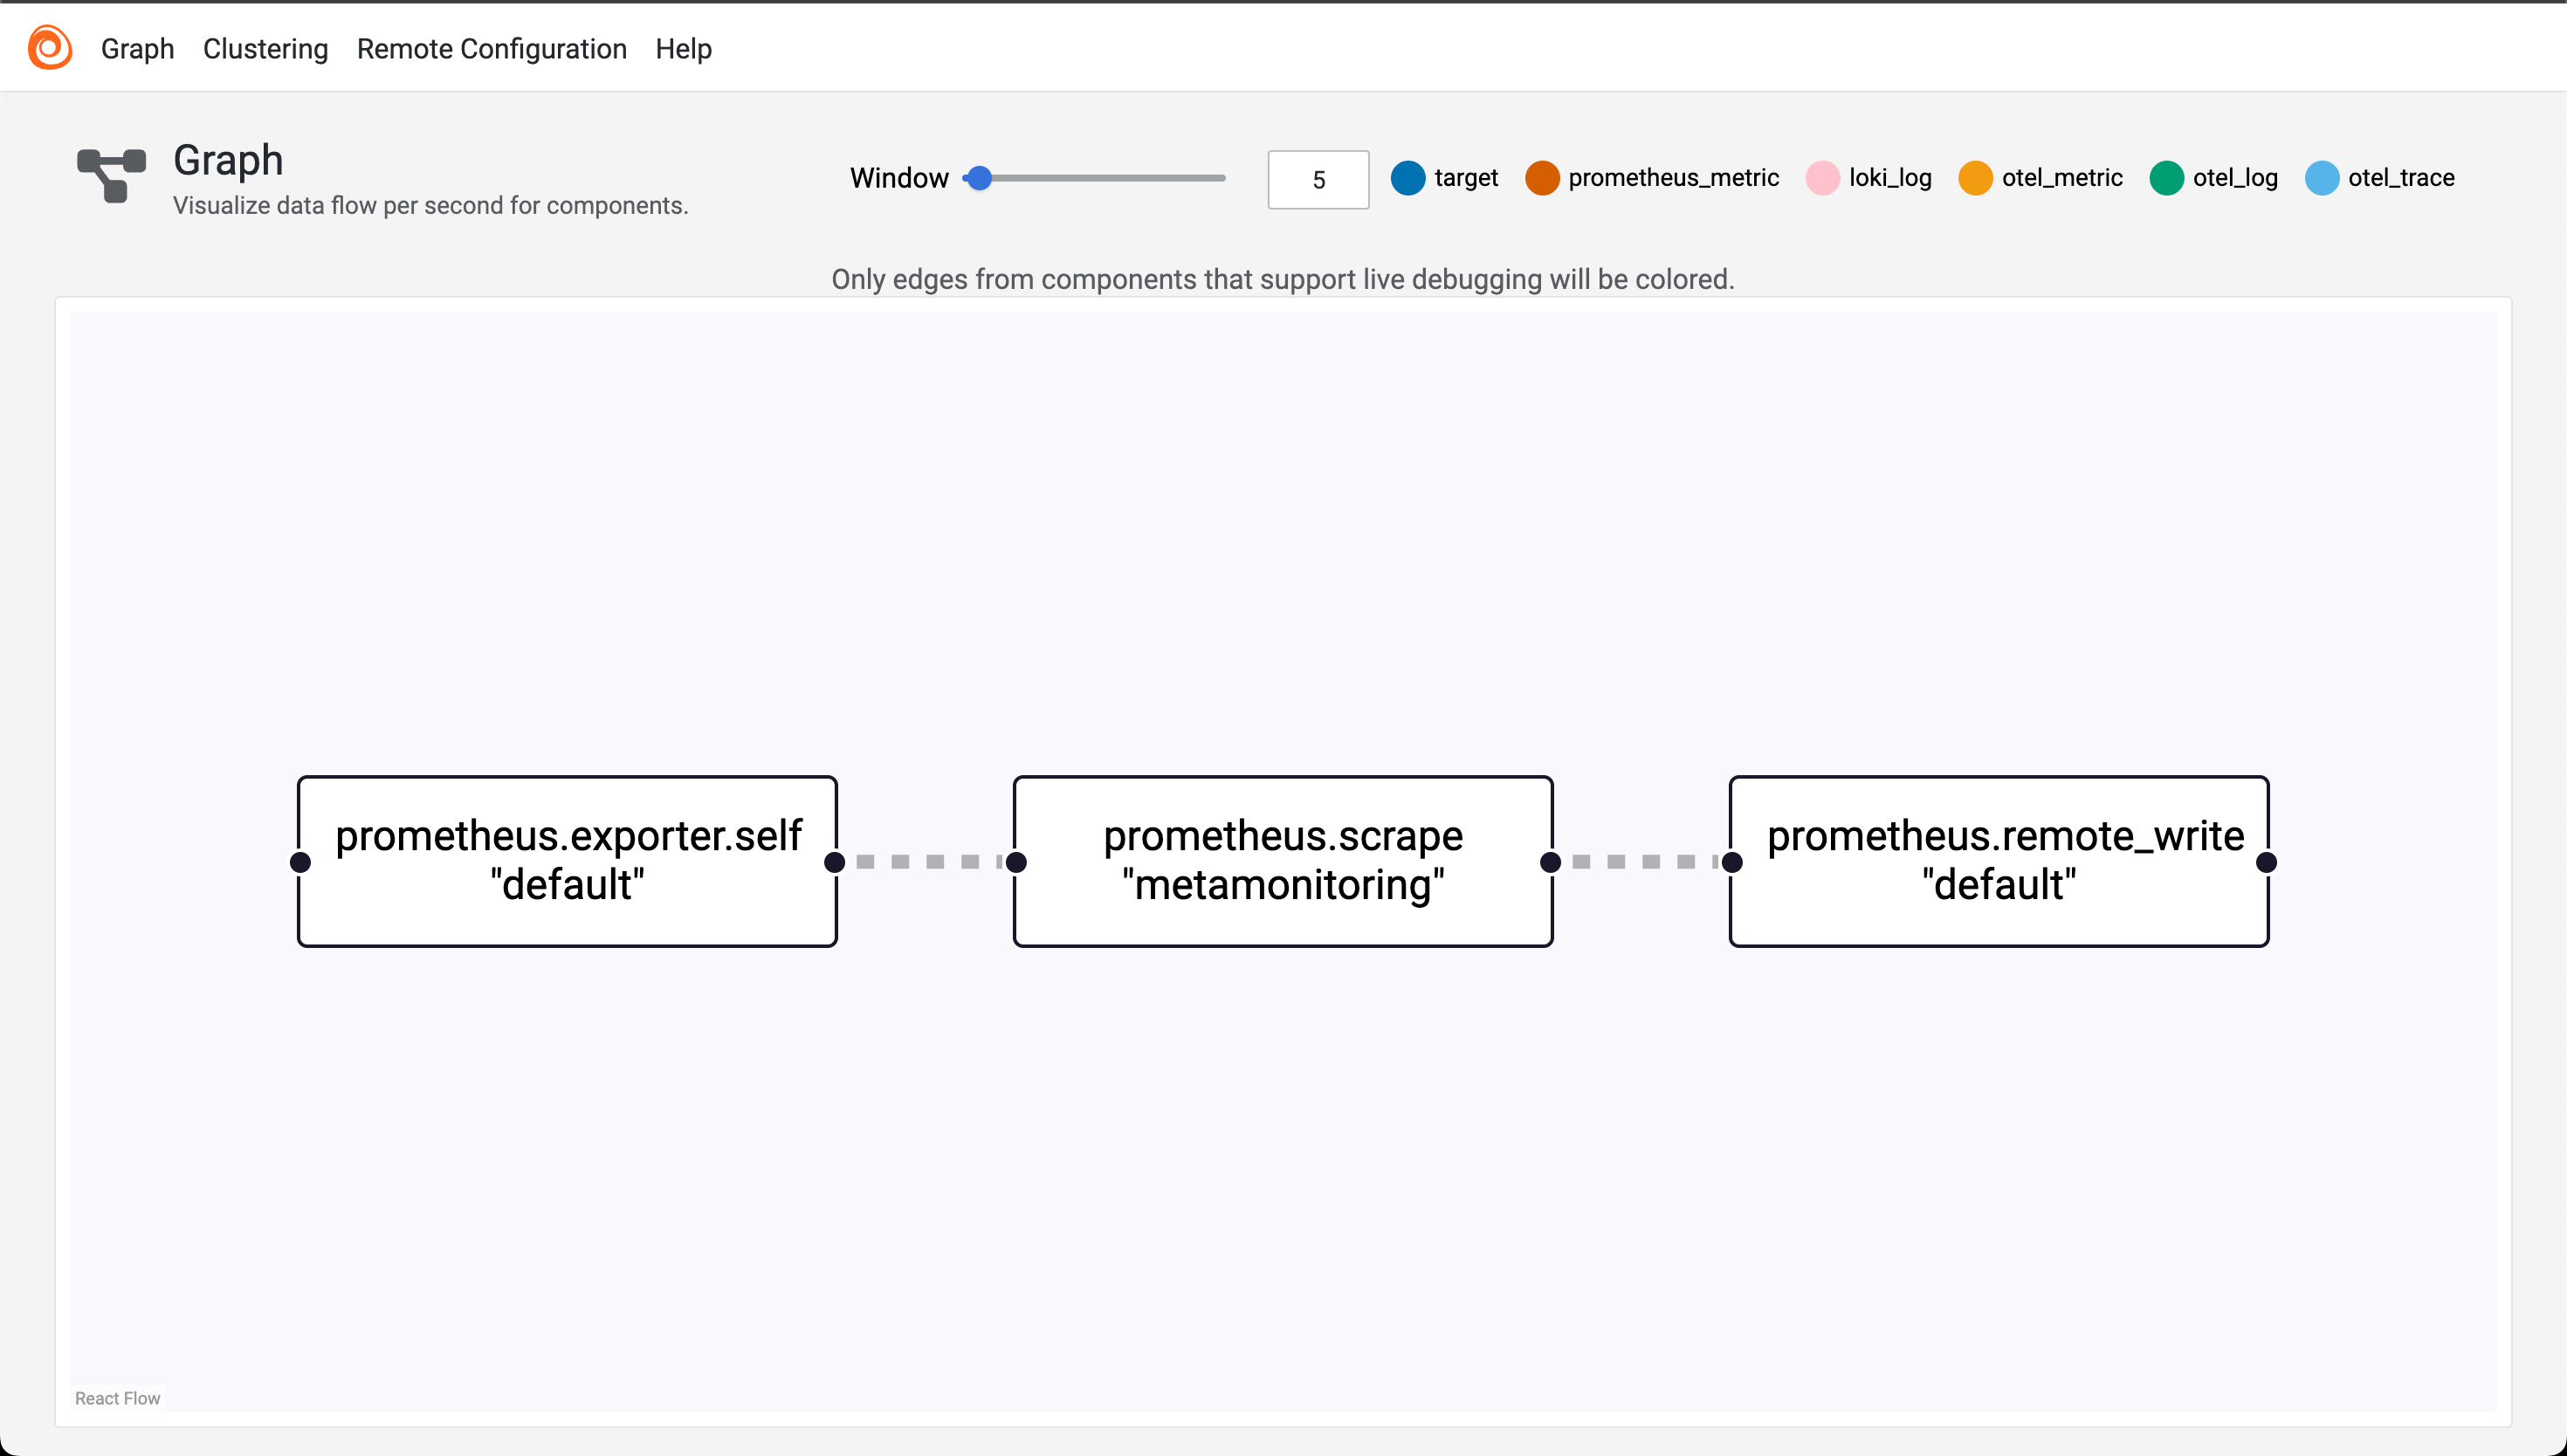
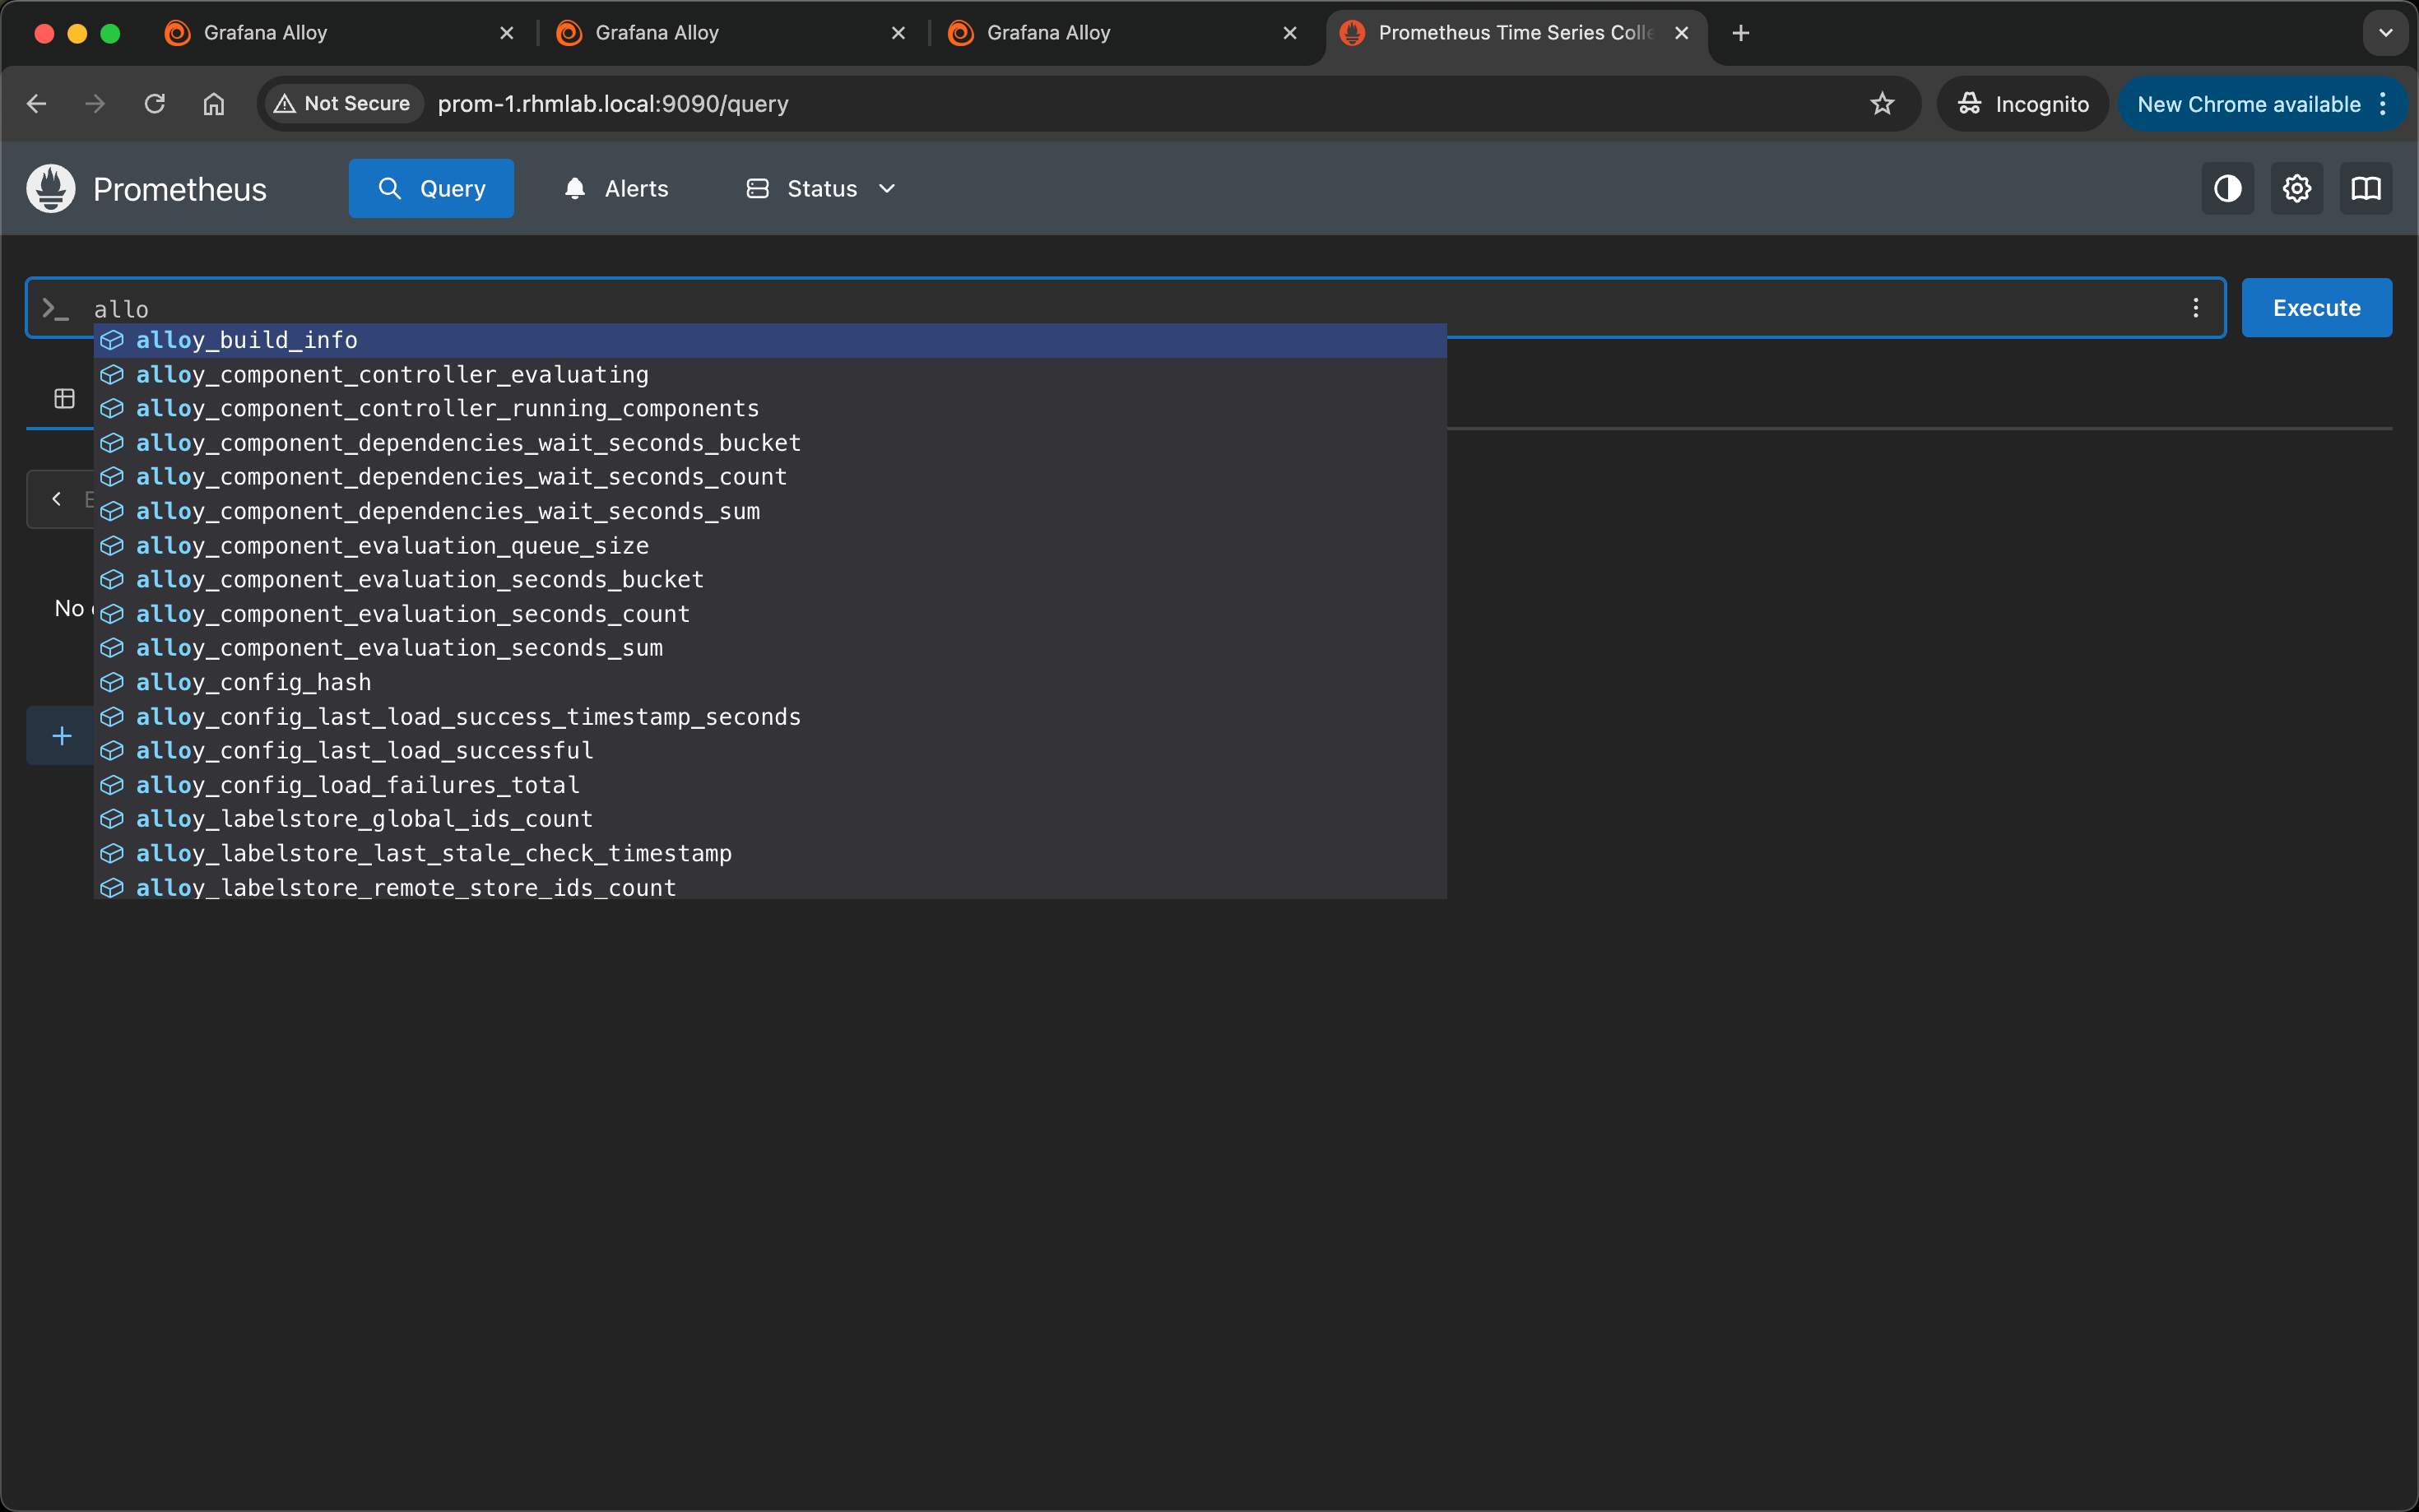
With this in place we should be able to start seeing metrics appearing in our Prometheus server
If metrics is not appearing in Prometheus we can add the Live debugging option to the Alloy configuration to see debug information on supported components in the UI
1livedebugging {
2  enabled = true
3}
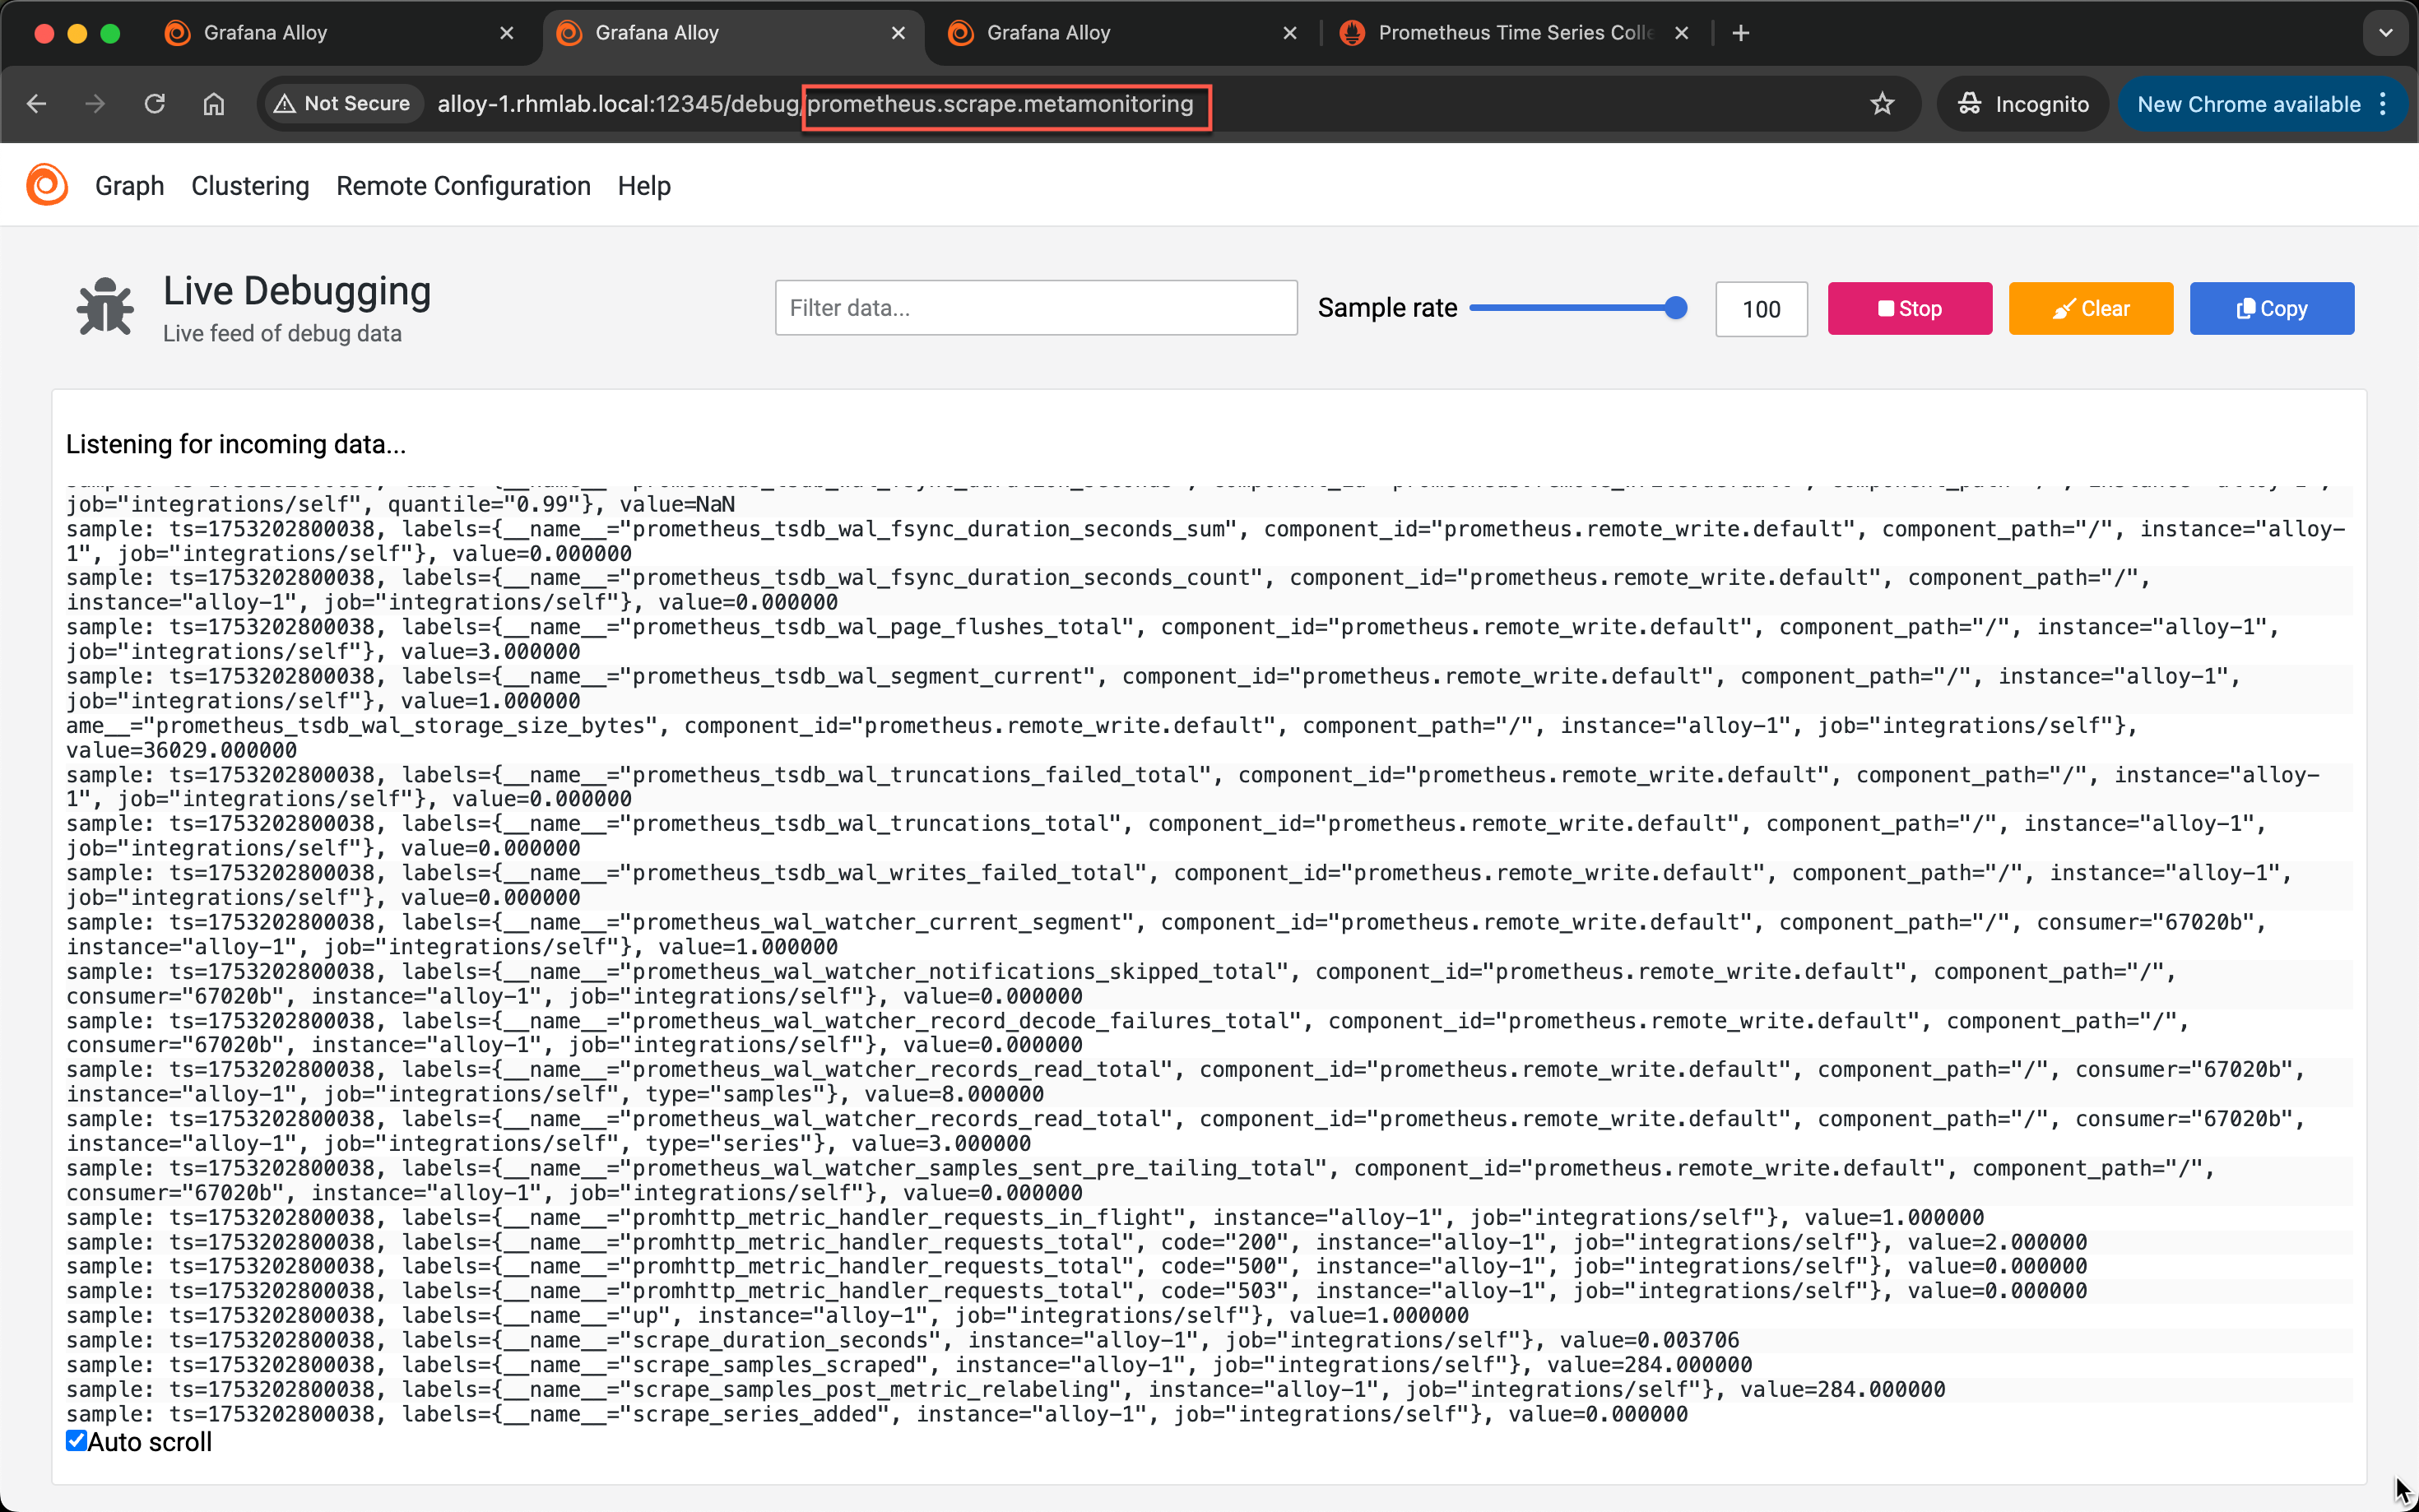
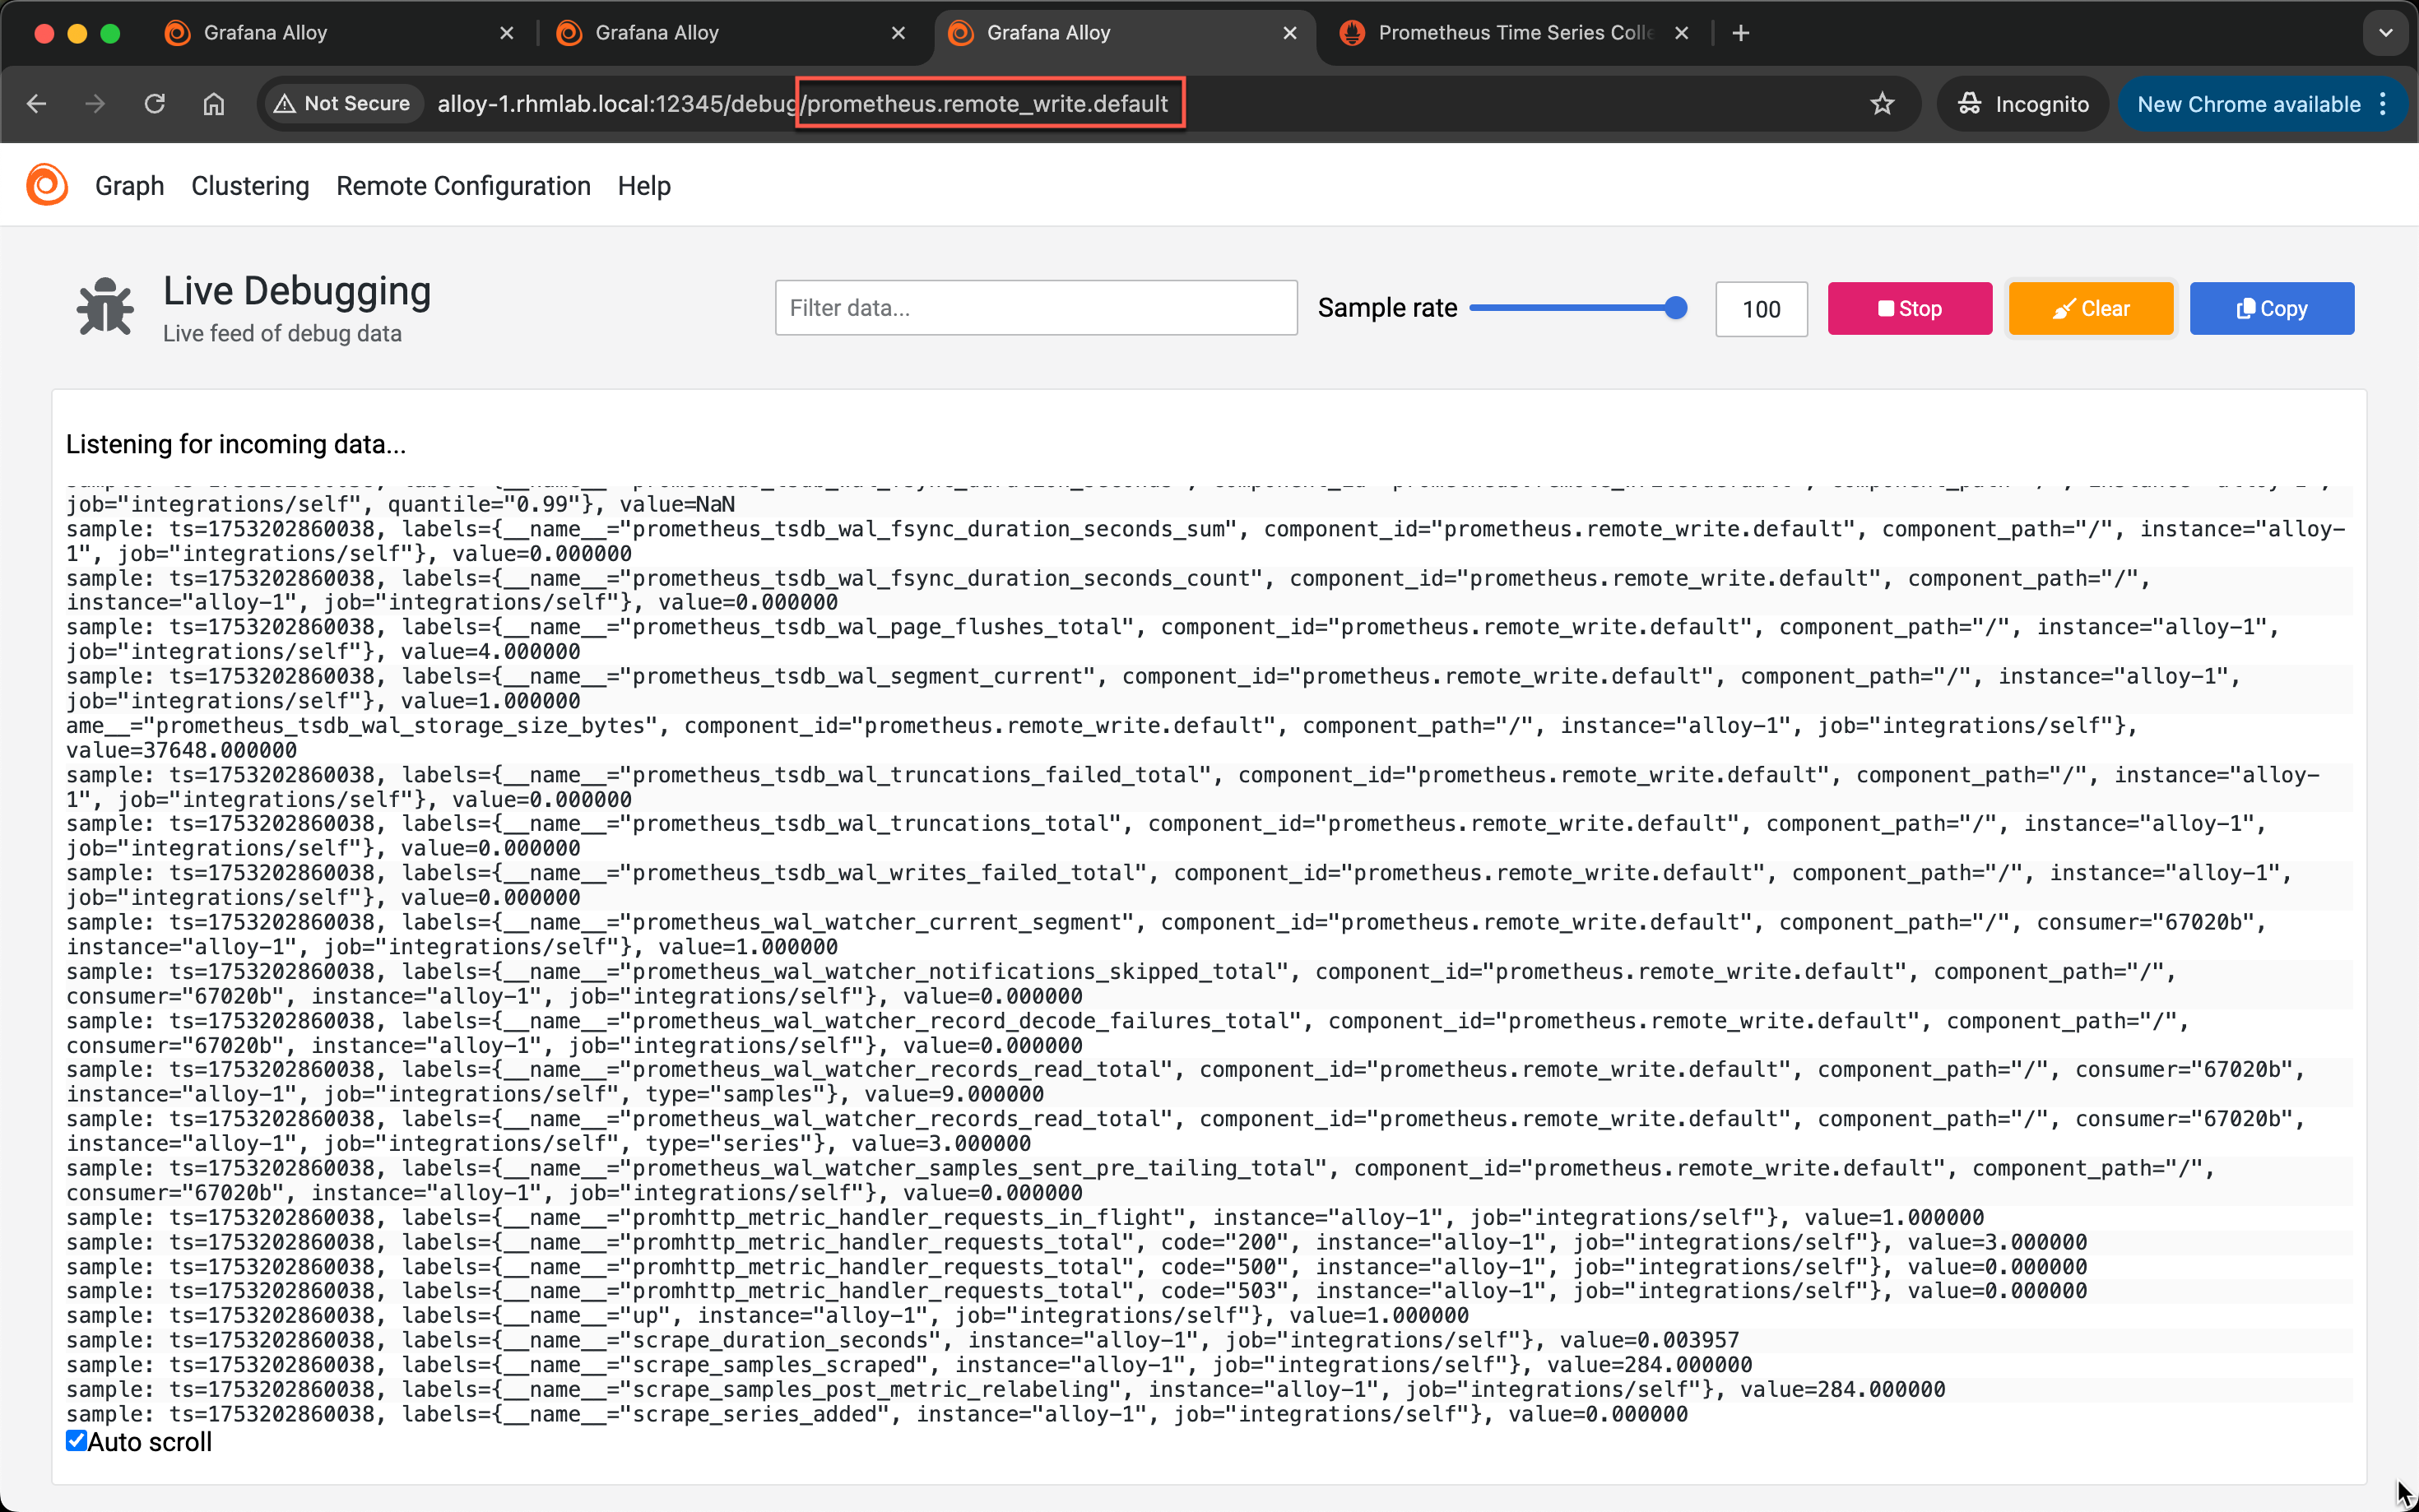
Note that not all components support the live debug feature
Alloy metrics in Grafana
Now, if your Prometheus server is added as a datasource in Grafana we should be able to visualize our Alloy metrics in Grafana. Let's take a look at the Grafana drilldown for metrics
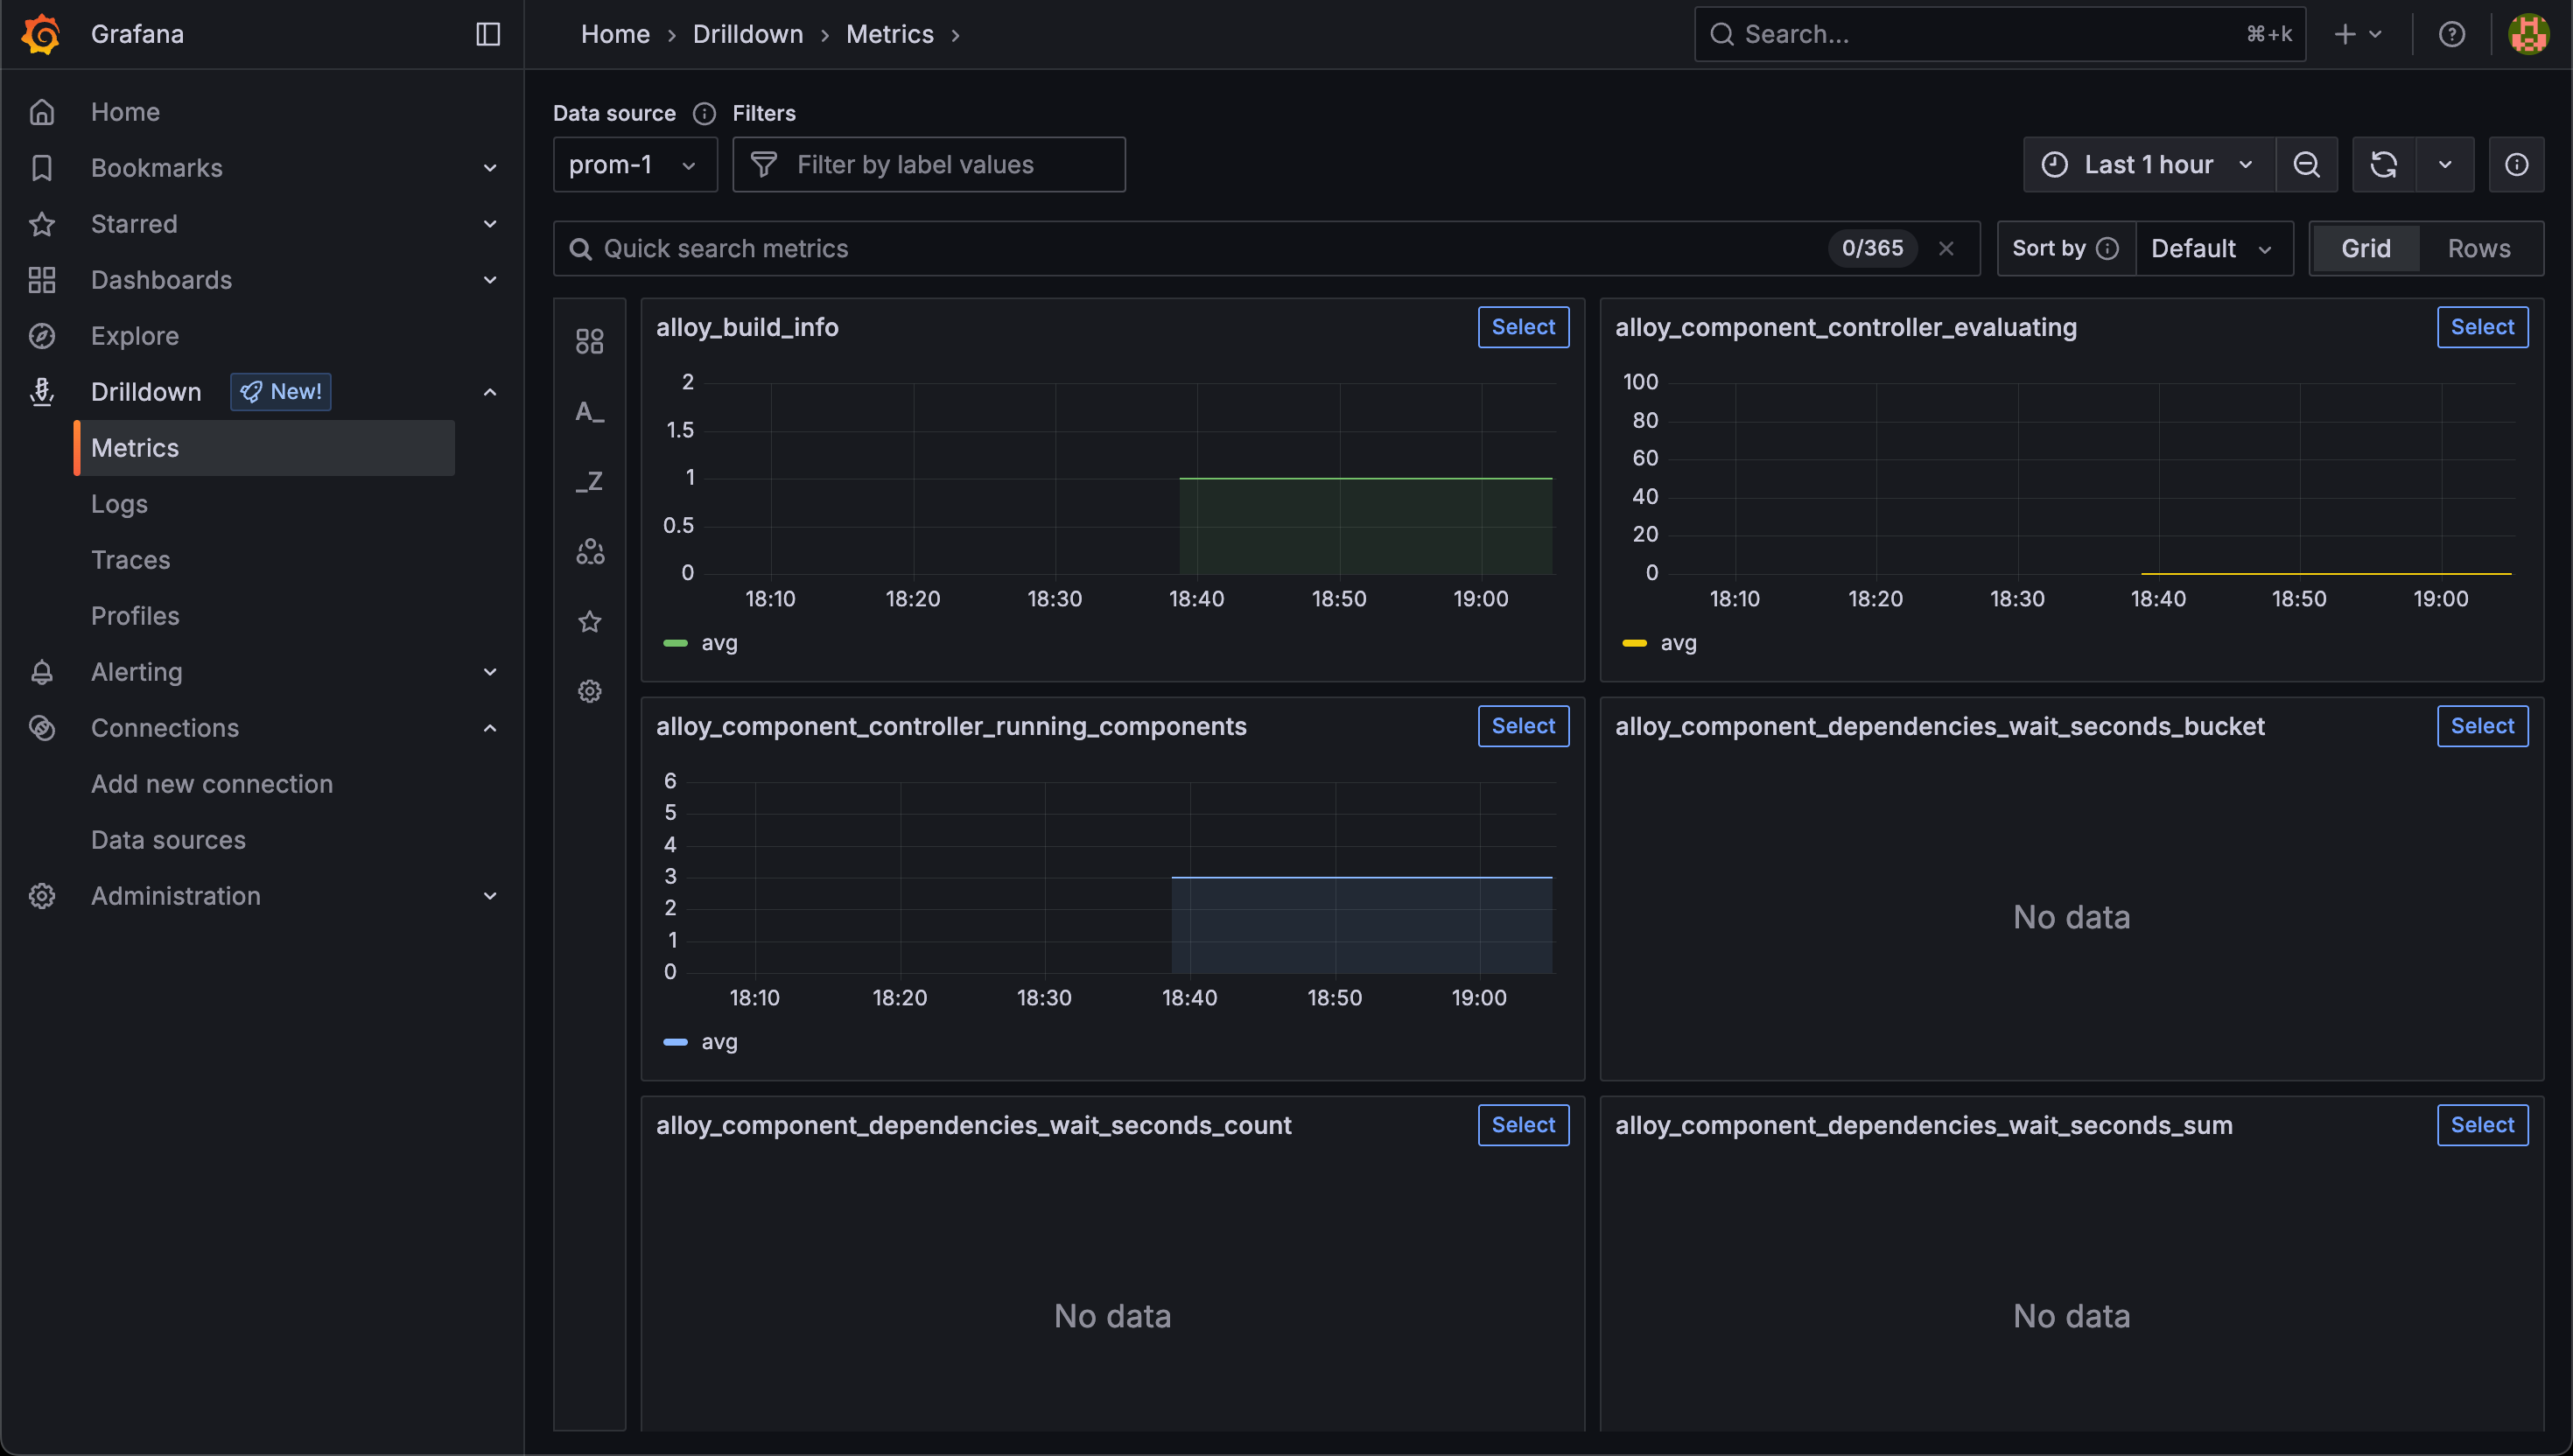
Grafana Drilldown is a Grafana 12 feature which is replacing the Explore feature. See the Grafana 12 announcement blog post for more
Connect Alloy to Grafana Loki
With metrics in place, let's also see if we can connect Alloy to a Grafana Loki server to receive our logs.
Alloy's own logs is defined in the logging component, but this is not shown in the UI. By default it writes to stdout. We'll modify it so that we set the level to info and instruct it to also write logs to a loki.write component
1logging {
2  level = "info"
3  write_to = [loki.write.default.receiver]
4}
Our Loki write component is named default and points to a Loki server
1loki.write "default" {
2  endpoint {
3    url = "http://<LOKI_SERVER>/loki/api/v1/push"
4  }
5}
The full configuration at this point
 1logging {
 2  level = "info"
 3  write_to = [loki.write.default.receiver]
 4}
 5
 6livedebugging {
 7  enabled = true
 8}
 9
10prometheus.exporter.self "default" {
11}
12
13prometheus.scrape "metamonitoring" {
14  targets    = prometheus.exporter.self.default.targets
15  forward_to = [prometheus.remote_write.default.receiver]
16}
17
18prometheus.remote_write "default" {
19  endpoint {
20    url = "http://<PROMETHEUS_SERVER>/api/v1/write"
21  }
22}
23
24loki.write "default" {
25  endpoint {
26    url = "http://<LOKI_SERVER>/loki/api/v1/push"
27  }
28}
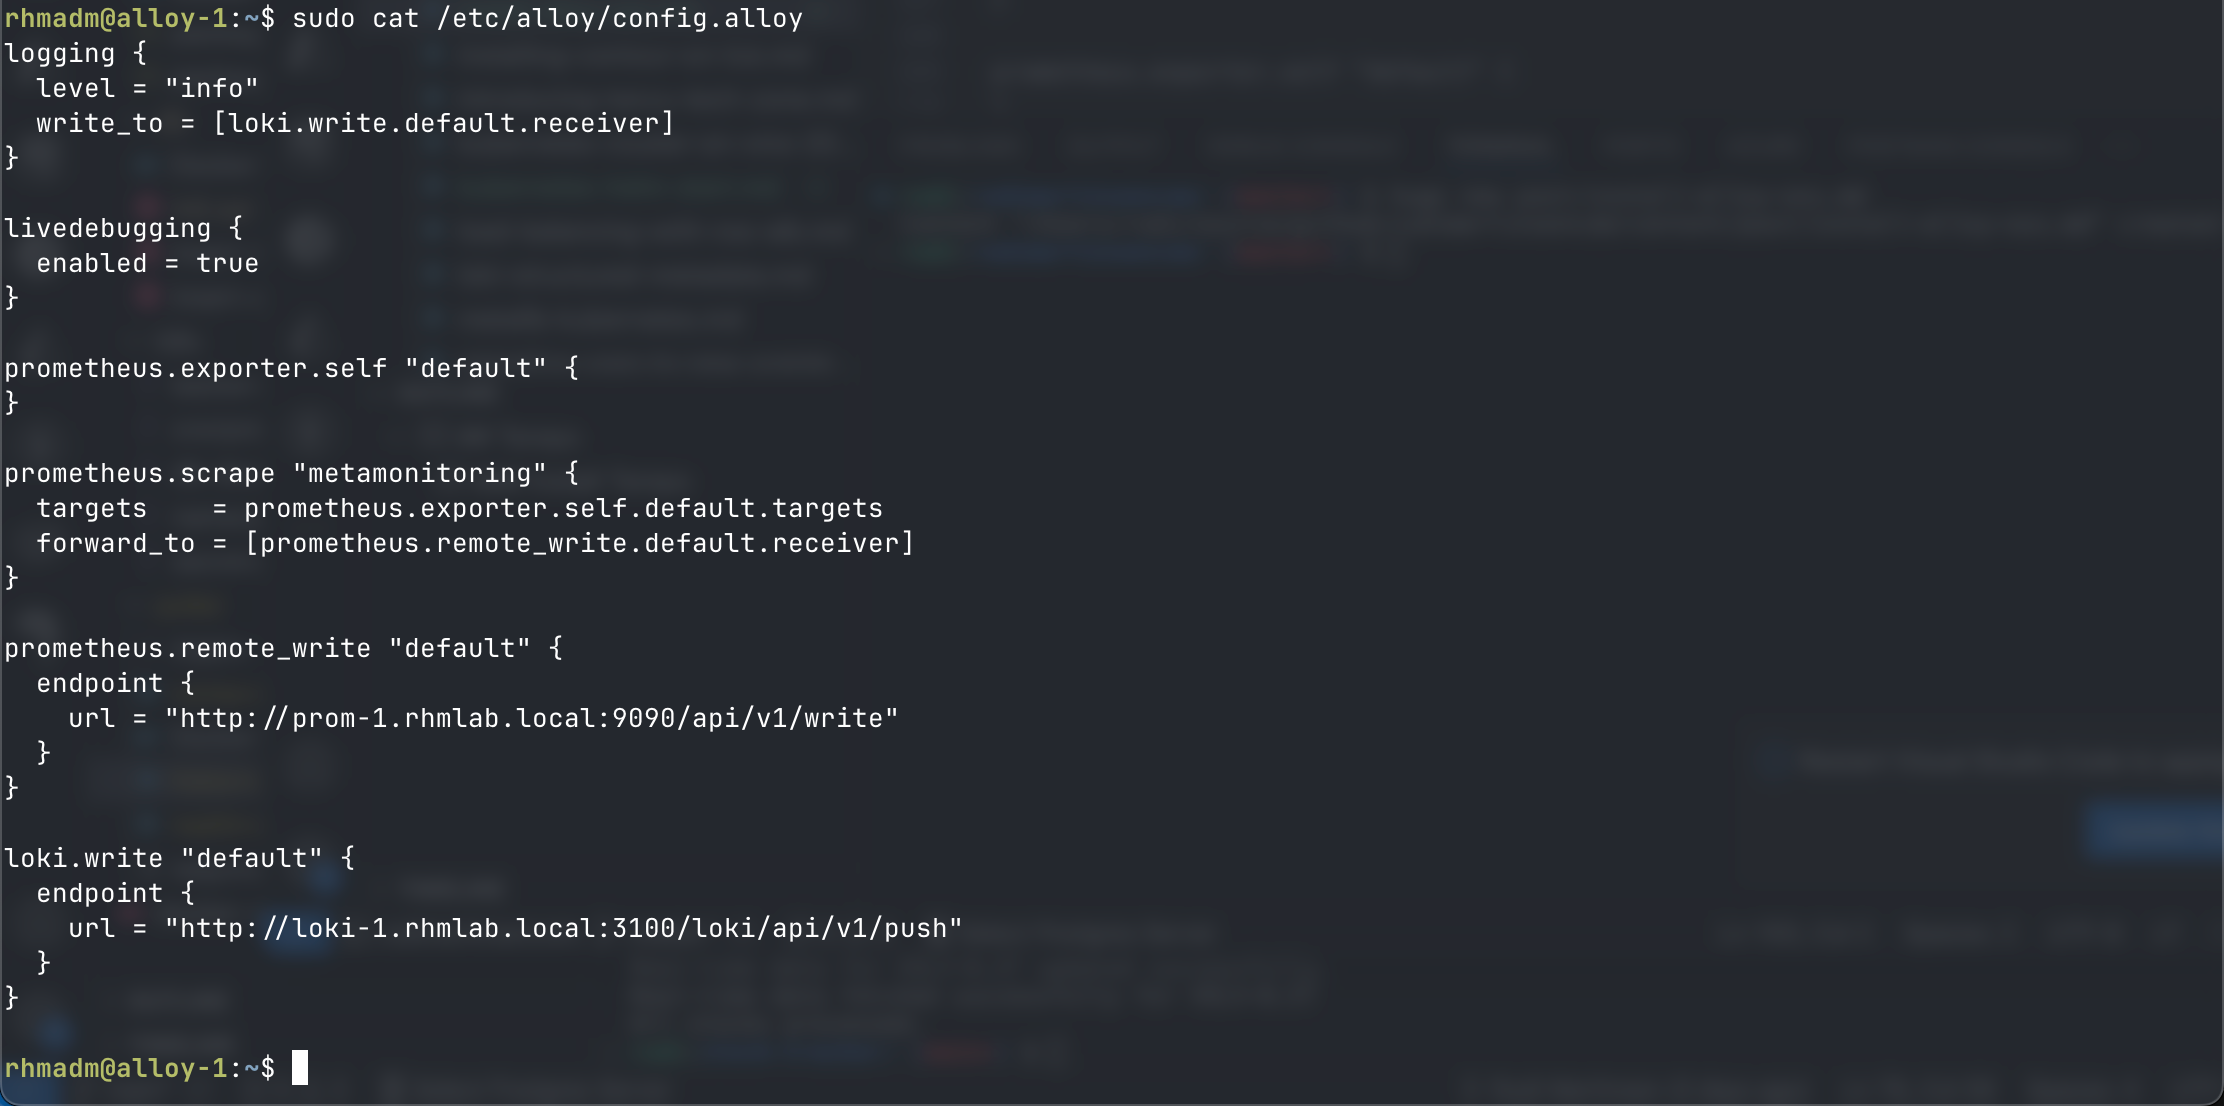
And in the UI we have the Loki write component. Again note that there's no scraper like component for Alloy's own logs
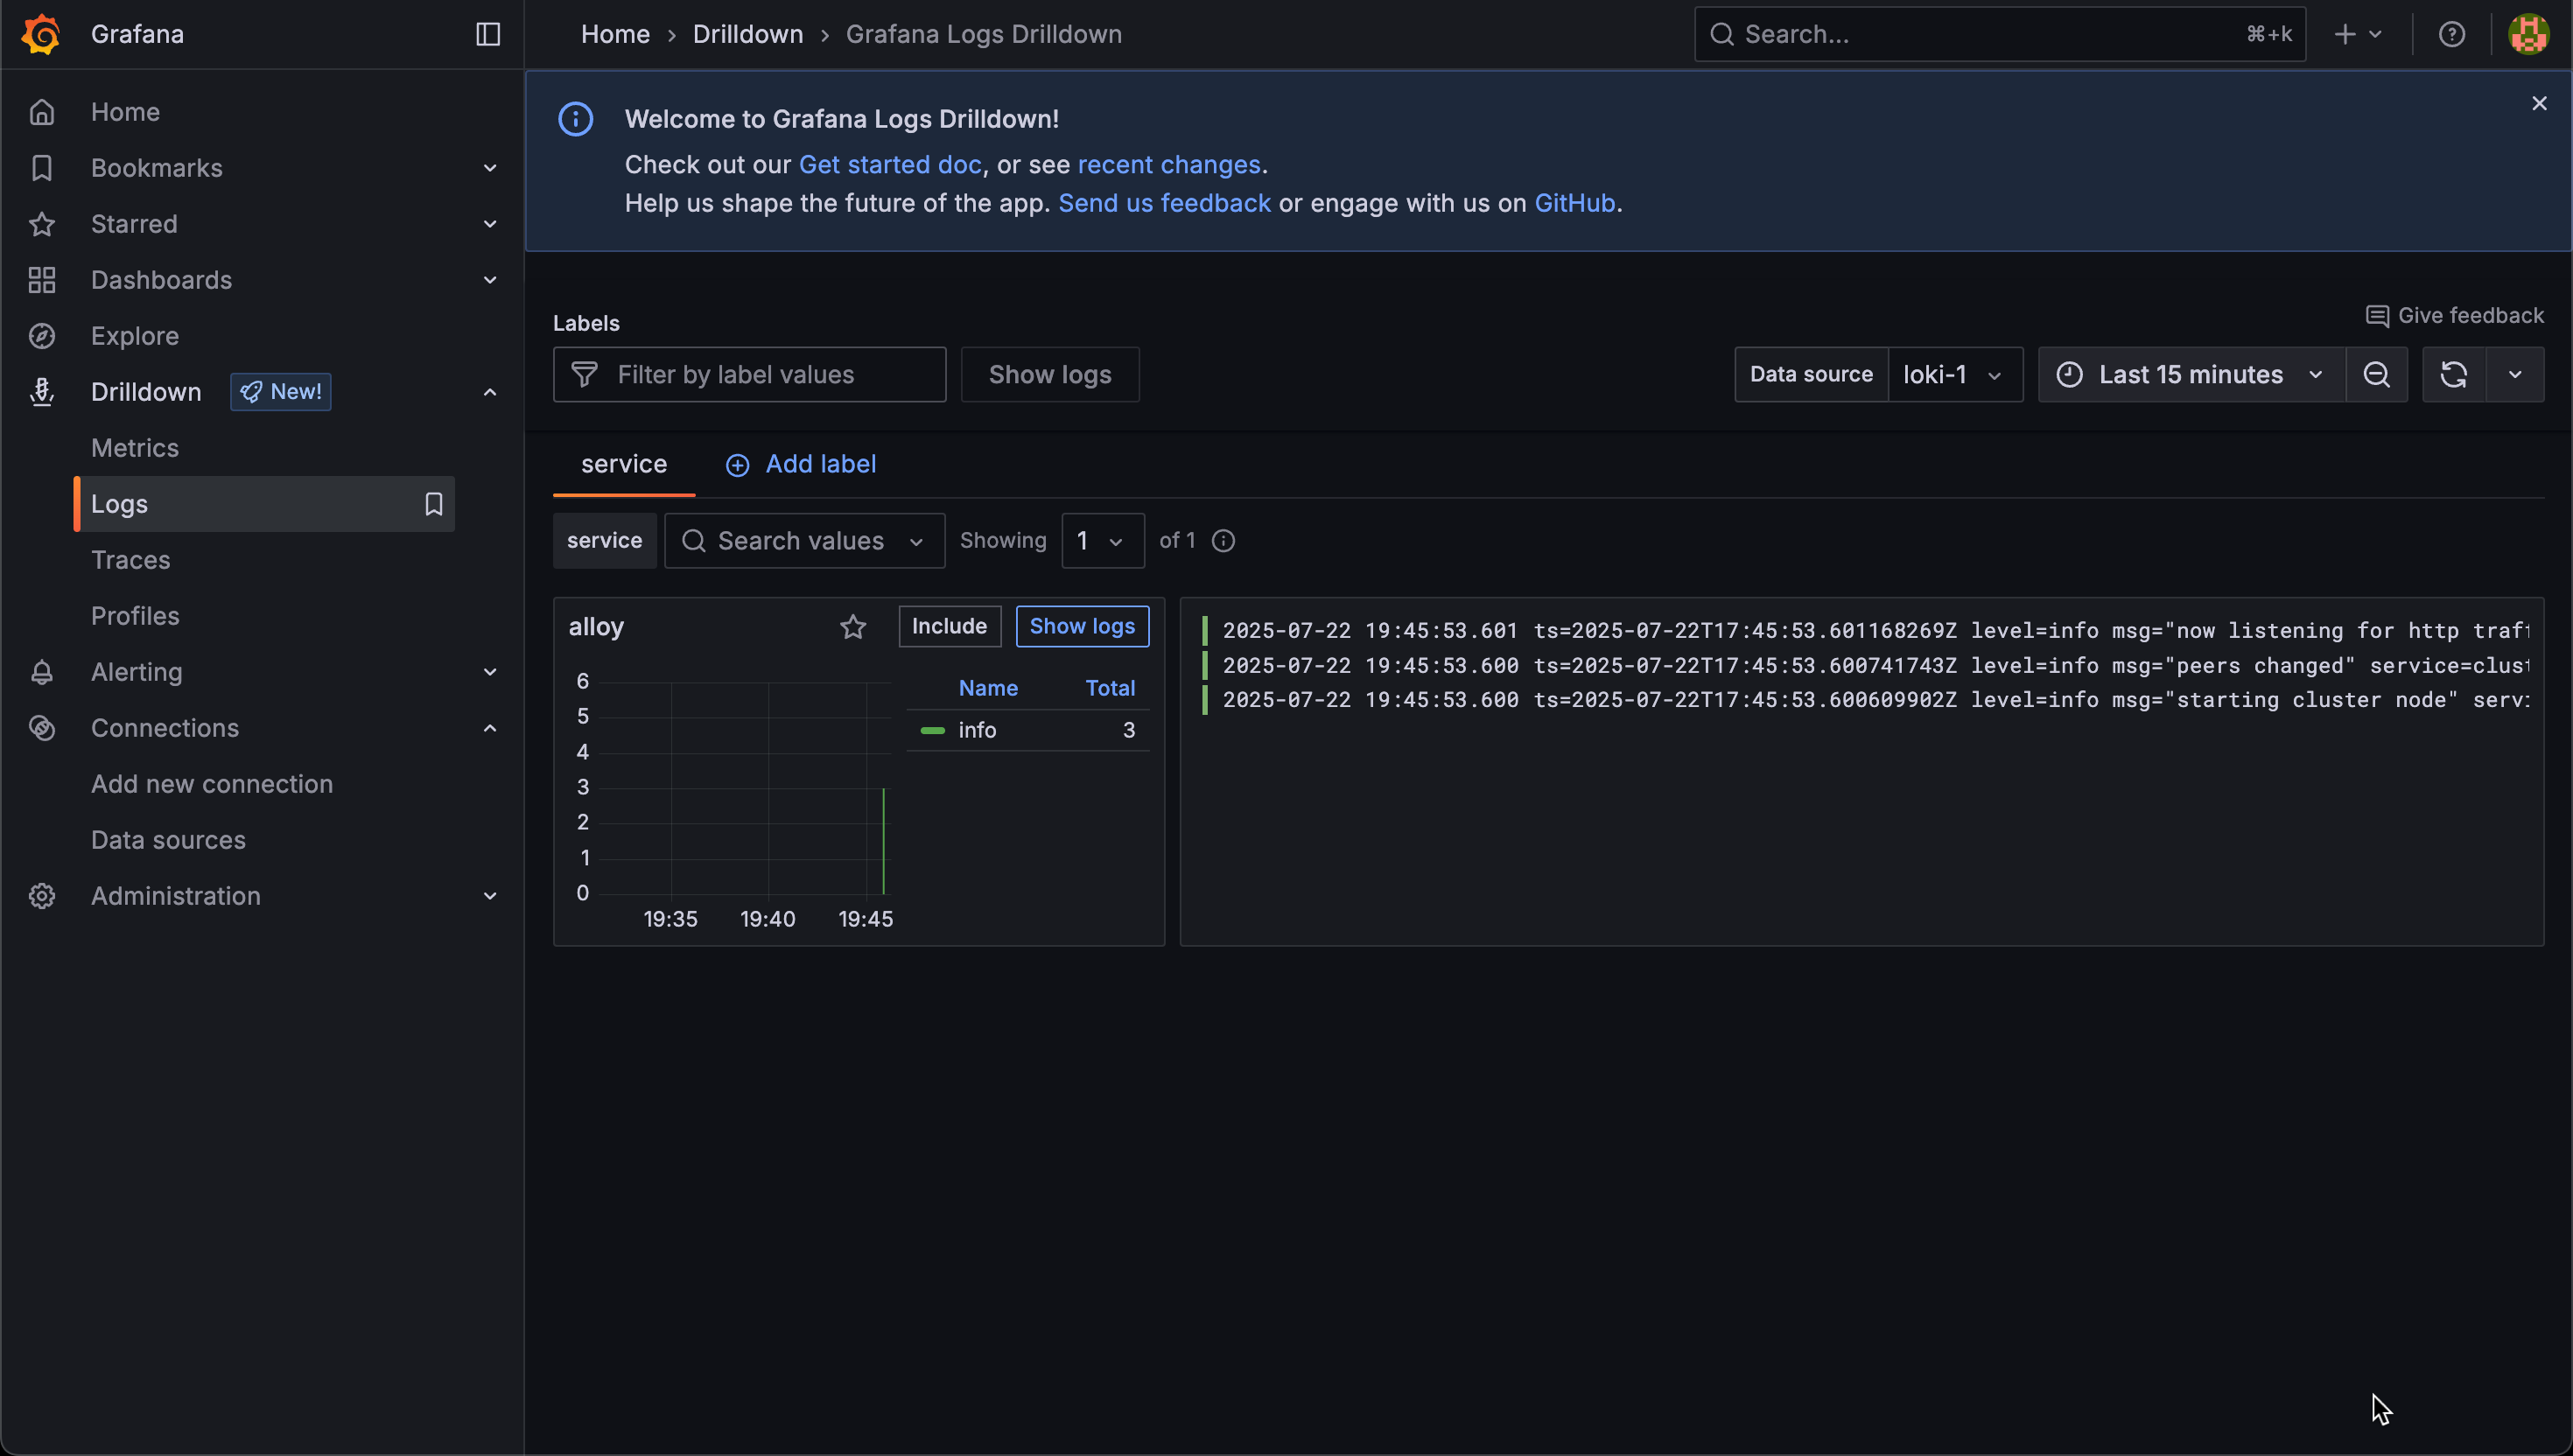
Our Grafana server is connected to the Loki server so we should be able to get some log lines in the Drilldown for logs
Summary
At this point what we've done is installing Grafana Alloy and hooked it up to Prometheus and Loki and have it sending it's own metrics and logs. We've verified that Alloy is sending data both through the Prometheus UI and in the new Grafana Drilldown feature.
With all of this in place, we should be ready for connecting Alloy to other components.