Working with structured metadata in Grafana Loki
This post is a follow up on a previous post where we saw how to utilize Grafana Loki and Promtail to receive and process firewall logs from an OPNsense firewall.
That post discussed log labels in Loki and that the (current) best practice in Loki is to be cautious of adding labels to your logs.
In a discussion with a former colleague we had a look at structured metadata which is a feature added to chunk format v4.
Structured metadata can be used to attach metadata to the log without the need to index these labels, or attach them to the individual log lines.
The Loki documentation lists the following scenarios where Structured metadata could be wise to use
- Native ingestion of OpenTelemetry data
- High cardinality metadata which does not exist in the log line
- If using Explore logs in Grafana to visualize and explore logs
- Large-scale and using Bloom filters
I wanted to see if I could make use of Structured metadata in my firewall logs example and identified one label that I'm missing from my current setup. The sequence id
Enable structured metadata
By default Loki will reject Structured metadata. To enable it we'll have to change the allow_structured_metadata setting in the Loki config
1limits_config:
2  allow_structured_metadata: true
Add a label from structured metadata
Continuing with the config from my previous post where we had a regex expression for parsing the log line to extract values
1^(?s)(?P<fw_rule>\d+),,,(?P<fw_rid>.+?),(?P<fw_interface>.+?),(?P<fw_reason>.+?),(?P<fw_action>(pass|block|reject)),(?P<fw_dir>(in|out)),(?P<fw_ipversion>\d+?),(?P<fw_tos>.+?),(?P<fw_>.+?)?,(?P<fw_ttl>\d.?),(?P<fw_id>\d+?),(?P<fw_offset>\d+?),(?P<fw_ipflags>.+?),(?P<fw_protonum>\d+?),(?P<fw_proto>(tcp|udp|icmp)),(?P<fw_length>\d+?),(?P<fw_src>\d+\.\d+\.\d+\.\d+?),(?P<fw_dst>\d+\.\d+\.\d+\.\d+?),(?P<fw_srcport>\d+?),(?P<fw_dstport>\d+?),(?P<fw_datalen>\d+),?(?P<fw_tcpflags>\w+)?,?(?P<fw_sequence>\d+)?
And in the Loki config we had this pipeline_stages stanza where the regex are specified as well as the labels we want to extract
 1pipeline_stages:
 2  - match:
 3    selector: '{syslog_app_name="filterlog"} !~ ".*icmp.*"'
 4    stages:
 5    - regex:
 6        expression: '^(?s)(?P<fw_rule>\d+),,,(?P<fw_rid>.+?),(?P<fw_interface>.+?),(?P<fw_reason>.+?),(?P<fw_action>(pass|block|reject)),(?P<fw_dir>(in|out)),(?P<fw_ipversion>\d+?),(?P<fw_tos>.+?),(?P<fw_>.+?)?,(?P<fw_ttl>\d.?),(?P<fw_id>\d+?),(?P<fw_offset>\d+?),(?P<fw_ipflags>.+?),(?P<fw_protonum>\d+?),(?P<fw_proto>(tcp|udp|icmp)),(?P<fw_length>\d+?),(?P<fw_src>\d+\.\d+\.\d+\.\d+?),(?P<fw_dst>\d+\.\d+\.\d+\.\d+?),(?P<fw_srcport>\d+?),(?P<fw_dstport>\d+?),(?P<fw_datalen>\d+),?(?P<fw_tcpflags>\w+)?,?(?P<fw_sequence>\d+)?'
 7    - labels:
 8        fw_src:
 9        fw_dst:
10        fw_action:
11        fw_dstport:
12        fw_proto:
13        fw_interface:
In Grafana we can verify that the labels are added to our logs
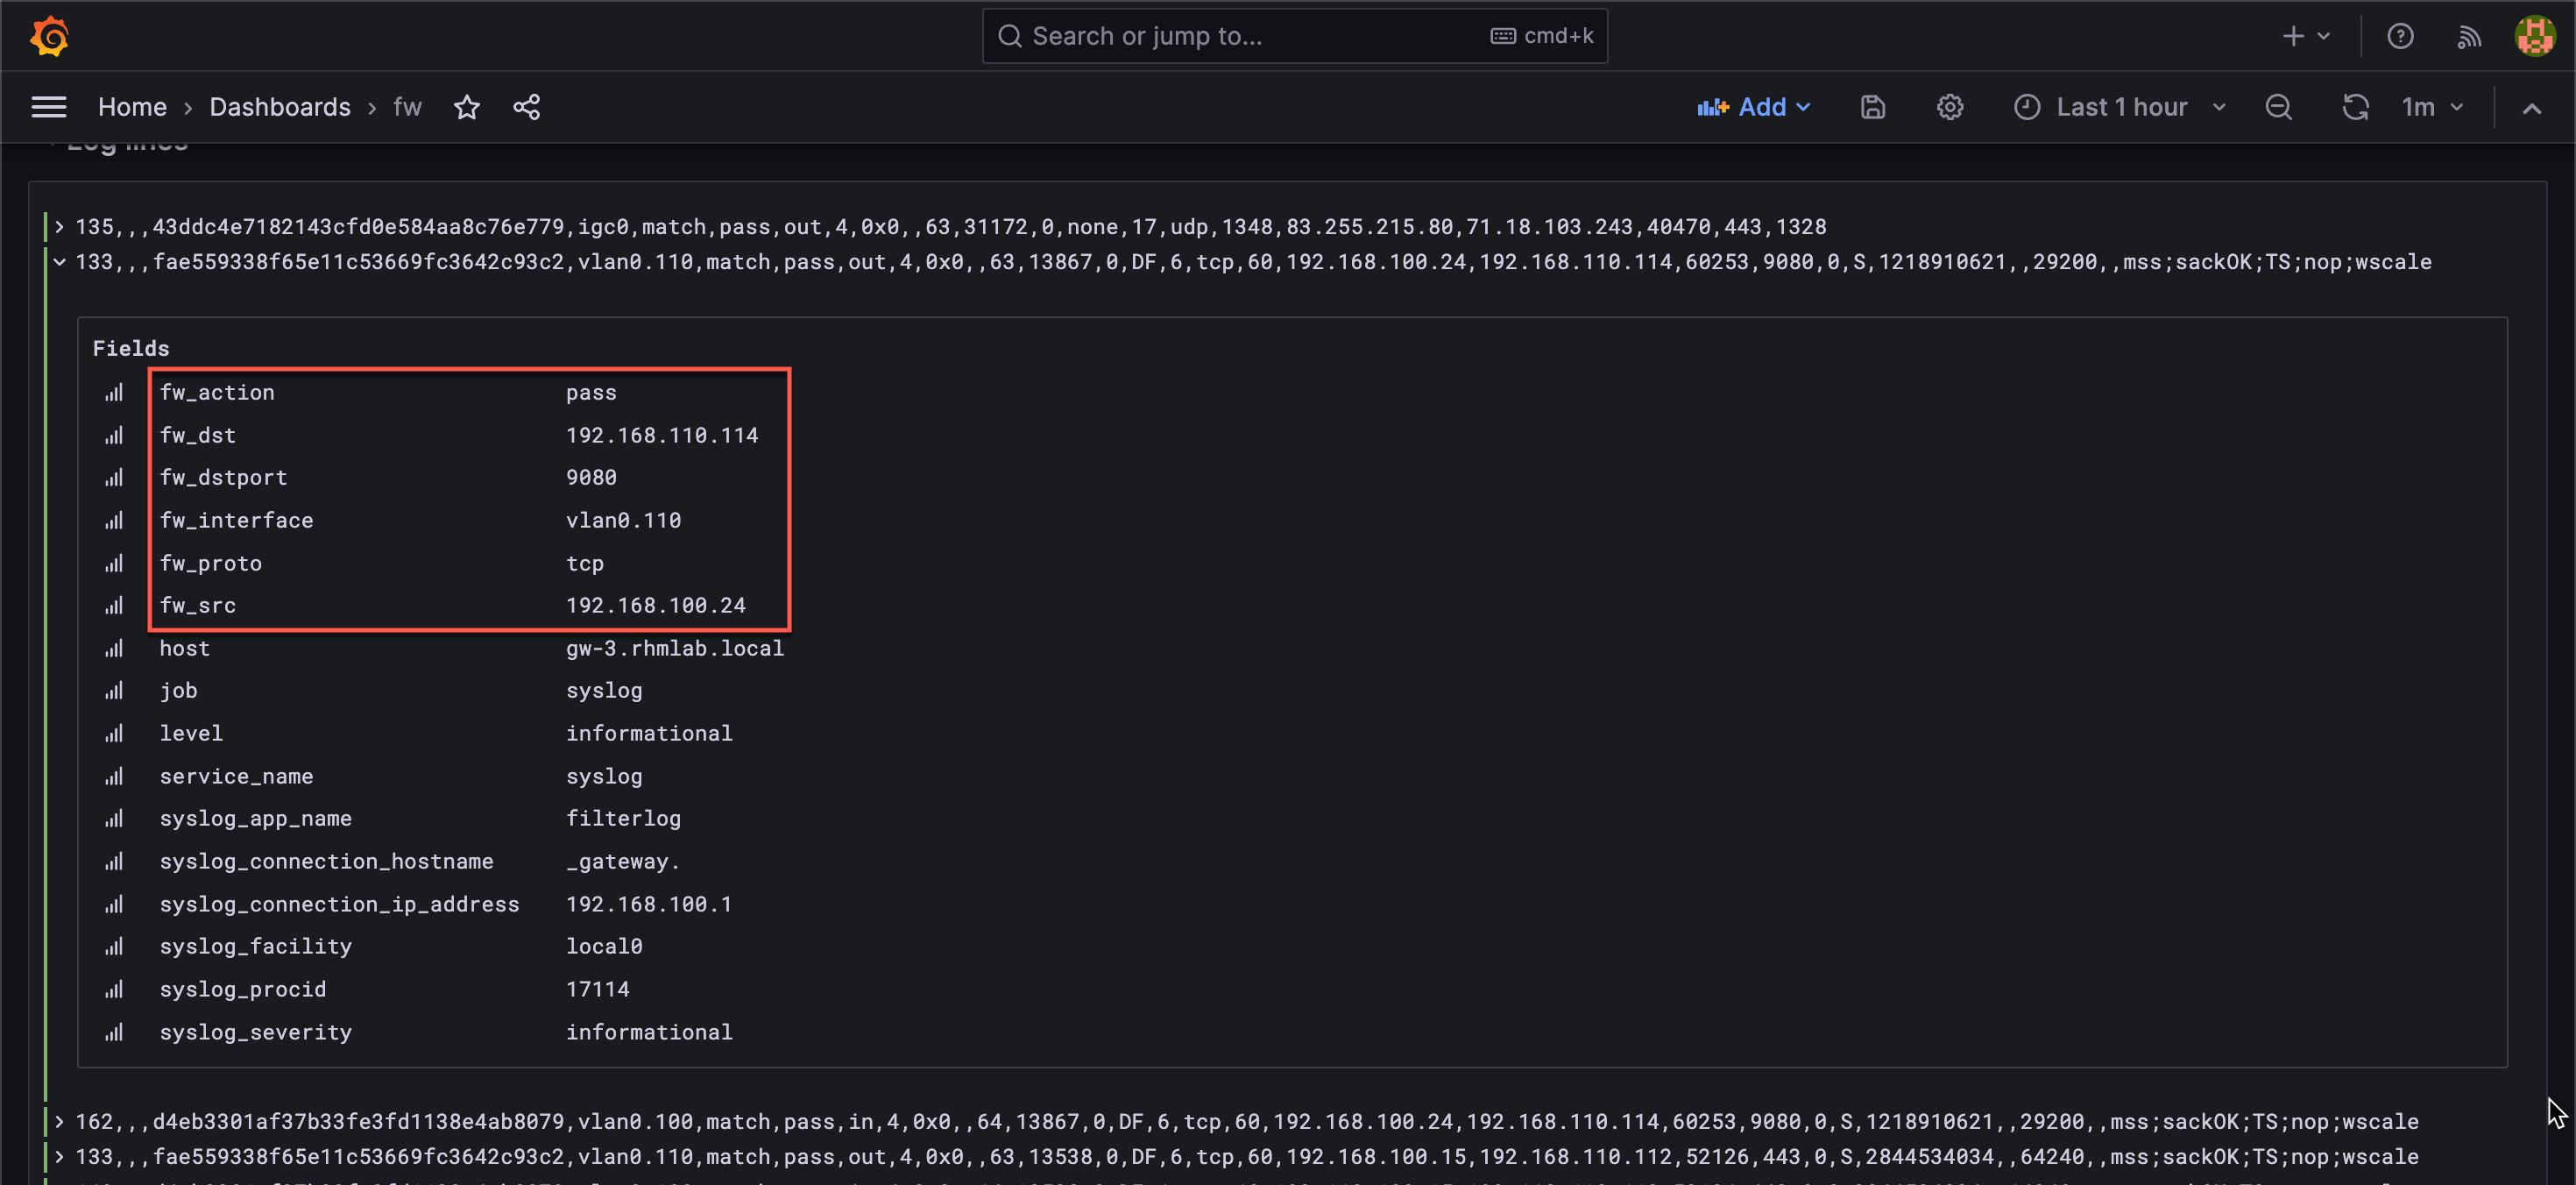
Now, there's more named groups in the regex than there are labels. And we won't use all of them now either, but as mentioned we want to extract the sequence and add that as Structured metadata
Since the pipelining stage already knows about the sequence from our named group in the regex expression we can basically just add the structured_metadata stanza and specify the label we want to add
1- structured_metadata:
2    fw_sequence:
Thats' it
The full pipeline_stage looks like this
 1pipeline_stages:
 2  - match:
 3      selector: '{syslog_app_name="filterlog"} !~ ".*icmp.*"'
 4      stages:
 5      - regex:
 6          expression: '^(?s)(?P<fw_rule>\d+),,,(?P<fw_rid>.+?),(?P<fw_interface>.+?),(?P<fw_reason>.+?),(?P<fw_action>(pass|block|reject)),(?P<fw_dir>(in|out)),(?P<fw_ipversion>\d+?),(?P<fw_tos>.+?),(?P<fw_>.+?)?,(?P<fw_ttl>\d.?),(?P<fw_id>\d+?),(?P<fw_offset>\d+?),(?P<fw_ipflags>.+?),(?P<fw_protonum>\d+?),(?P<fw_proto>(tcp|udp|icmp)),(?P<fw_length>\d+?),(?P<fw_src>\d+\.\d+\.\d+\.\d+?),(?P<fw_dst>\d+\.\d+\.\d+\.\d+?),(?P<fw_srcport>\d+?),(?P<fw_dstport>\d+?),(?P<fw_datalen>\d+),?(?P<fw_tcpflags>\w+)?,?(?P<fw_sequence>\d+)?'
 7      - labels:
 8          fw_src:
 9          fw_dst:
10          fw_action:
11          fw_dstport:
12          fw_proto:
13          fw_interface:
14      - structured_metadata:
15          fw_sequence:
Note that as explained in the previous post I have two
matchblocks, one for icmp protocol traffic and one for non-icmp. In the above examples the non-icmp is what is shown.
Verify structured metadata label
Over in Grafana we can verify that our sequence label is added to the logs
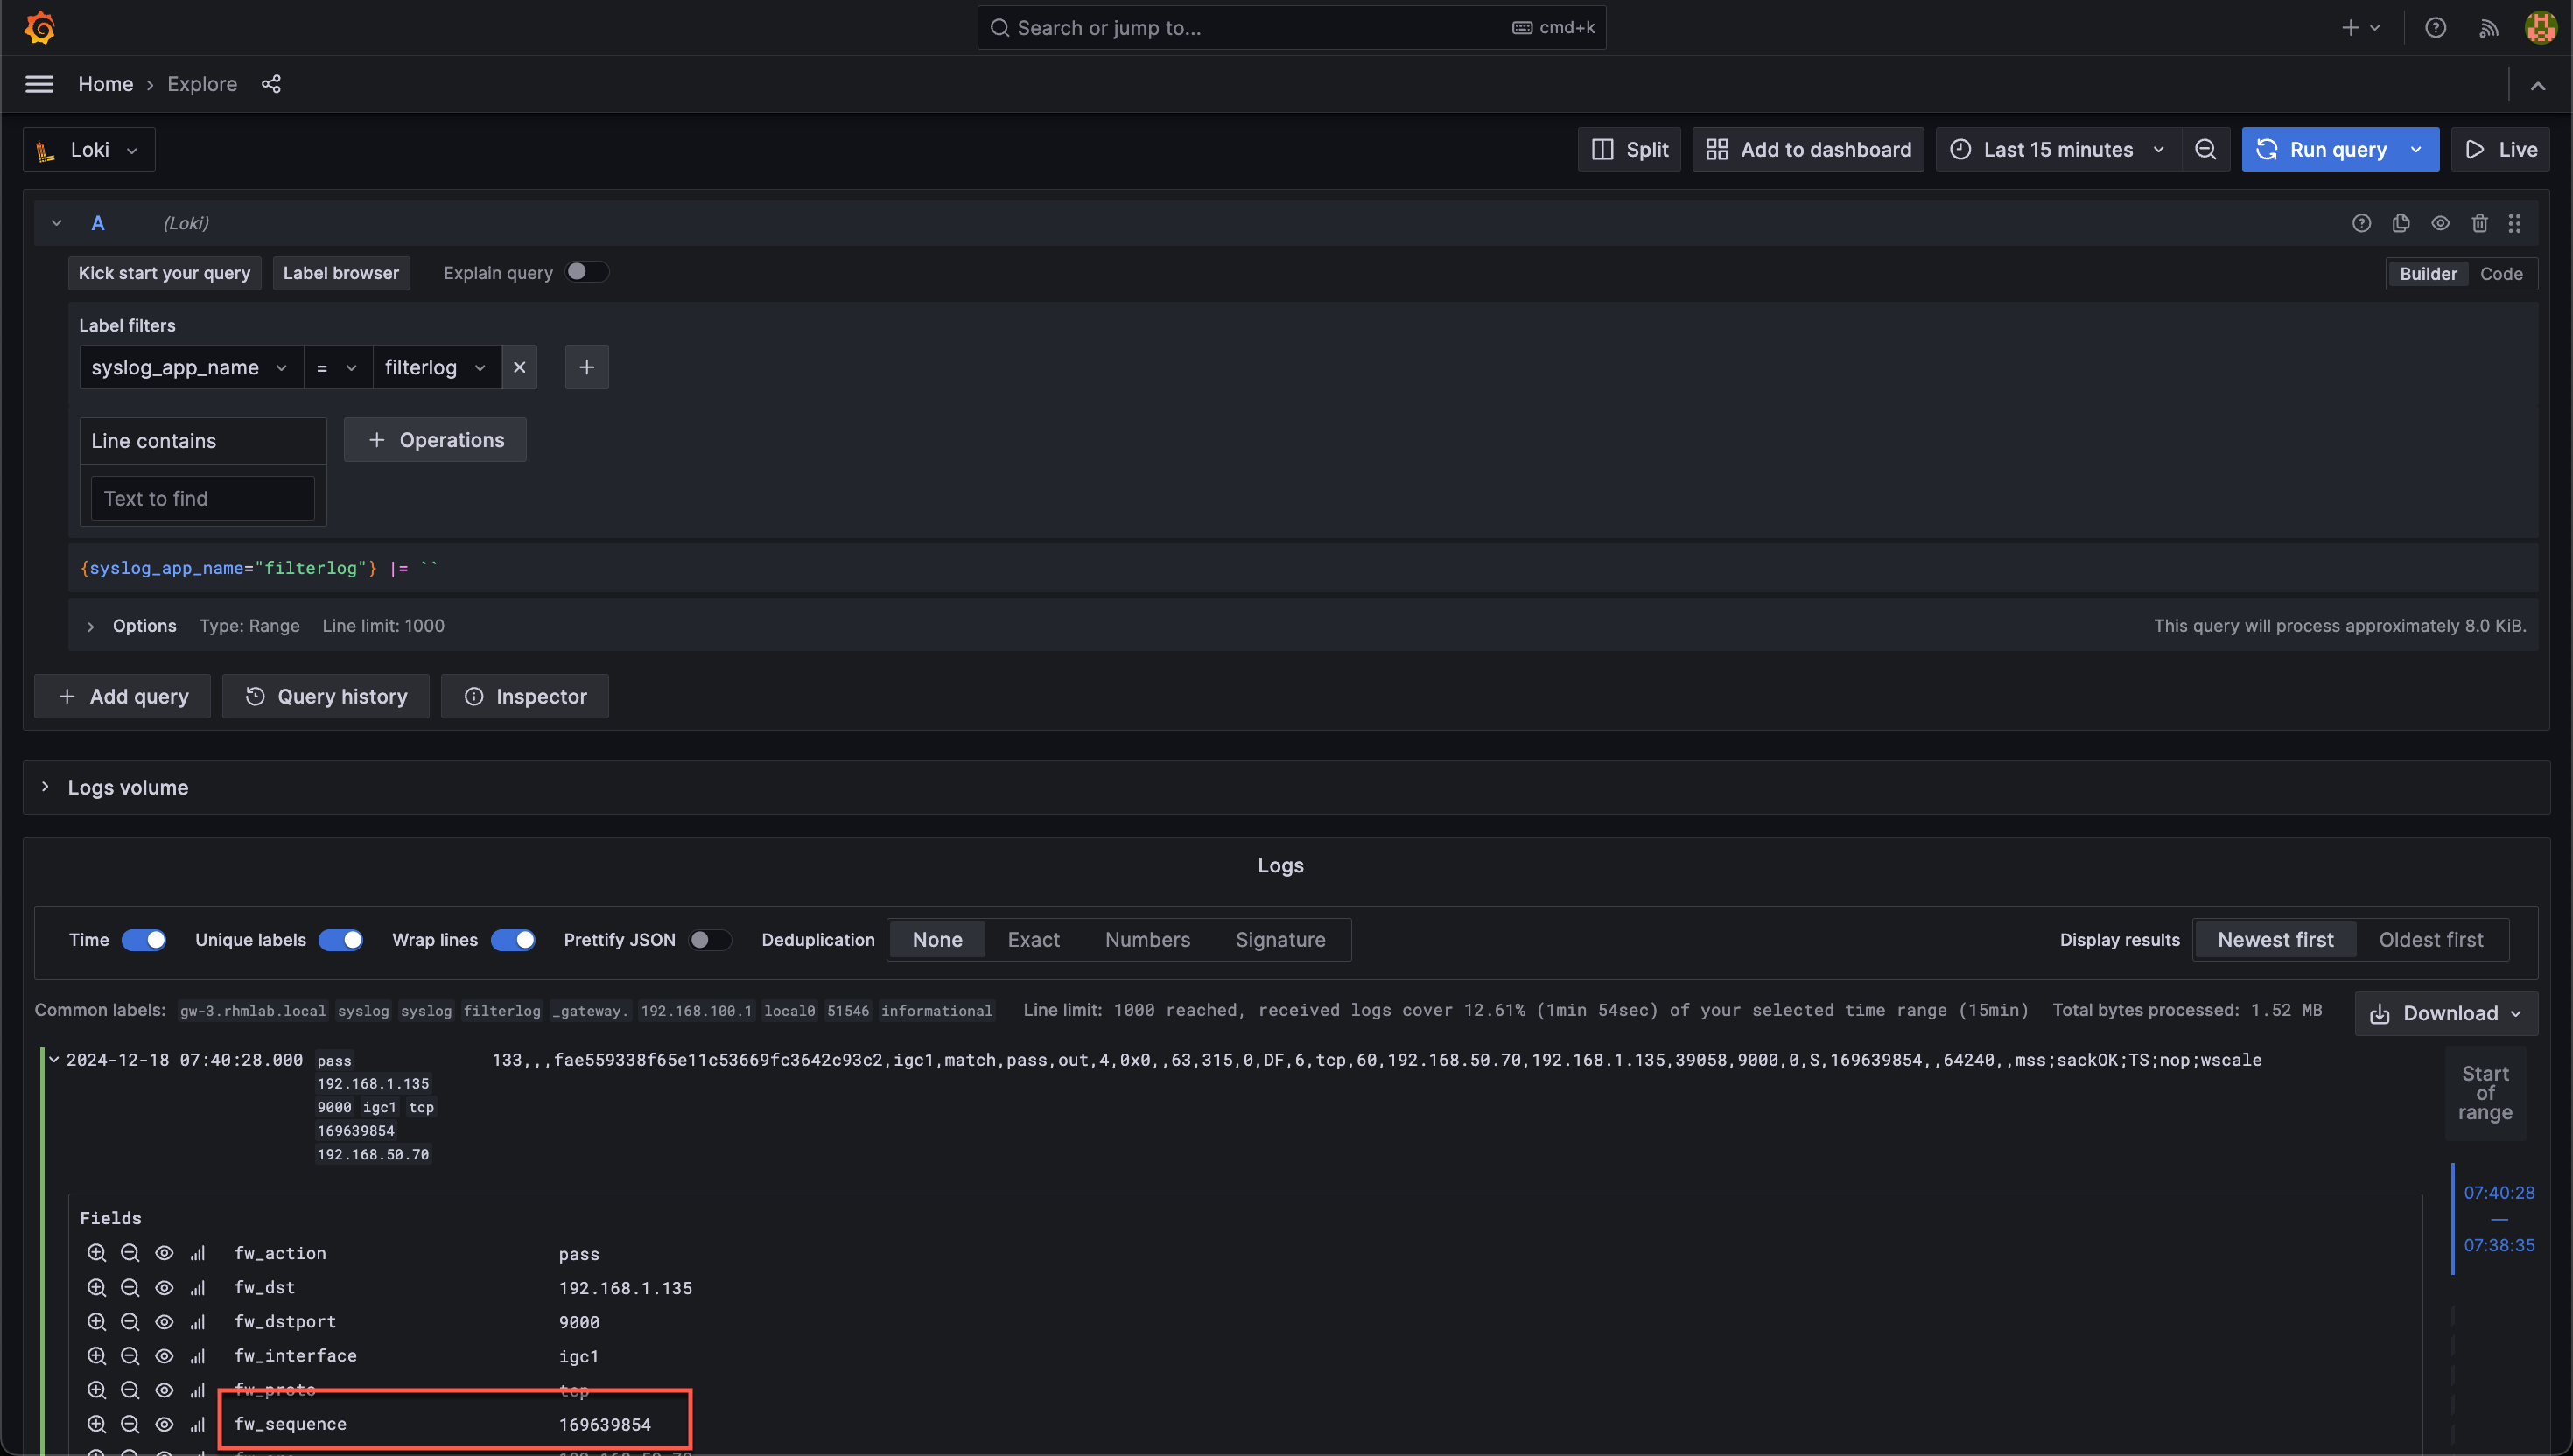
However this label is not available for label filtering
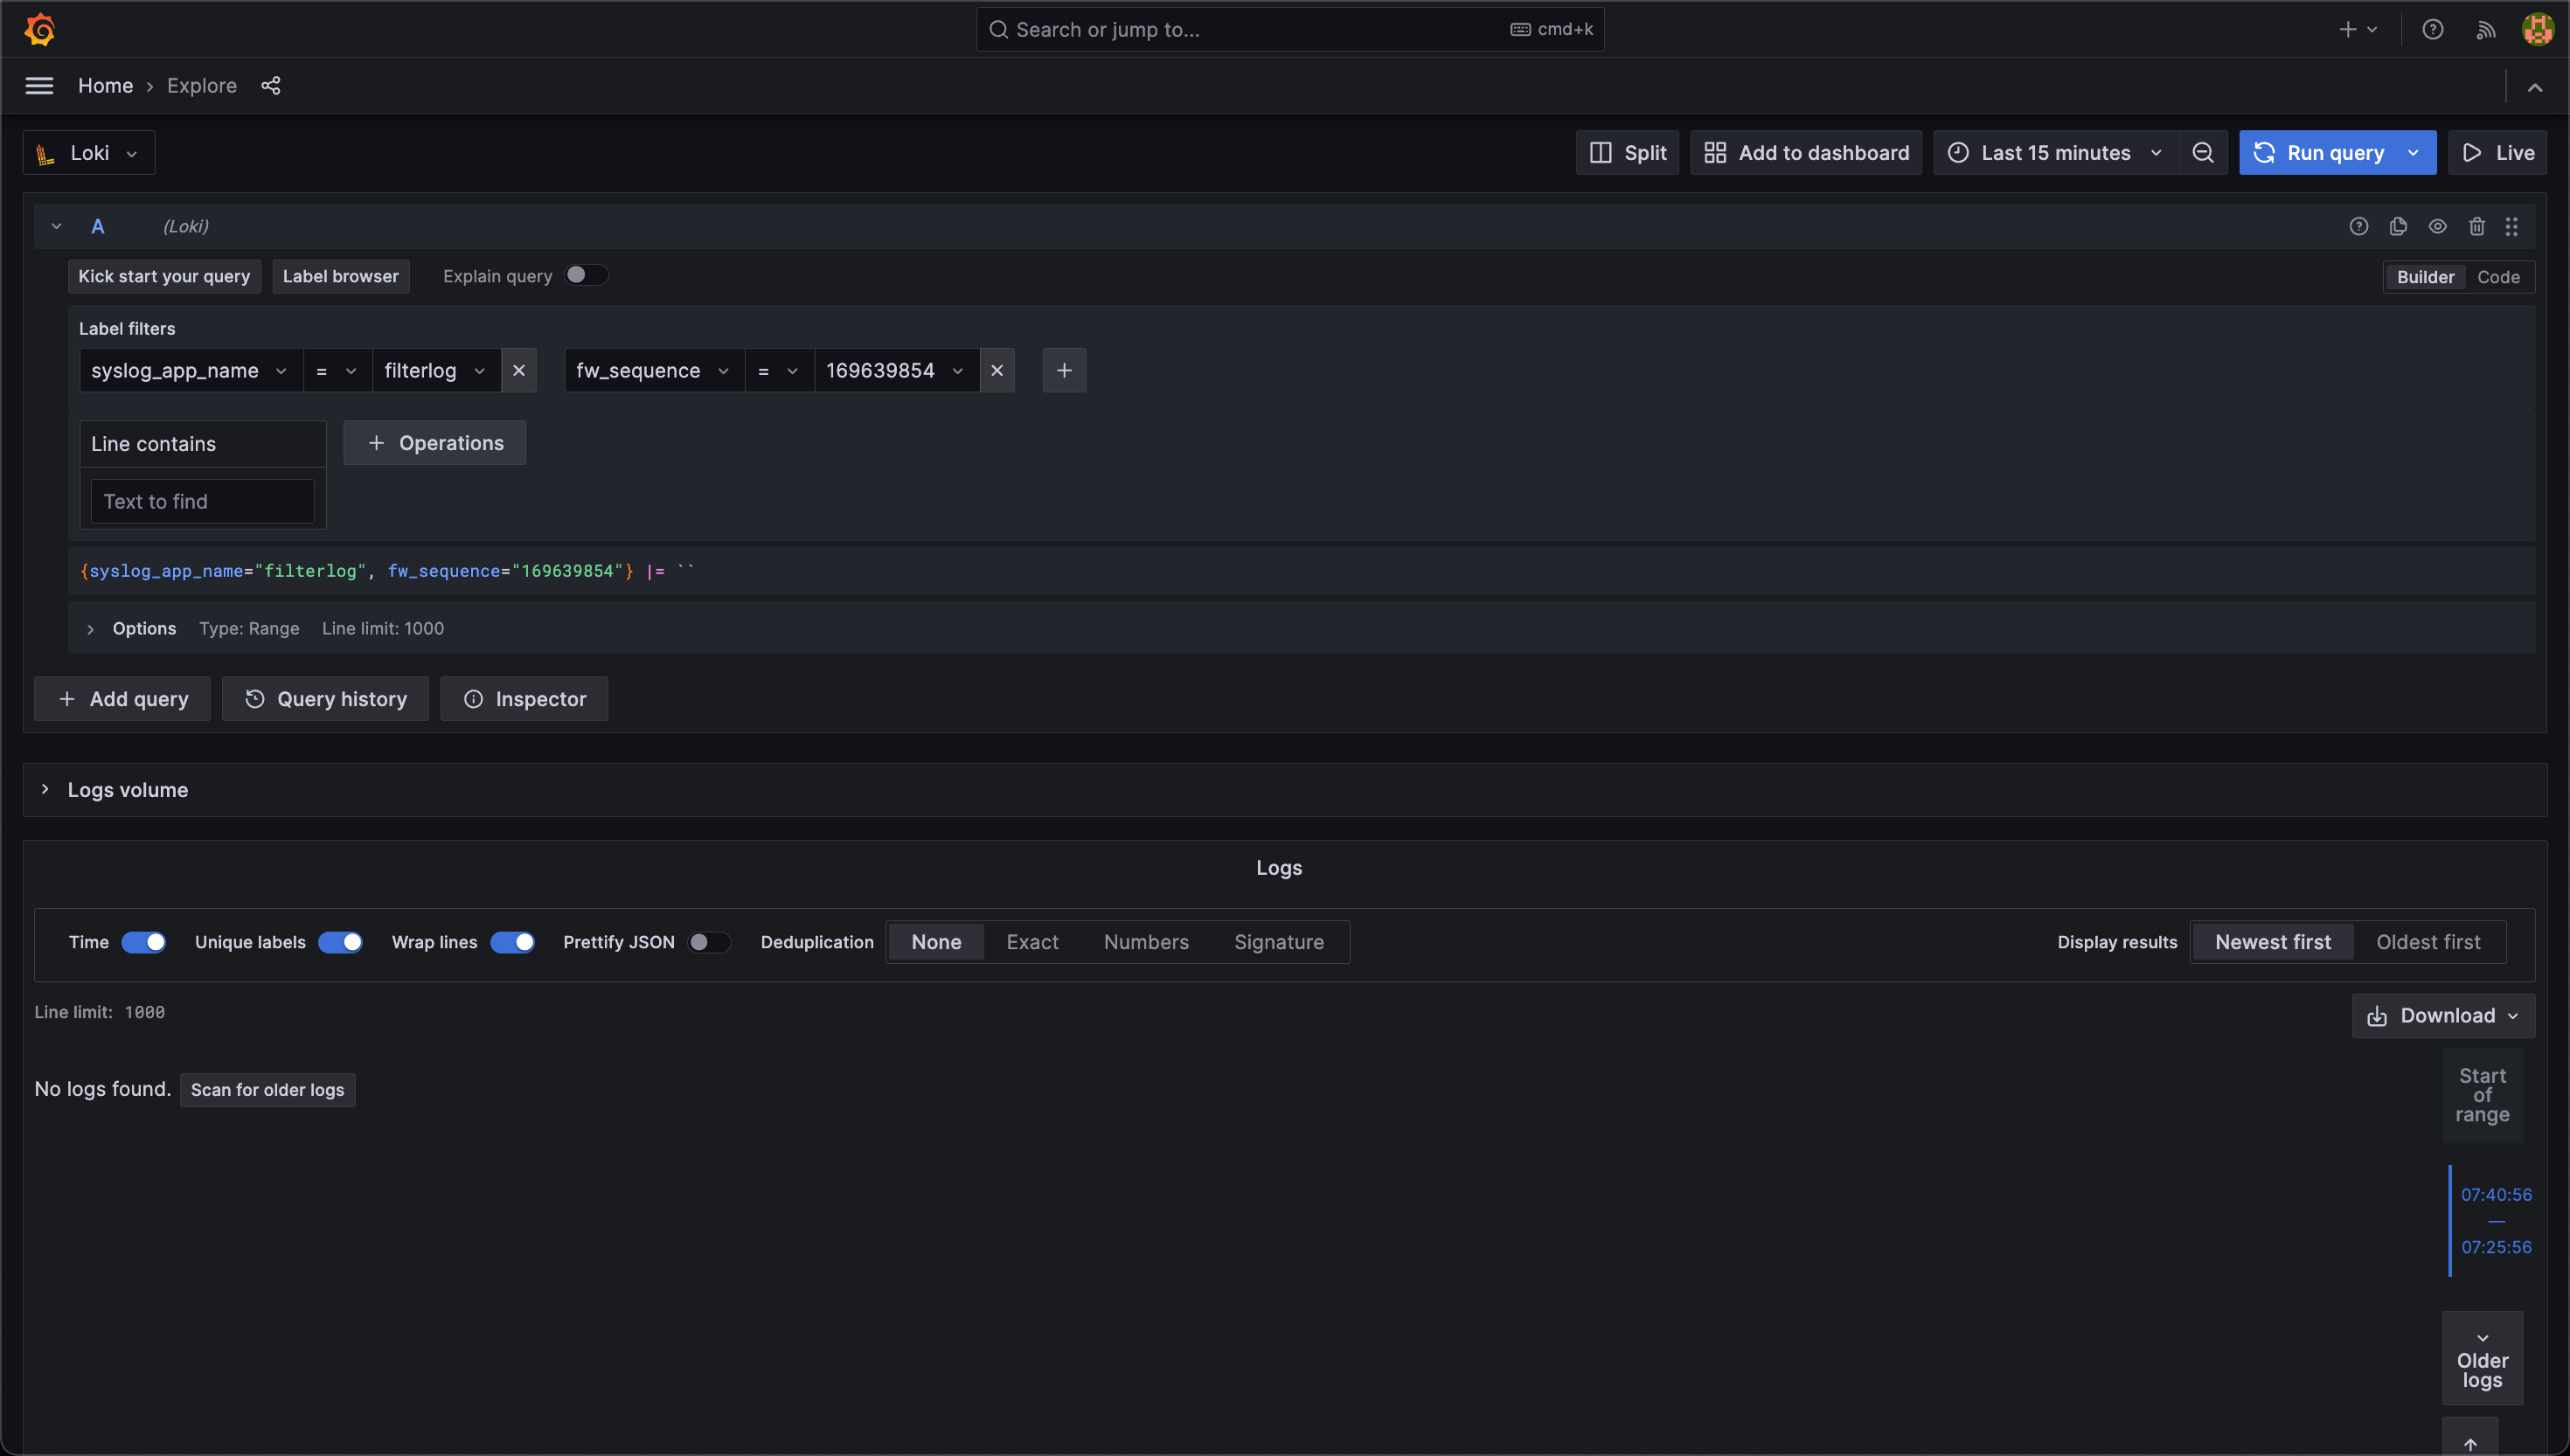
We can however use it with a Label filter expression
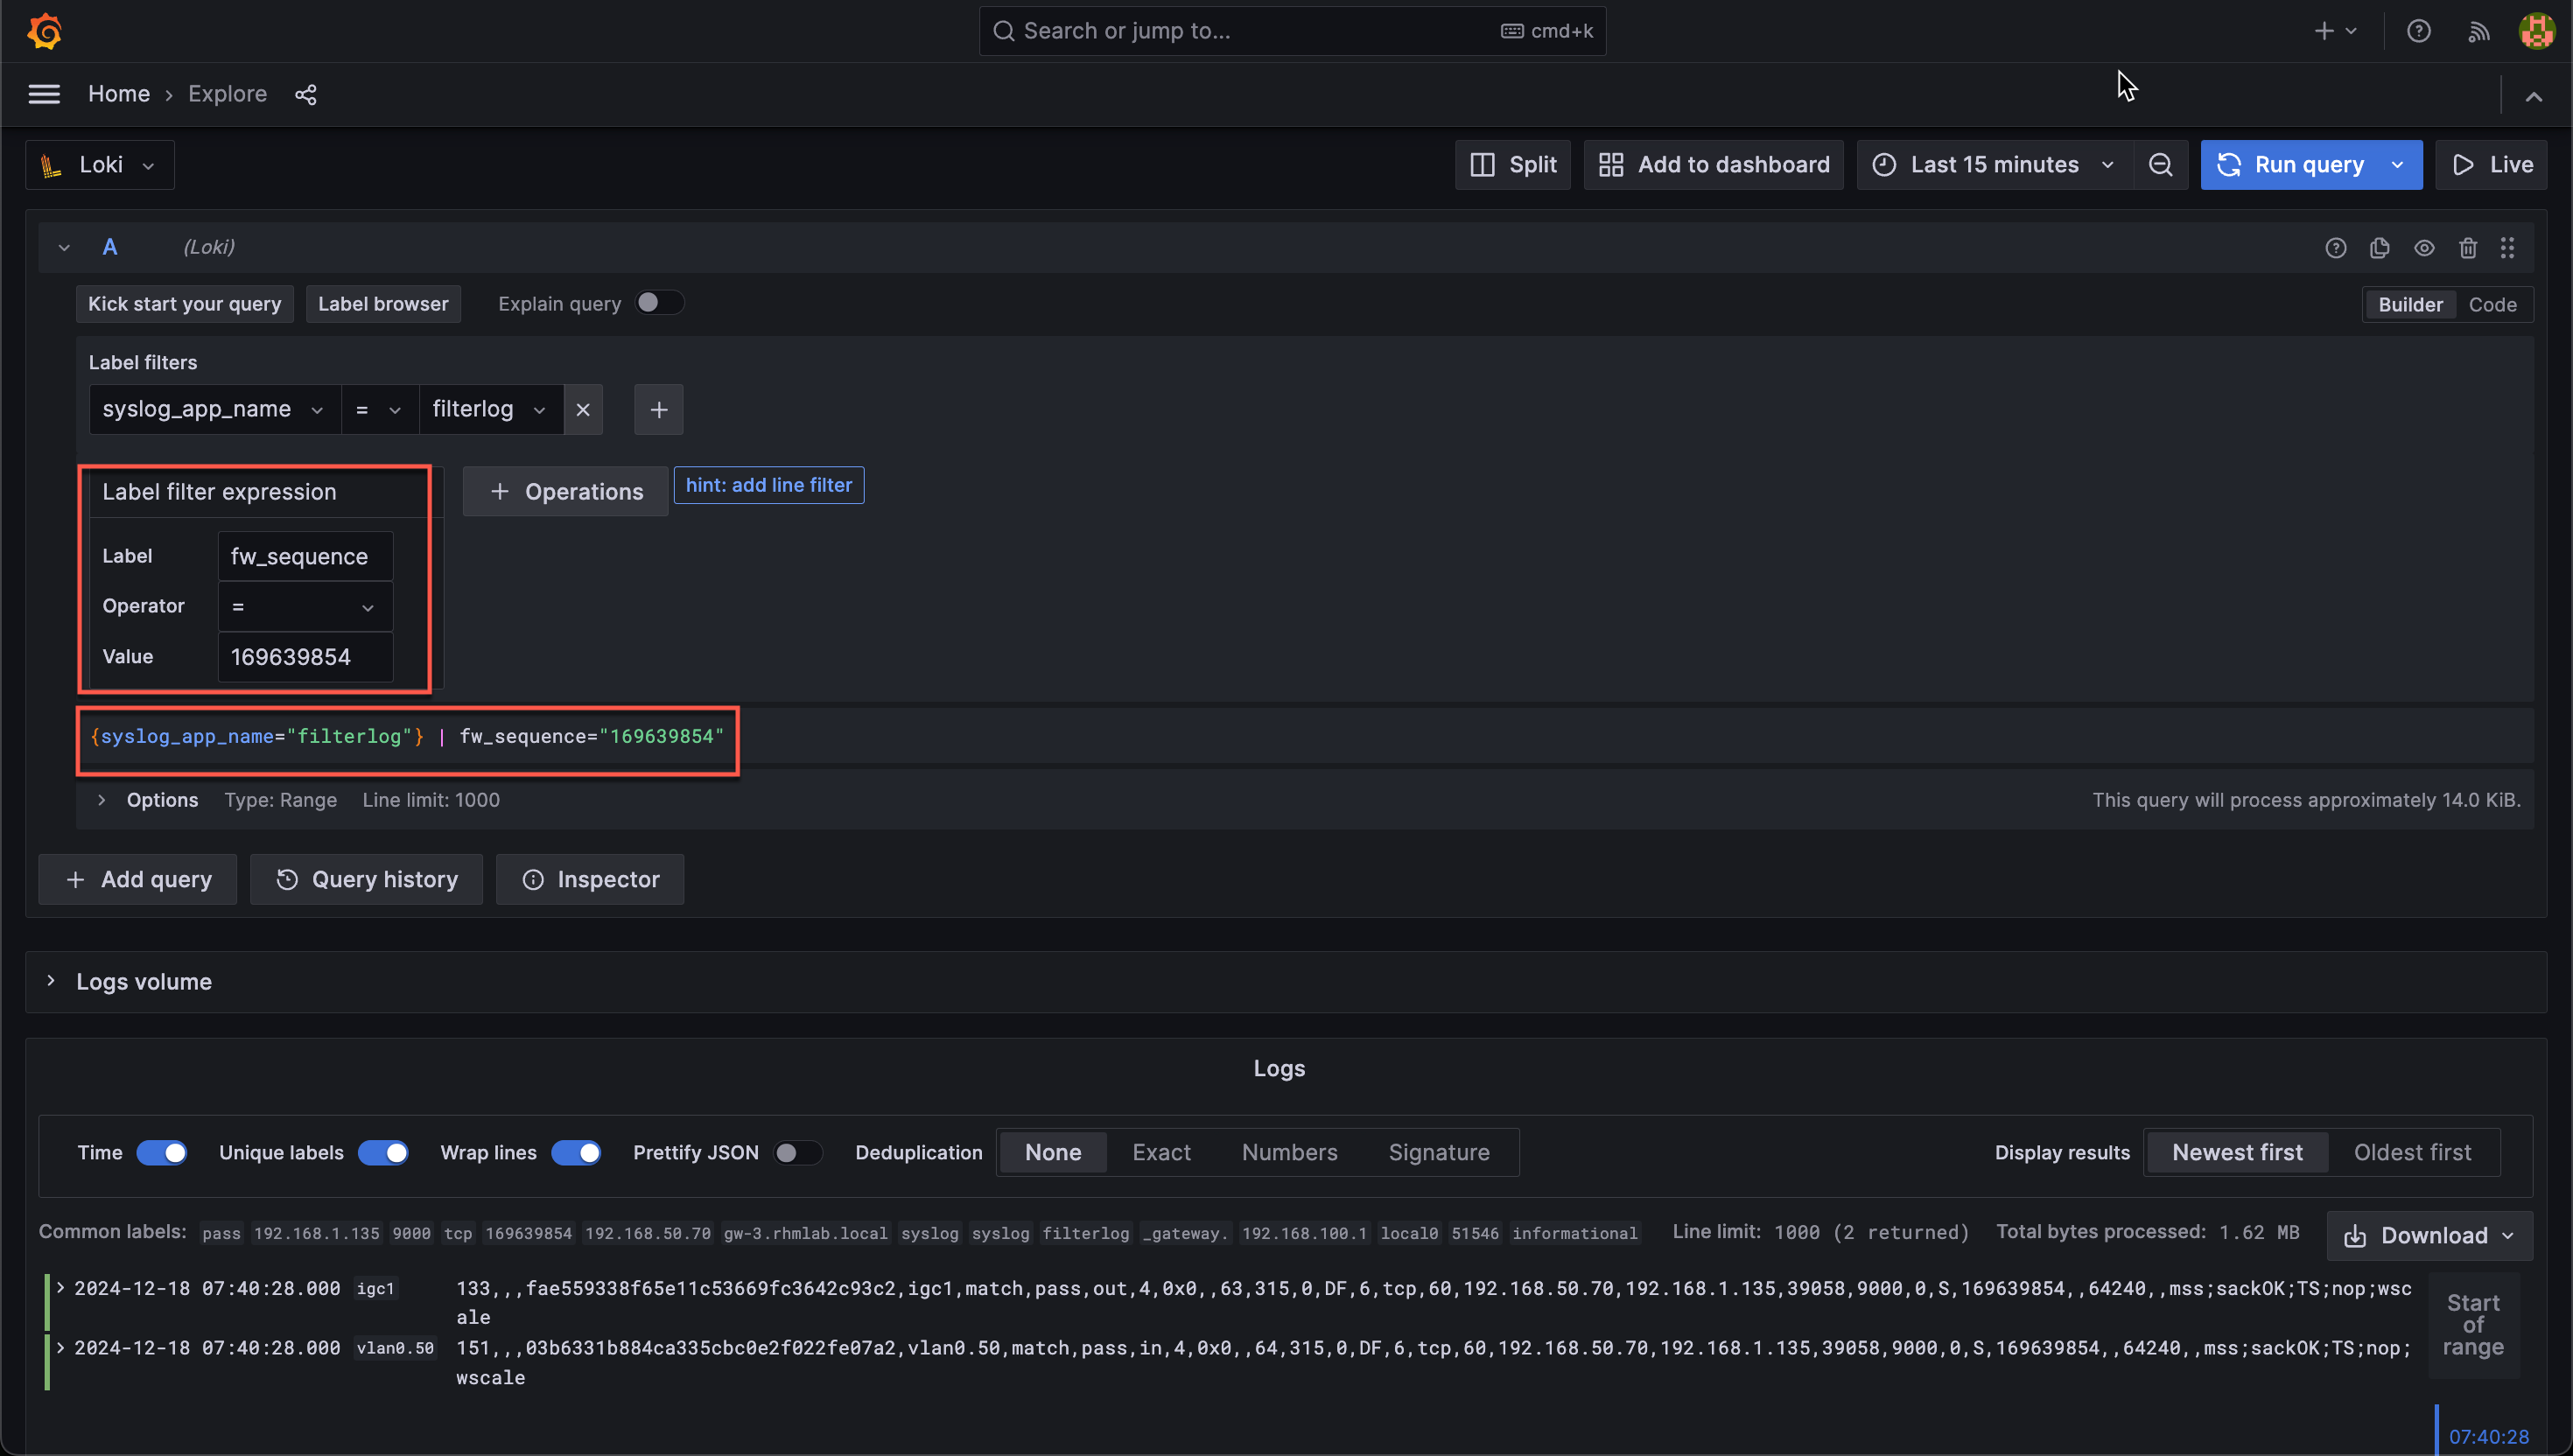
This is fine in my use case, since I won't use the sequence for doing visualizations directly. It's meant to be used for filtering log lines
Use structured metadata in dashboard
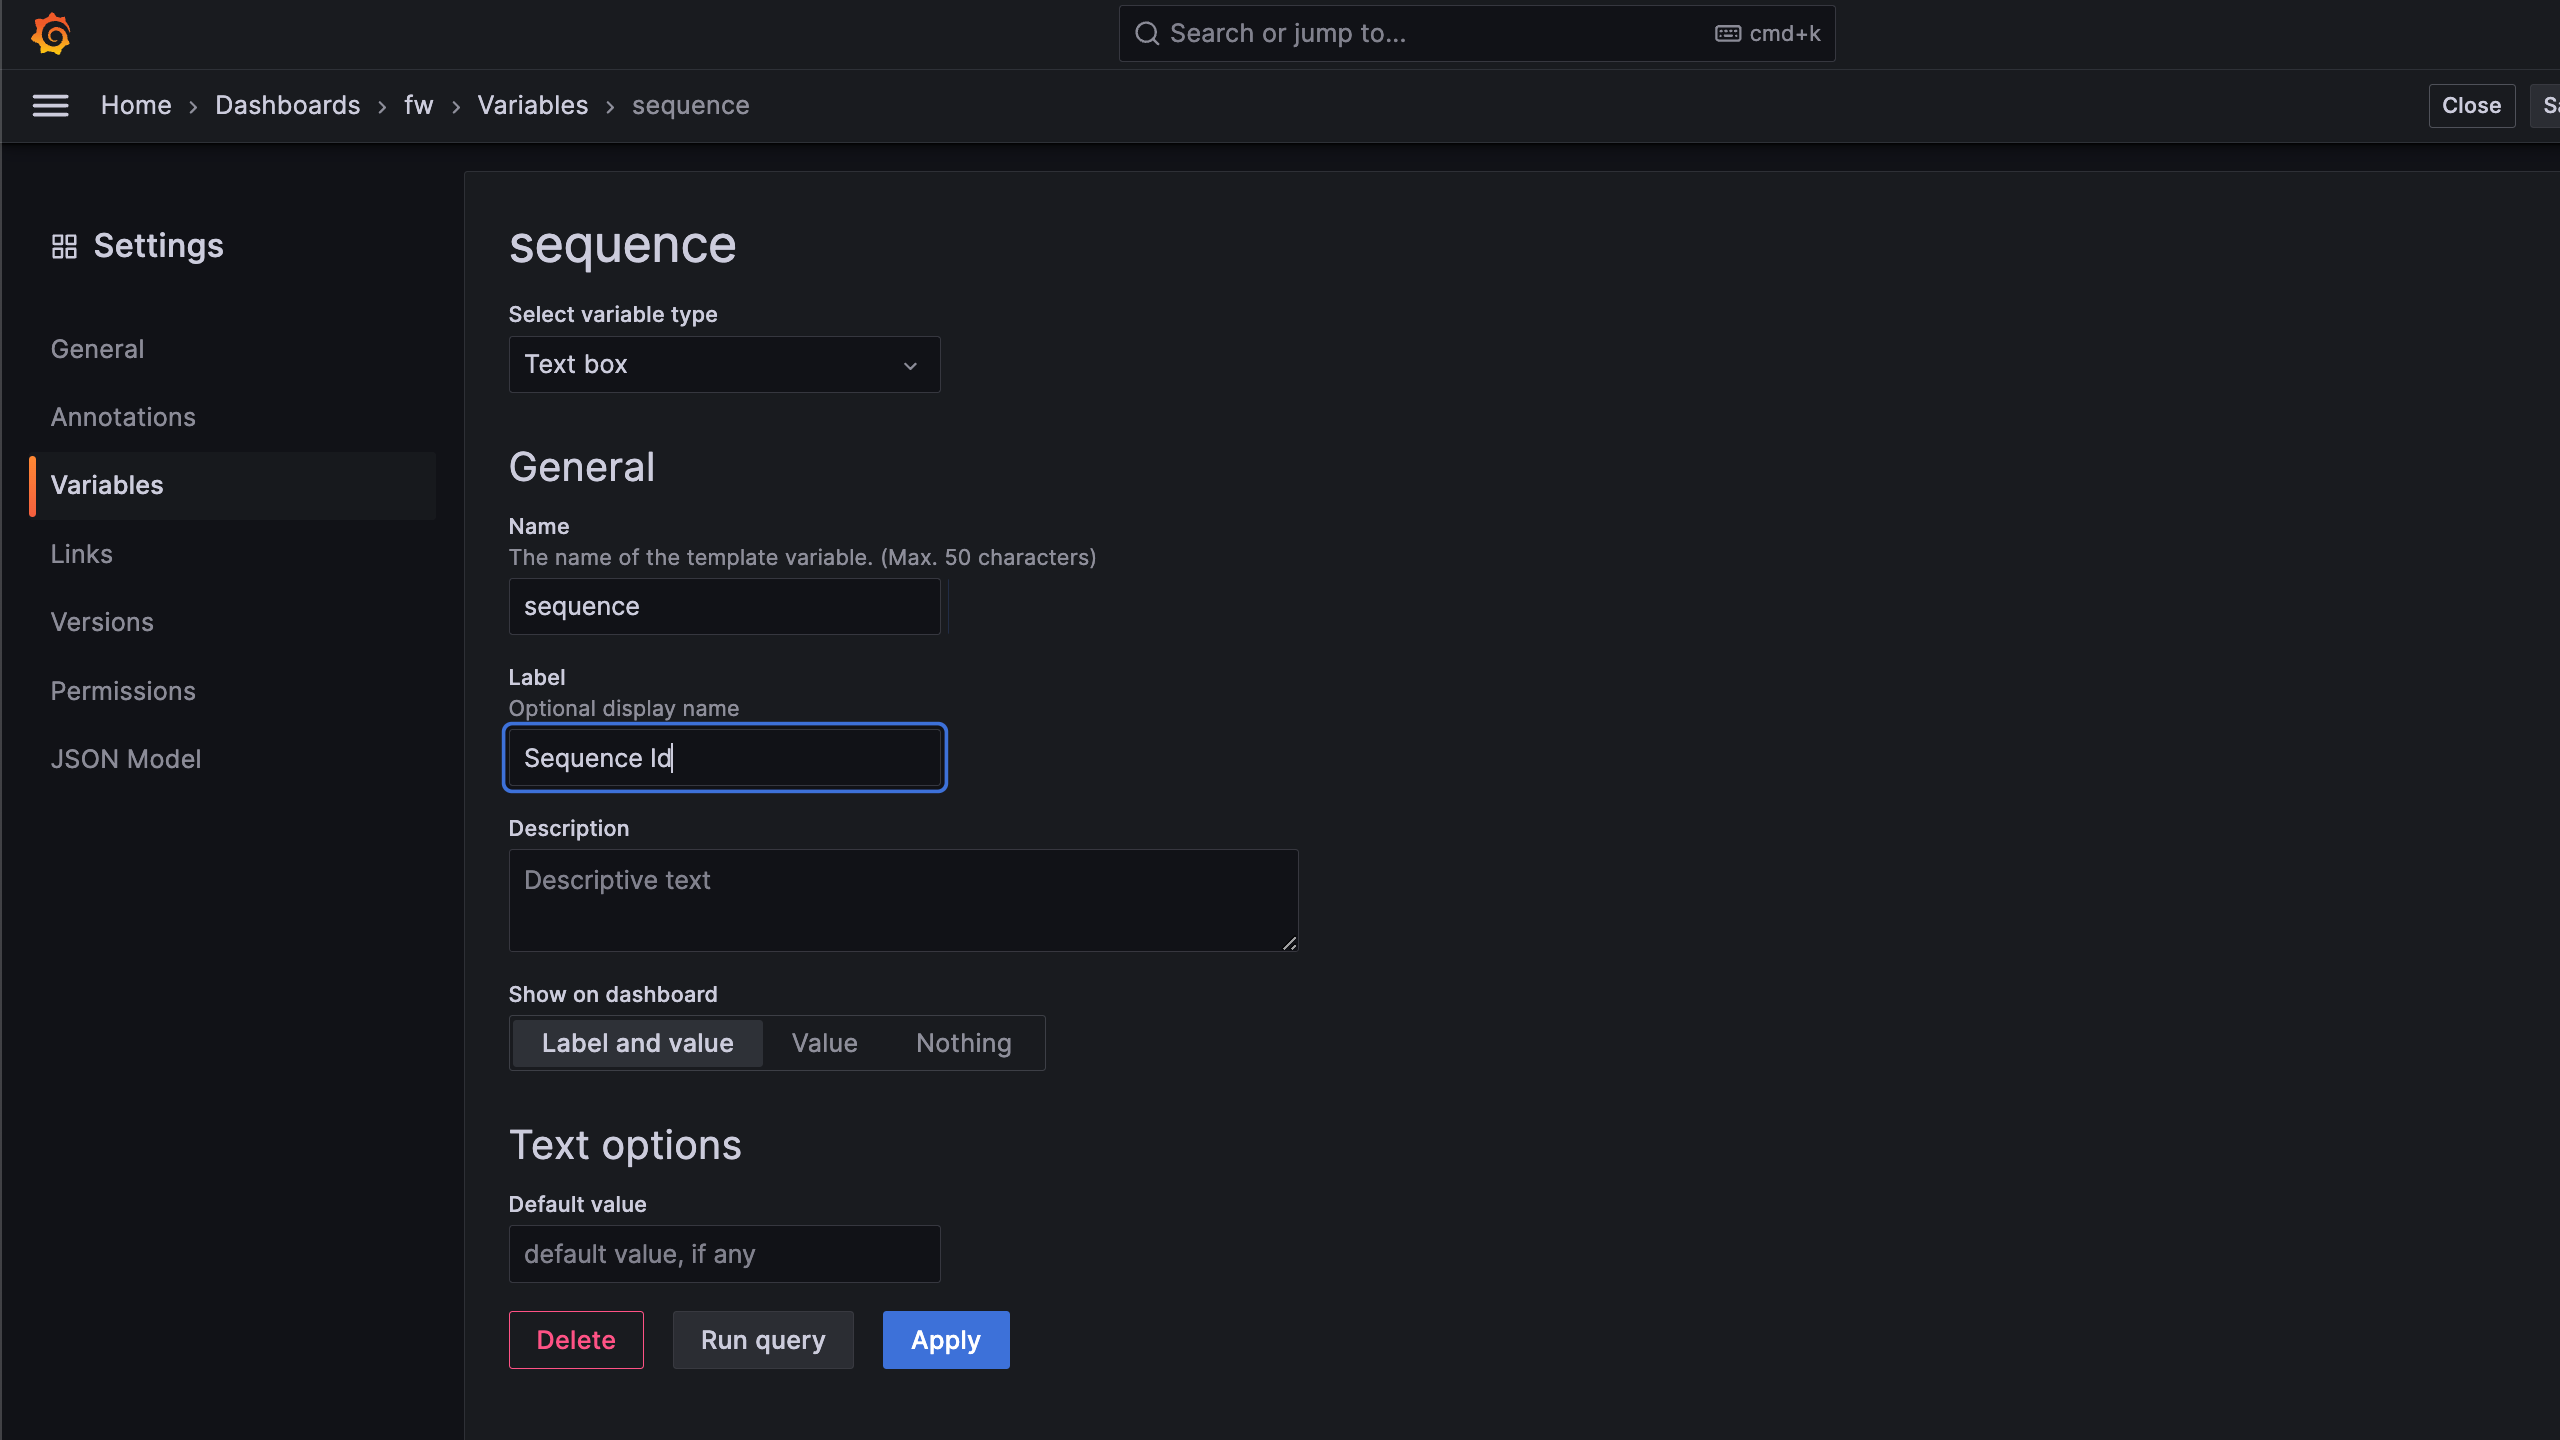
Create a variable to hold the sequence to search for
Now we can update our visualizations to include this variable in our filtering
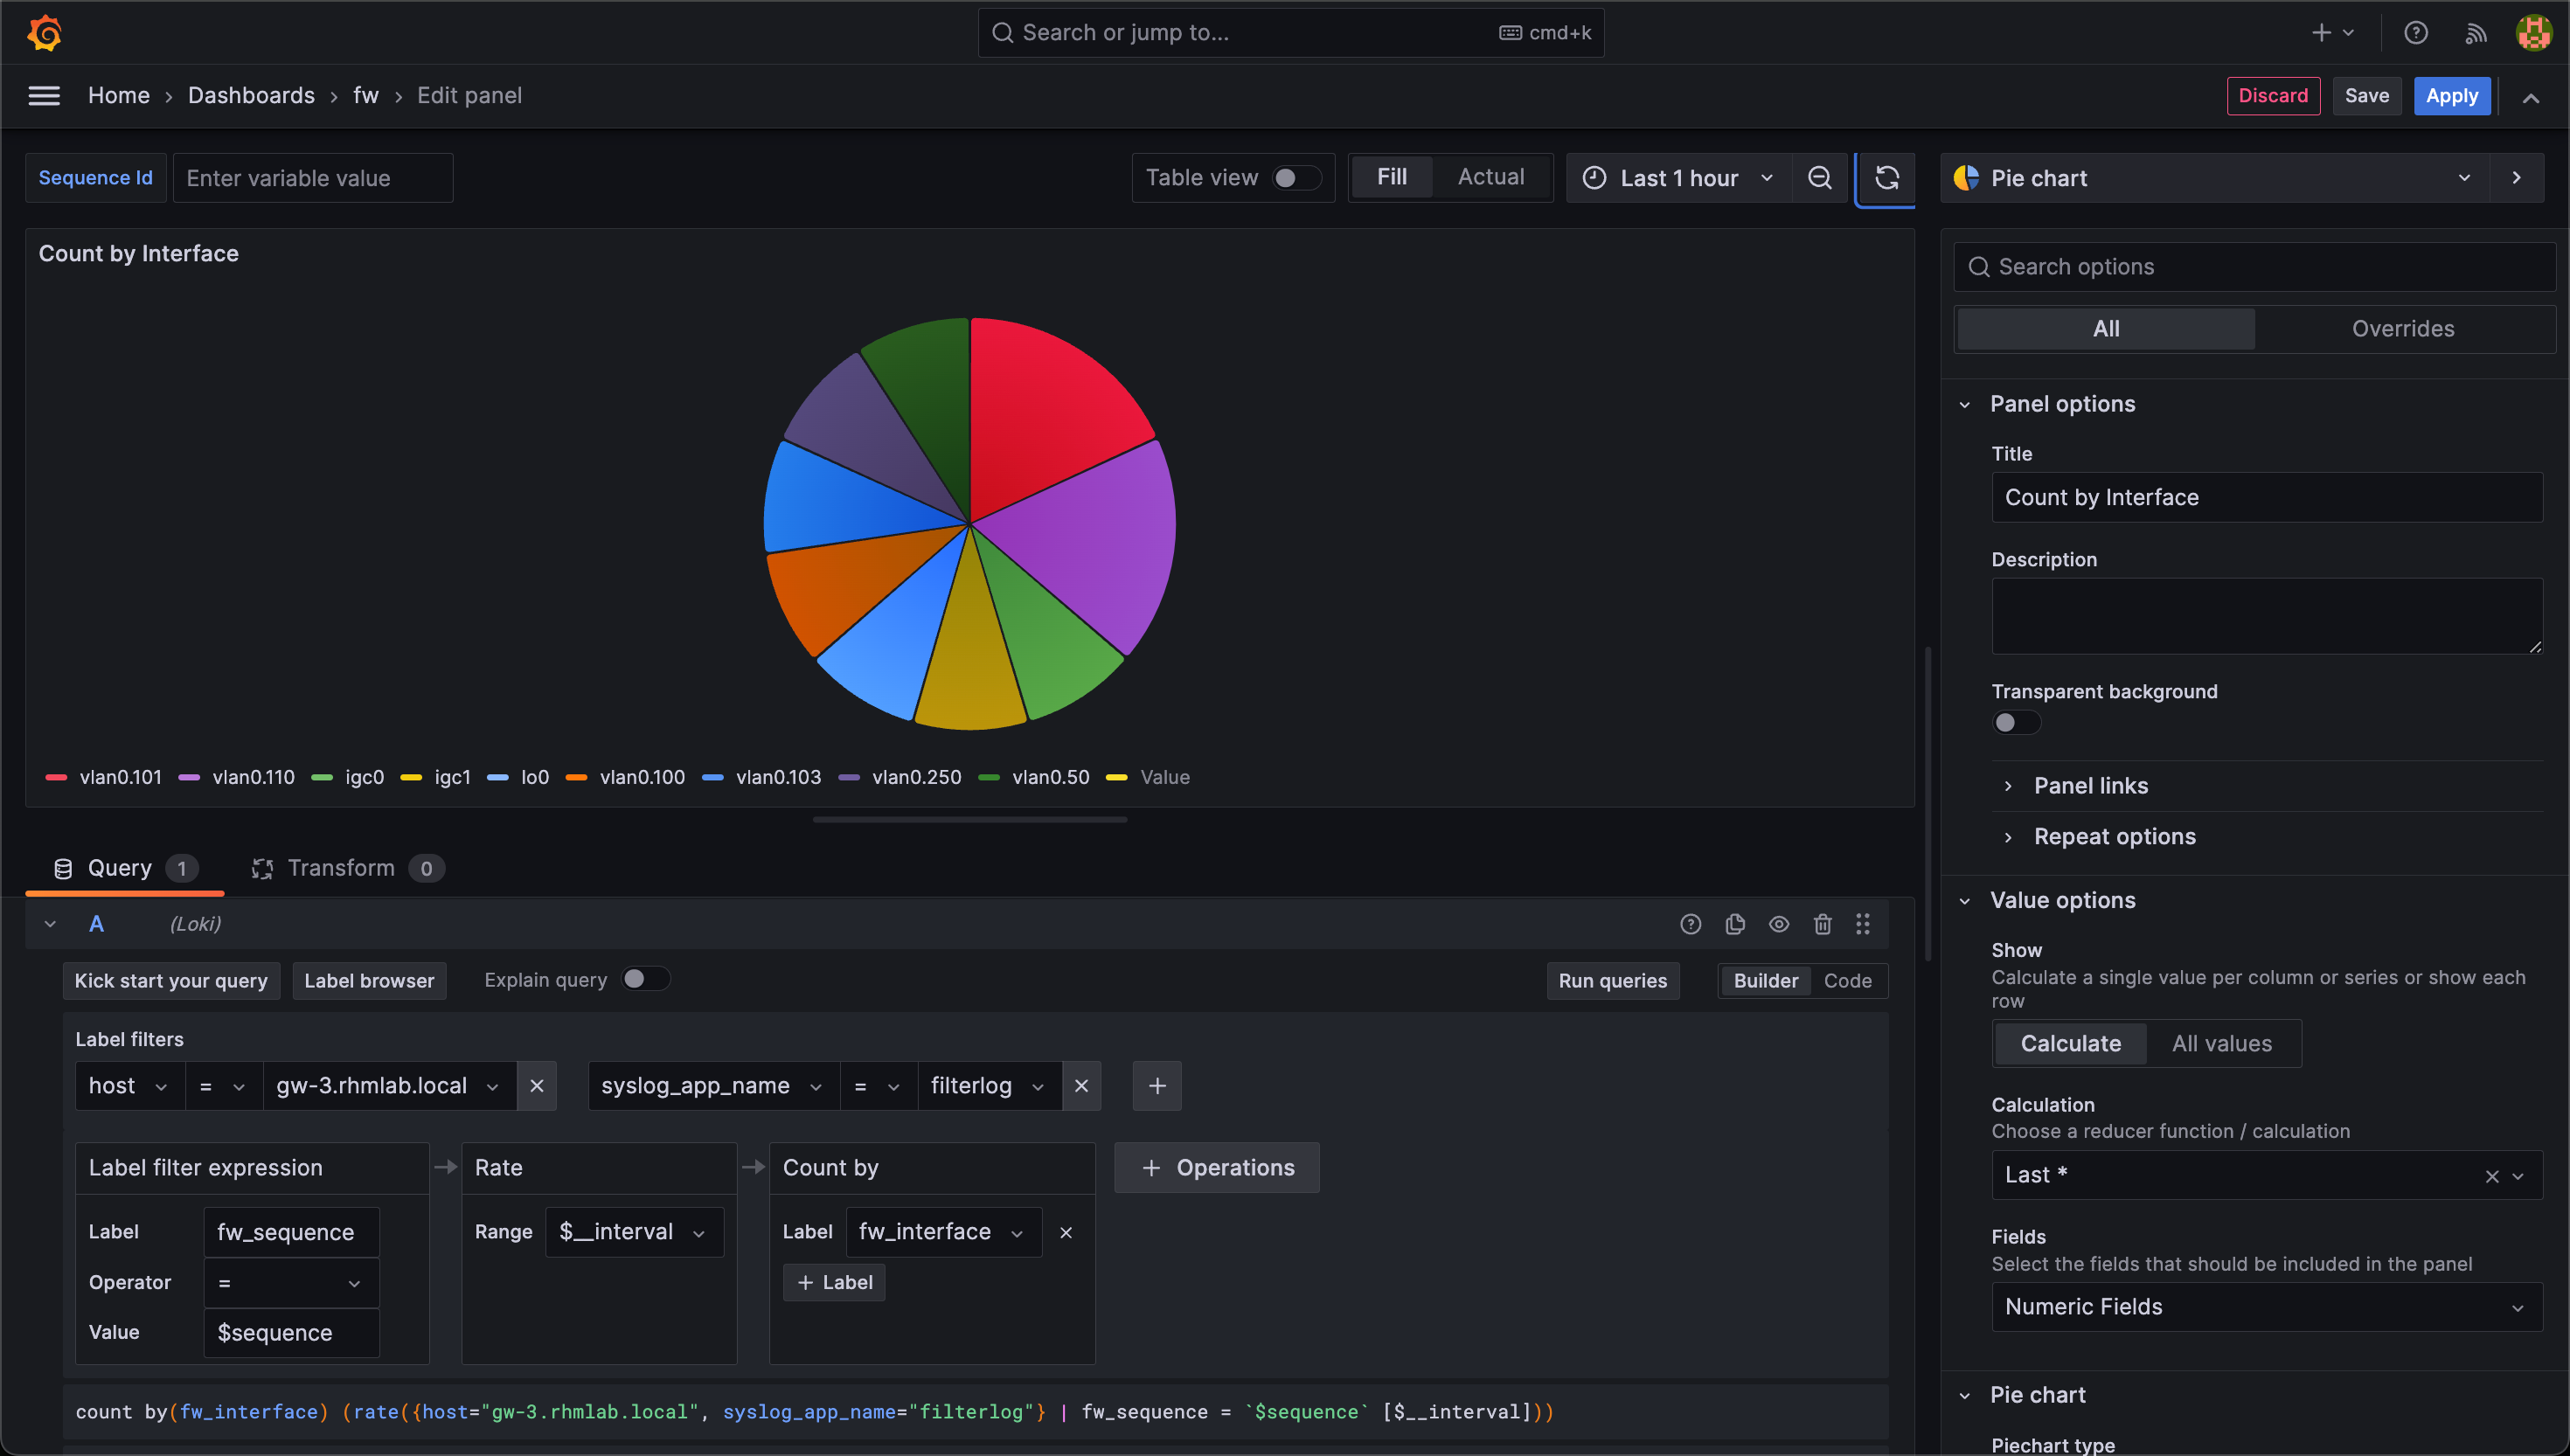
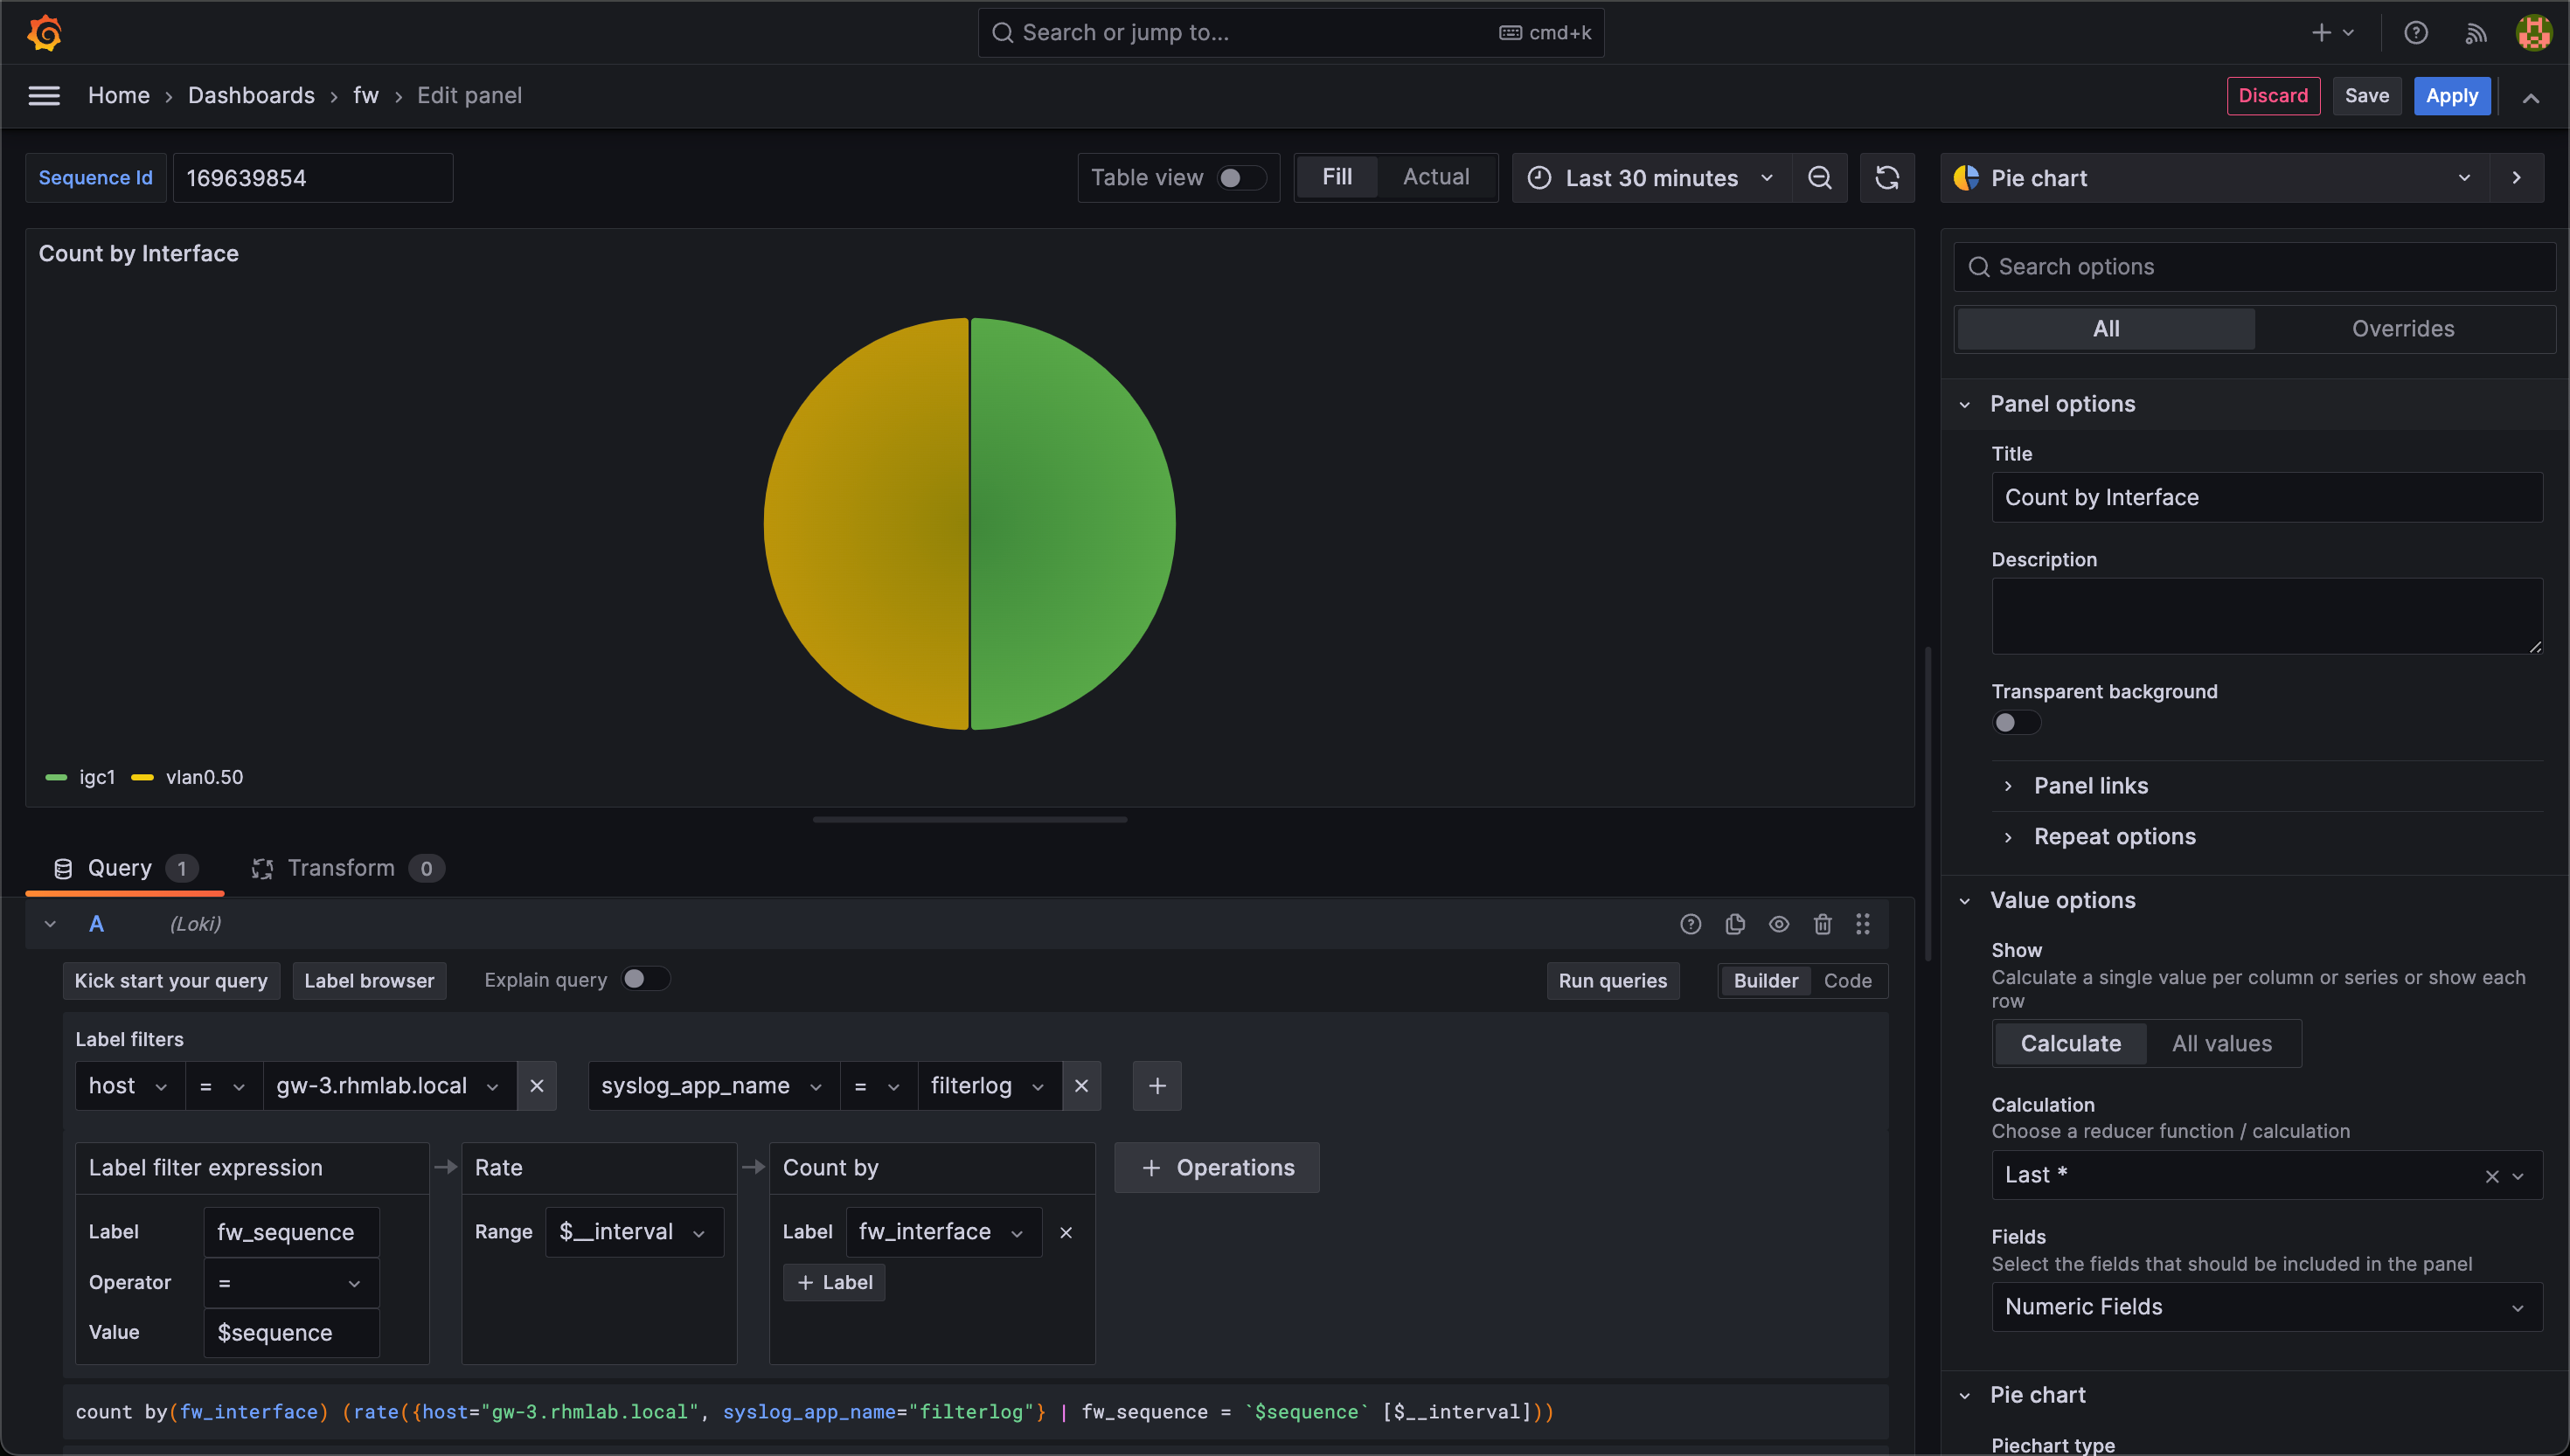
After adding our sequence id to the variable our visualization changes
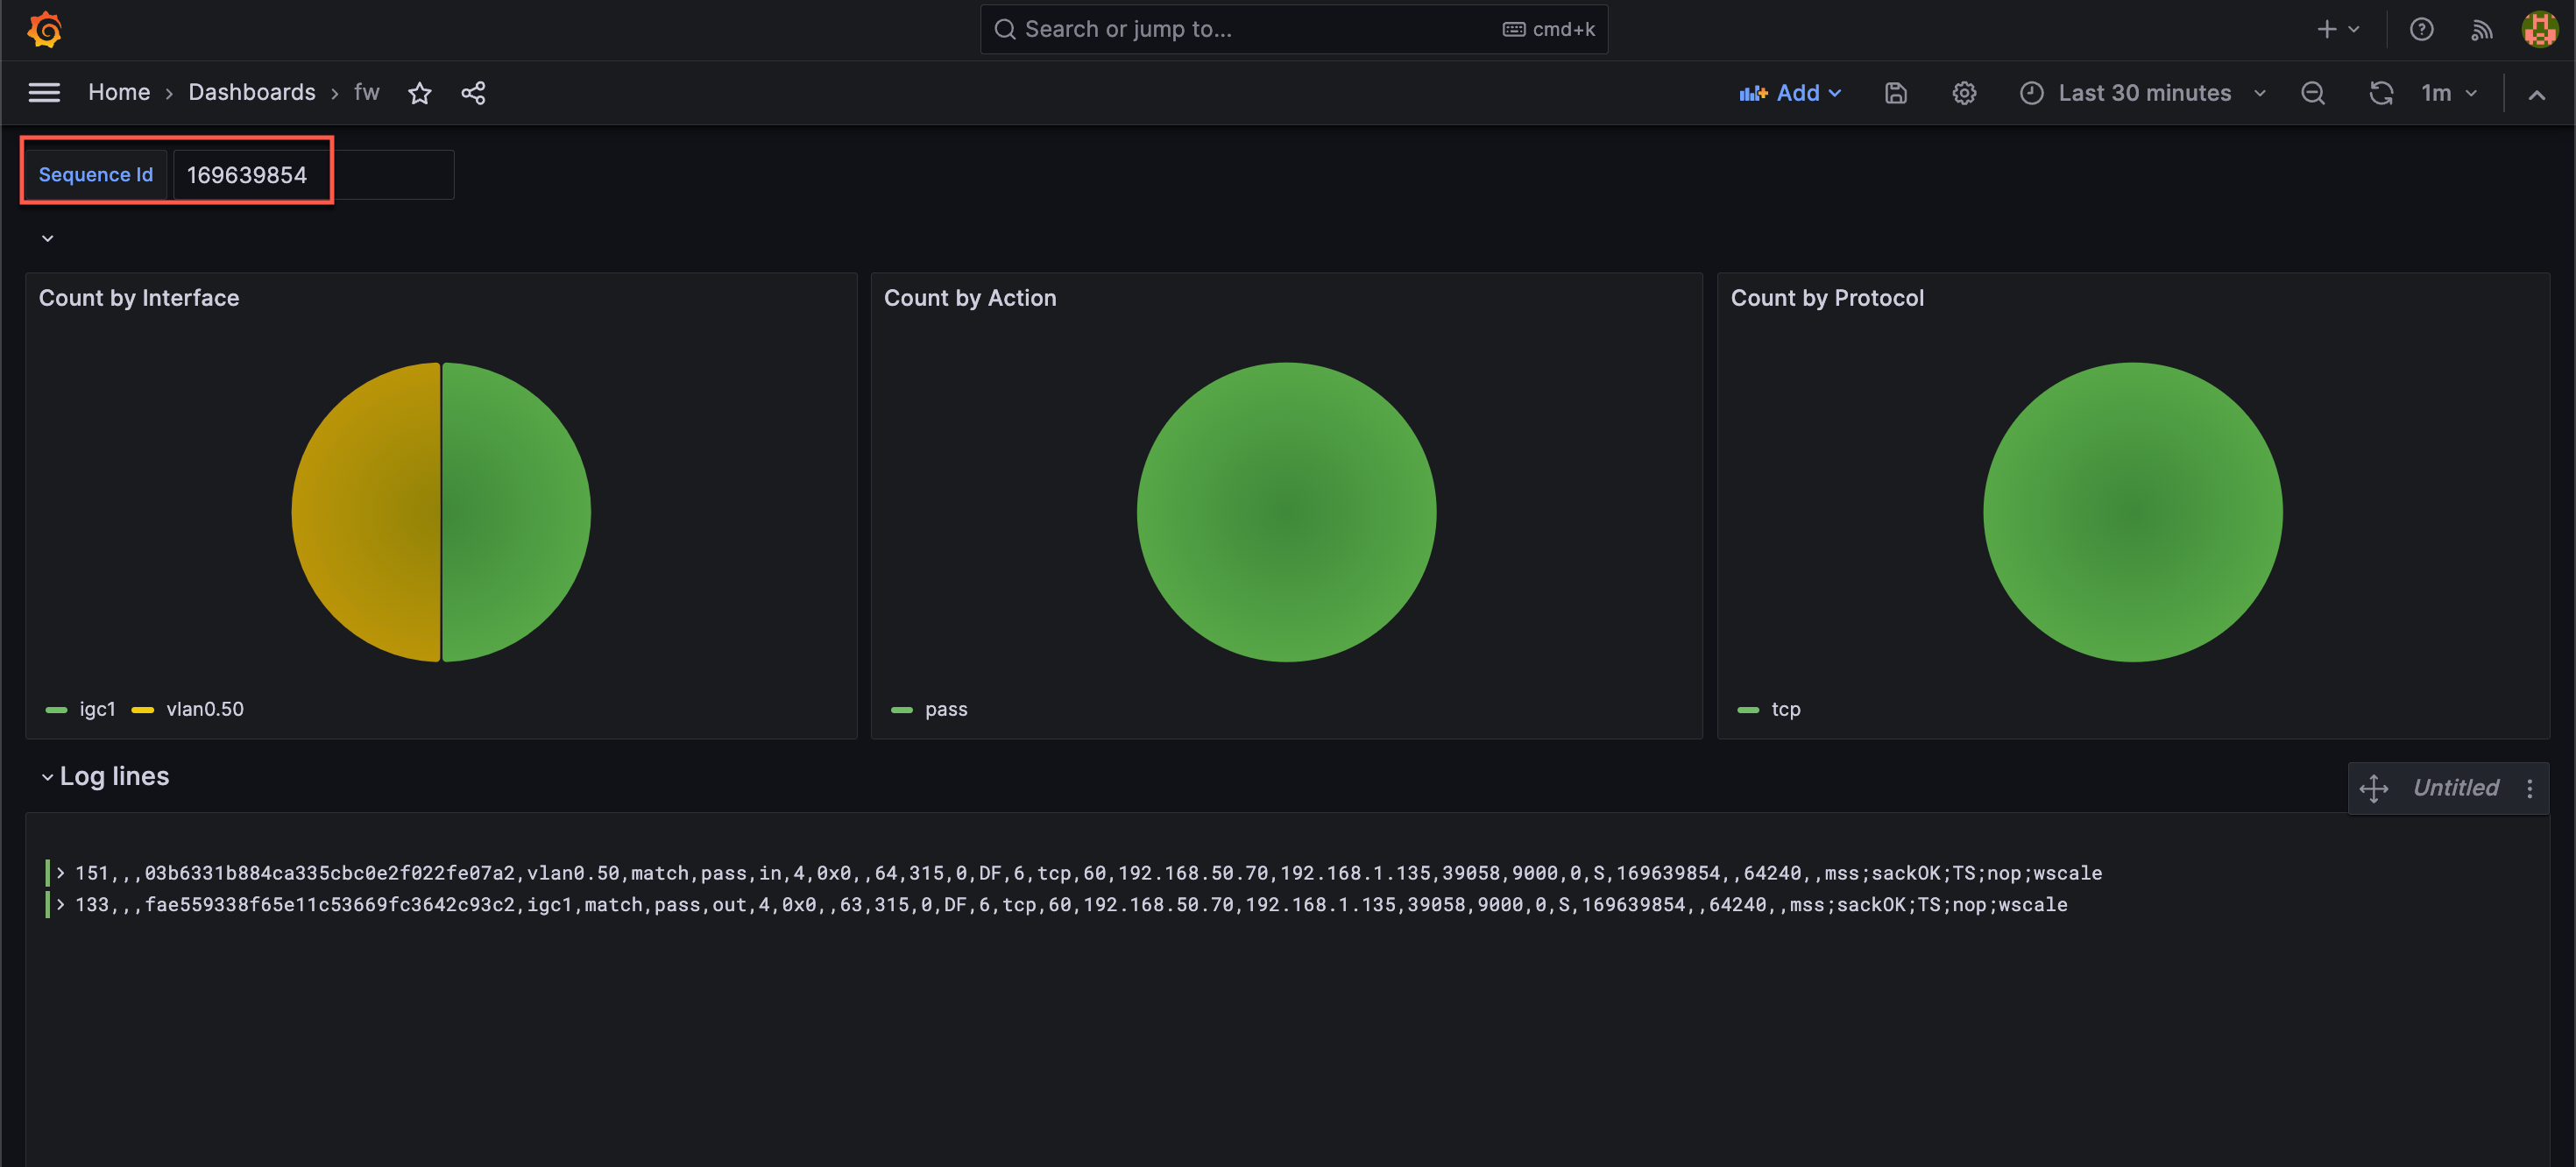
And after updating all our visualizations our dashboard now can be fully filtered on a specific sequence id
Summary
This post has shown how to utilize structured metadata to add labels to log lines in Loki. I was a bit surprised that I had to use it in a Label filter expression so that is something to be aware of when working with labels in Loki.
As mentioned both in this post and the previous post on this topic, use labels wisely in Loki as it is built for indexing log metadata and not the content itself.
Please feel free to reach out if you have any comments and questions