Visualizing OPNsense firewall logs with Grafana Loki
This post is a write up of how I've set up forwarding of firewall logs from OPNsense to Grafana Loki. We'll not go through the installation of the components, please refer to the documentation referenced below.
Grafana Loki is a set of open source components that can be composed into a fully featured logging stack
From the Grafana website
So the components in play here are all installed on an Ubuntu server. We have Loki it self which is where the logs ends up and gets indexed. In front of Loki we have Promtail which is the component that receives the logs from OPNsense before they get shipped to Loki.
Promtail is also where we parse the received log lines and attach labels to them before they're finally pushed to Loki. For visualizing the logs we're using Grafana

Loki is built around indexing the metadata about the logs instead of the contents which most other logging systems do. This makes Loki very cost effective, but this also results in fewer labels to search for and filter around when dealing with logs. To work with logs the idea is to parse and query them as you'd do with Prometheus metrics.
In the example in this blog post I am adding a few labels to the logs received from the firewall which is kind of going against this principle
I have set up Promtail as a syslog target and it's already used for more than just the OPNsense logs, but as we'll see in the configuration towards the end of this blog post we'll parse and add labels to the firewall logs specifically.
The Promtail config below has one scrape config which is where most of the interesting stuff is happening. The scrape specifies a syslog job with a listen_address which will in fact tell Promtail to start listening for log streams on that address and port. As mentioned, at this point there's nothing done in particular for the firewall logs
 1server:
 2  http_listen_port: 9080
 3  grpc_listen_port: 0
 4
 5positions:
 6  filename: /tmp/positions.yaml
 7
 8clients:
 9  - url: http://localhost:3100/loki/api/v1/push
10
11scrape_configs:
12
13- job_name: syslog
14  syslog:
15    listen_address: 0.0.0.0:1514
16    labels:
17      job: syslog
18    use_incoming_timestamp: true
19  relabel_configs:
20    - source_labels: [__syslog_message_hostname]
21      target_label: host
22    - source_labels: [__syslog_message_severity]
23      target_label: syslog_severity
24    - source_labels: [__syslog_message_severity]
25      target_label: level
26    - source_labels: [__syslog_message_app_name]
27      target_label: syslog_app_name
28    - source_labels: [__syslog_message_facility]
29      target_label: syslog_facility
30    - source_labels: [__syslog_message_msg_id]
31      target_label: syslog_msgid
32    - source_labels: [__syslog_message_proc_id]
33      target_label: syslog_procid
34    - source_labels: [__syslog_connection_ip_address]
35      target_label: syslog_connection_ip_address
36    - source_labels: [__syslog_connection_hostname]
37      target_label: syslog_connection_hostname
Before we look into the specific Promtail config for our firewall logs, we'll check out the logs in OPNsense and the config for remote logging
OPNsense logging
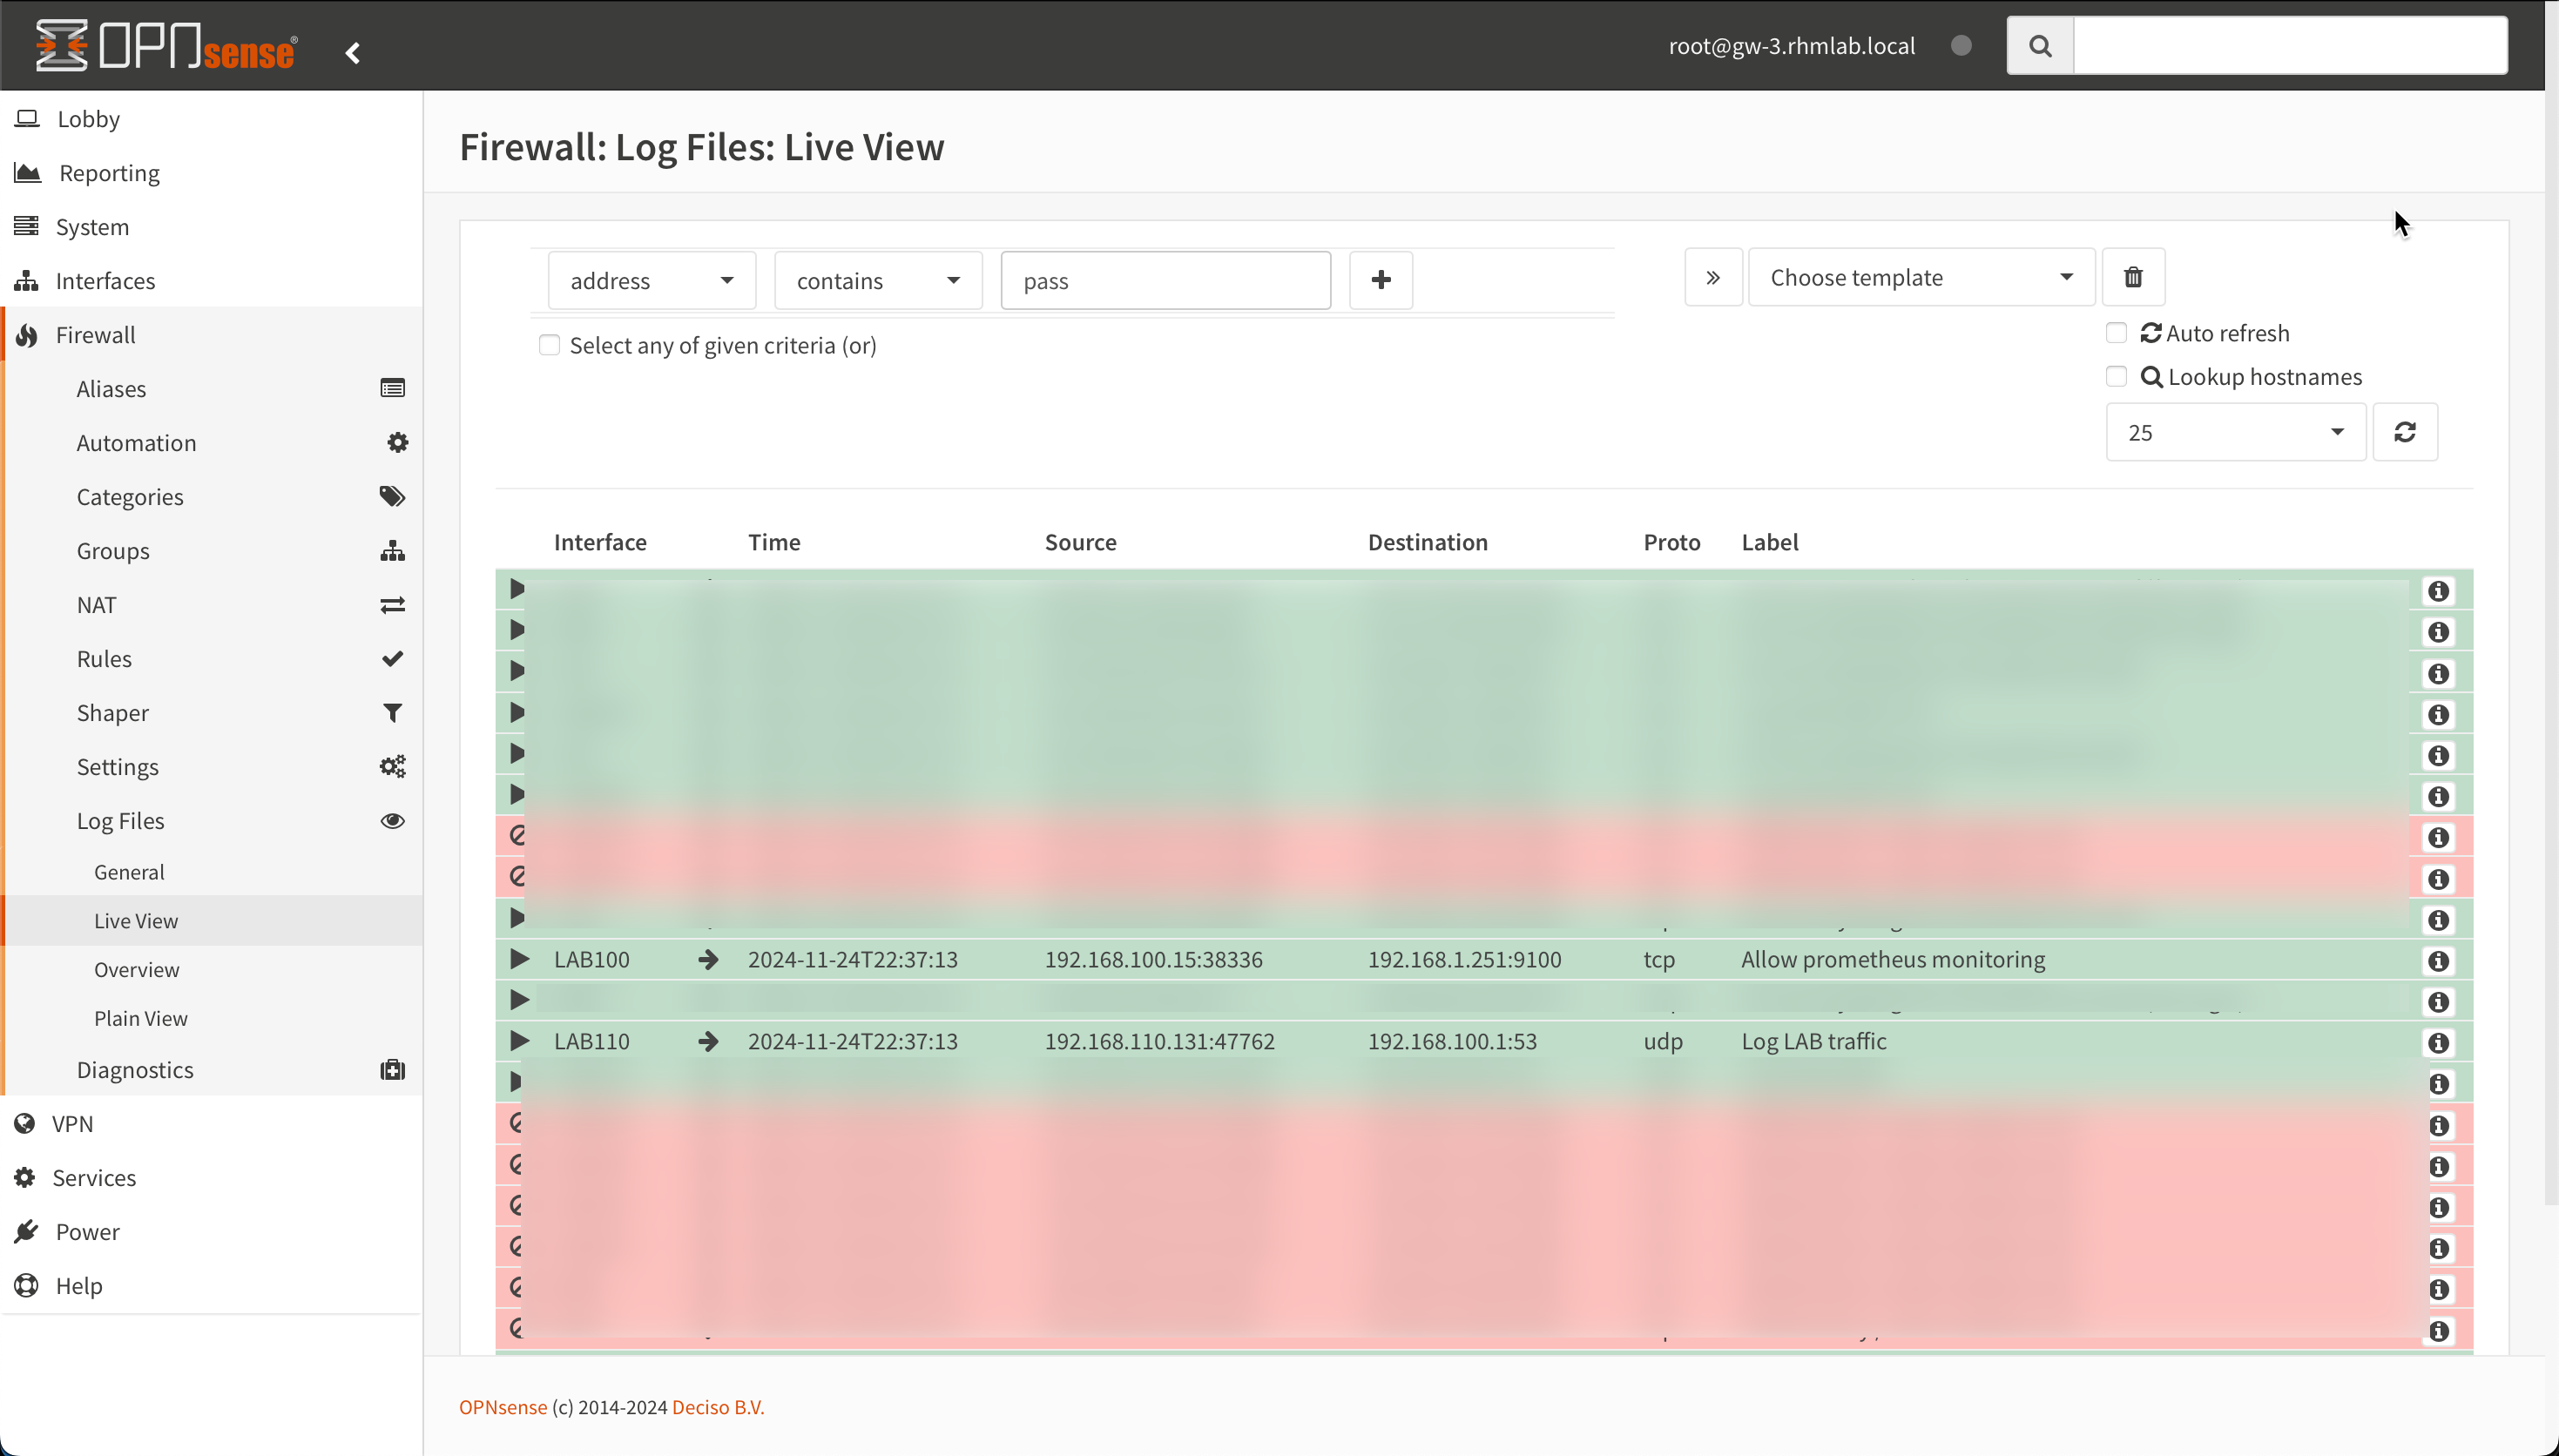
The Firewall logs Live view gives a nice view of matches to the logged rules
In the details of a log line we'll get more information
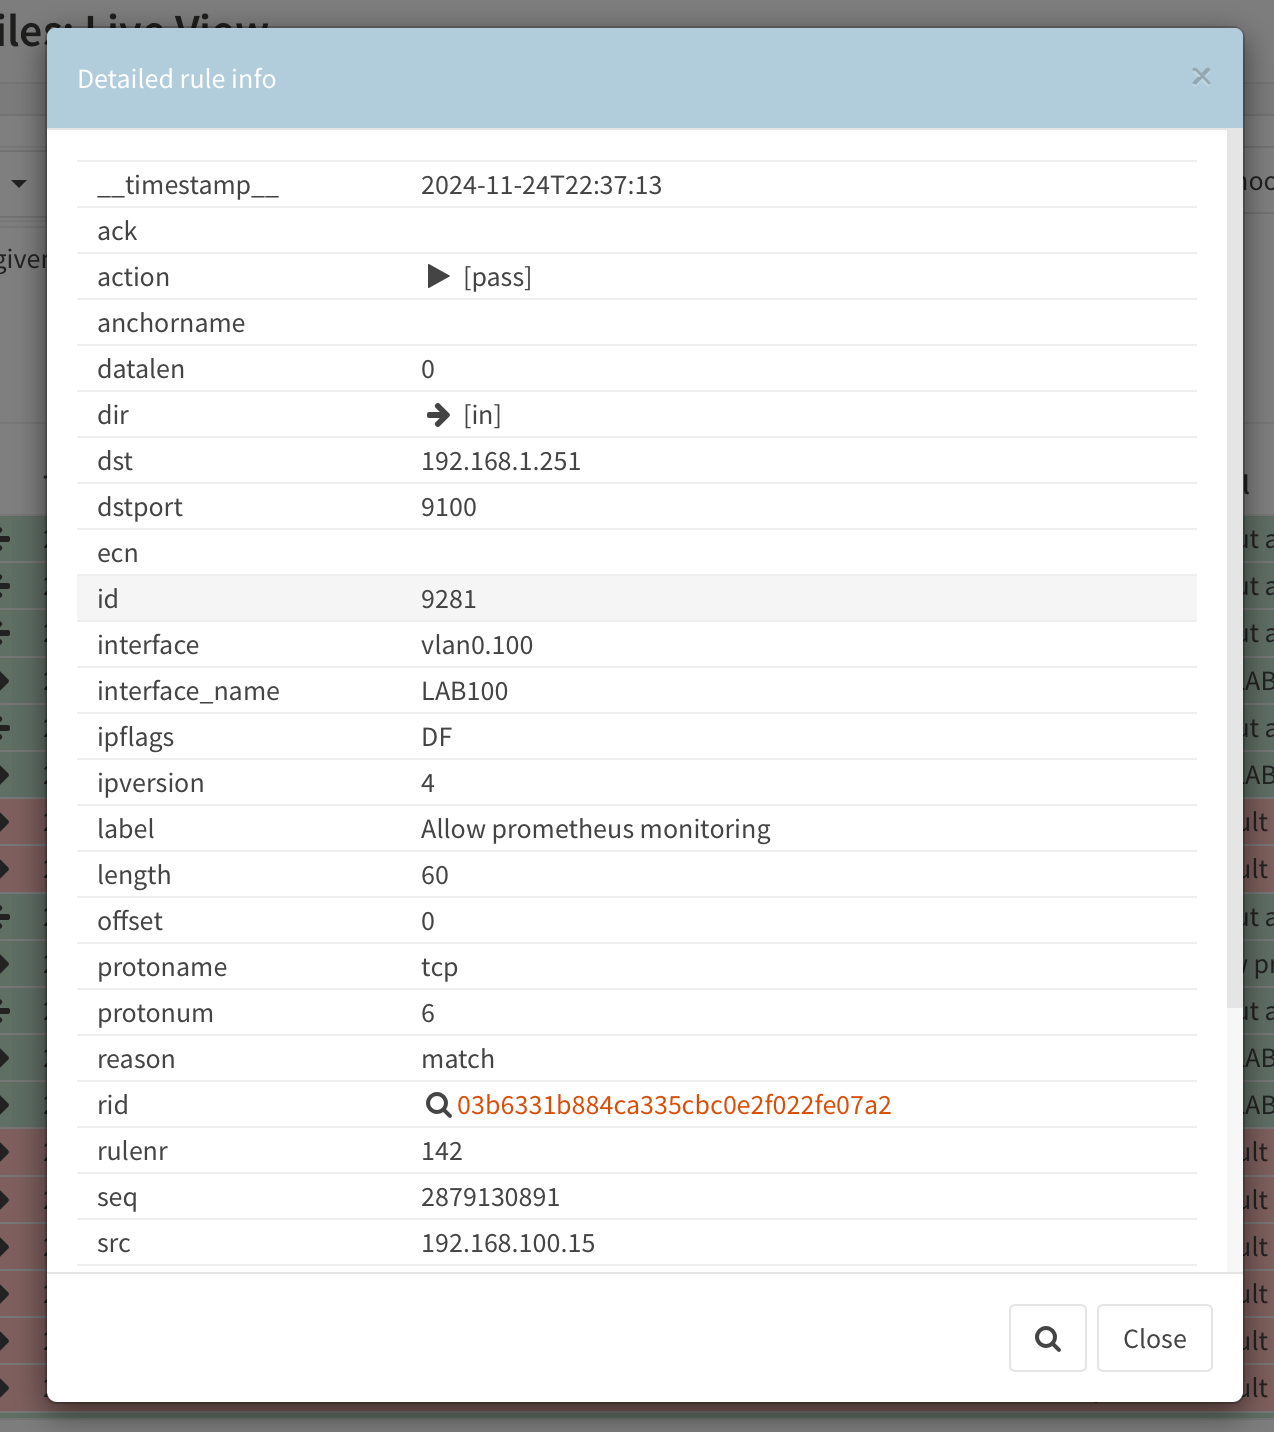
There's also a Plain view that resembles what we'll see in Loki

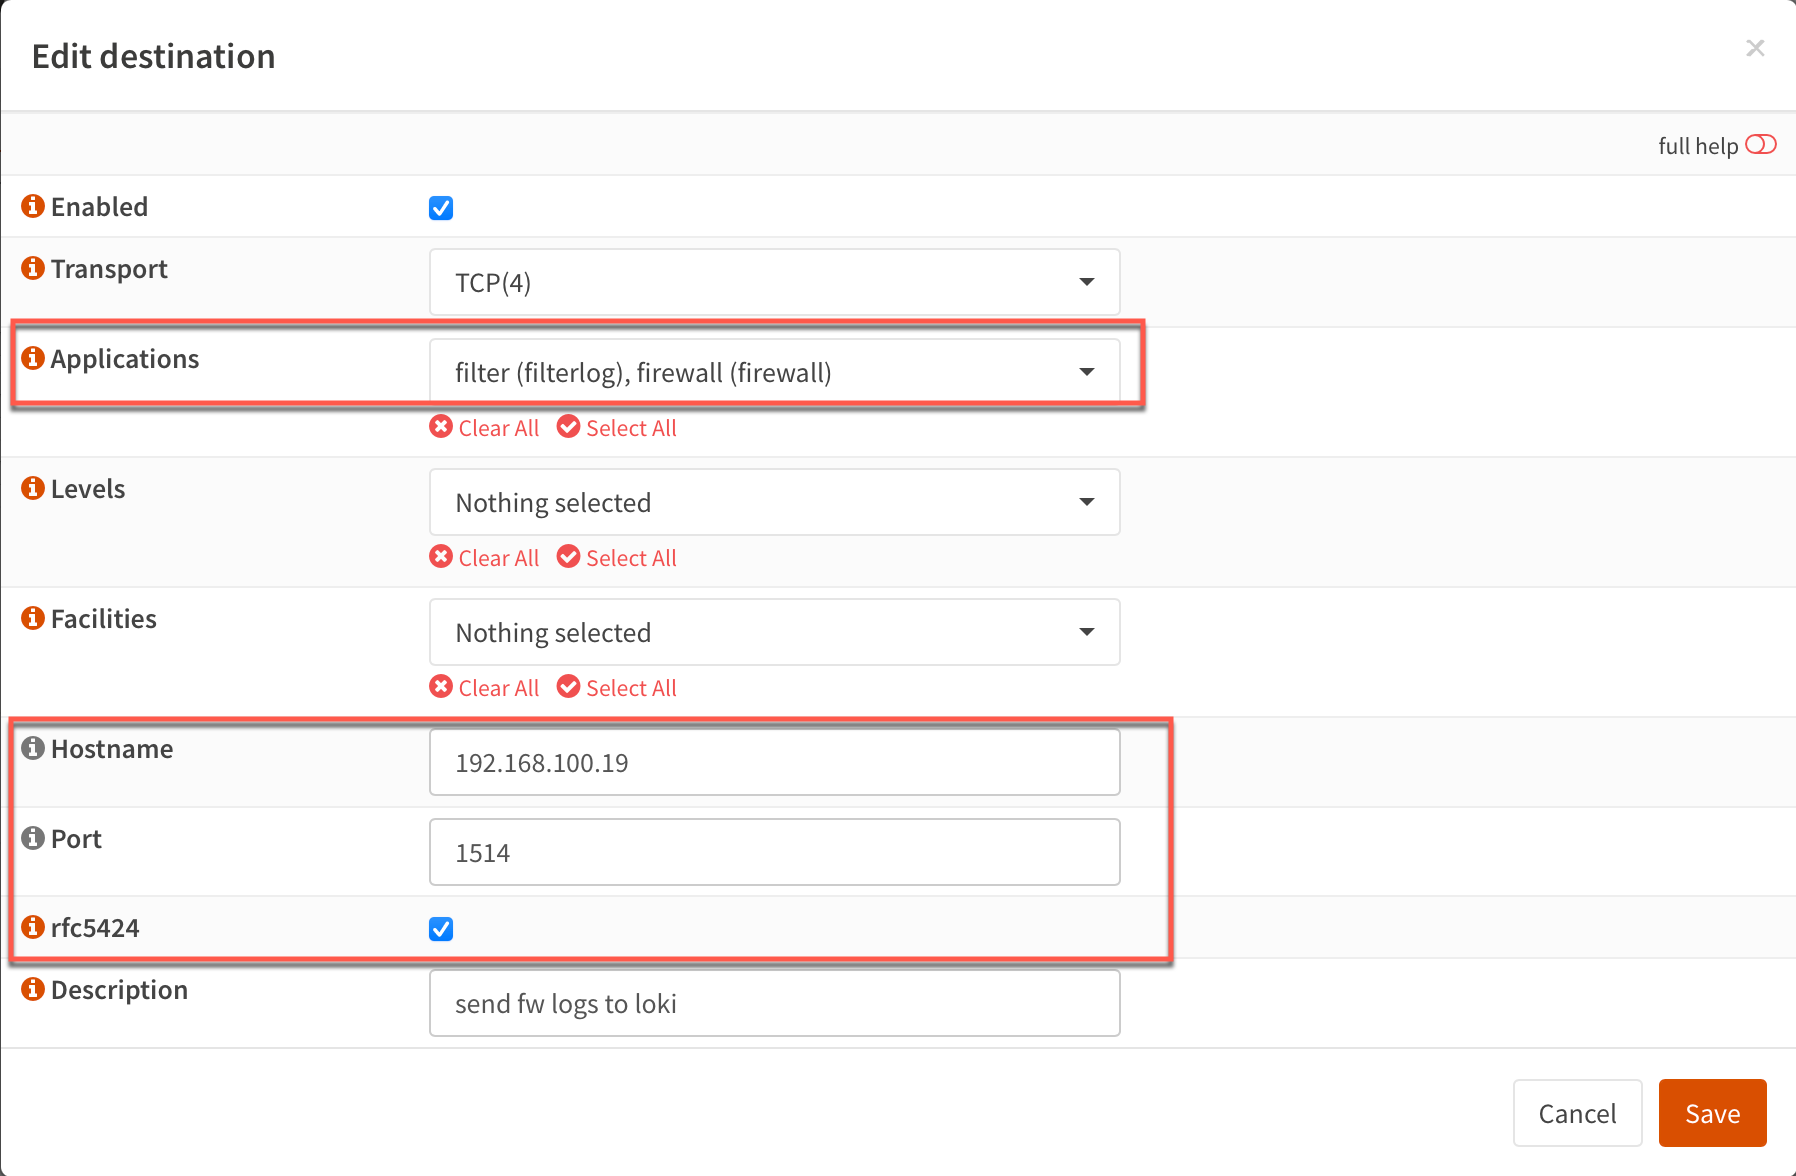
To push the logs to our Loki server we'll configure remote logging.
The settings is done through System->Settings->Logging
We add a new Remote target and add the address and port for the Promtail agent on our Loki server
Grafana explore logs
Now, let's check out Grafana and the Explore functionality which supports the Loki datasource.
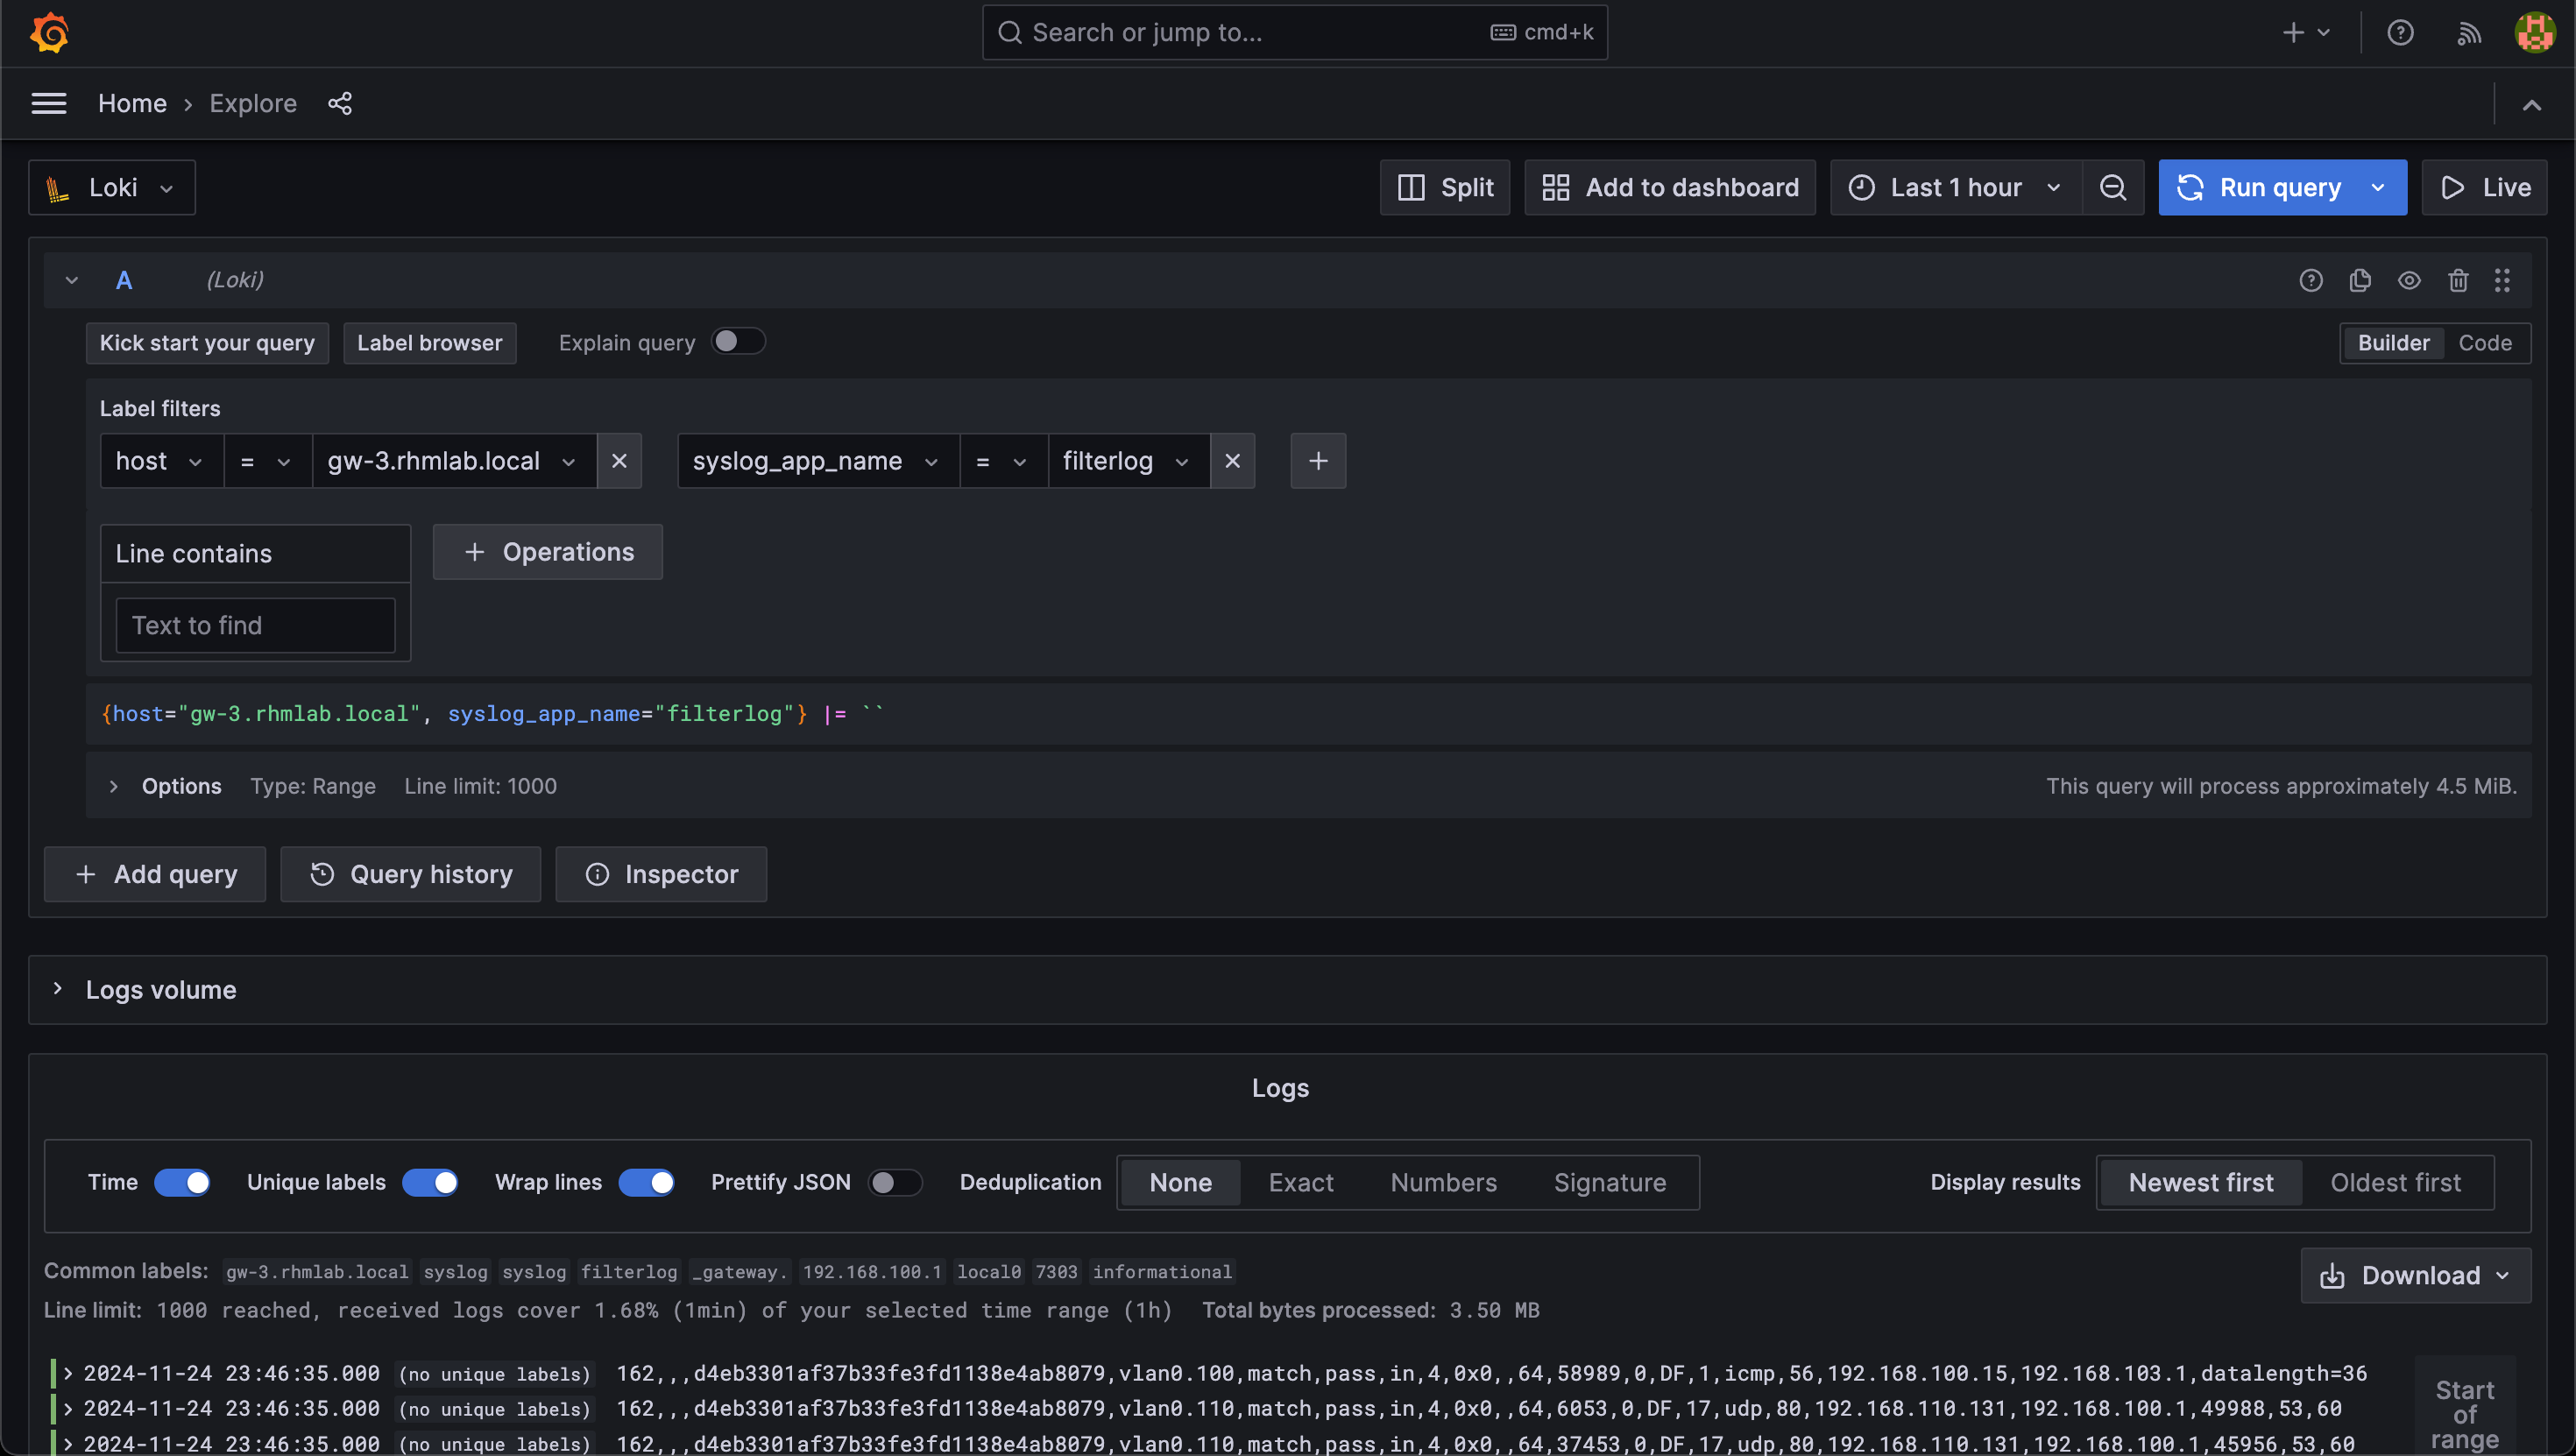
The Explore view in Grafana is great for exploring the logs. Here we can utilize the different filtering functions available to parse the logs
From the Plain view log line we saw in OPNsense we can start working out a regex pattern to match the values to labels
The pattern formatter can be used to extract labels from the log line
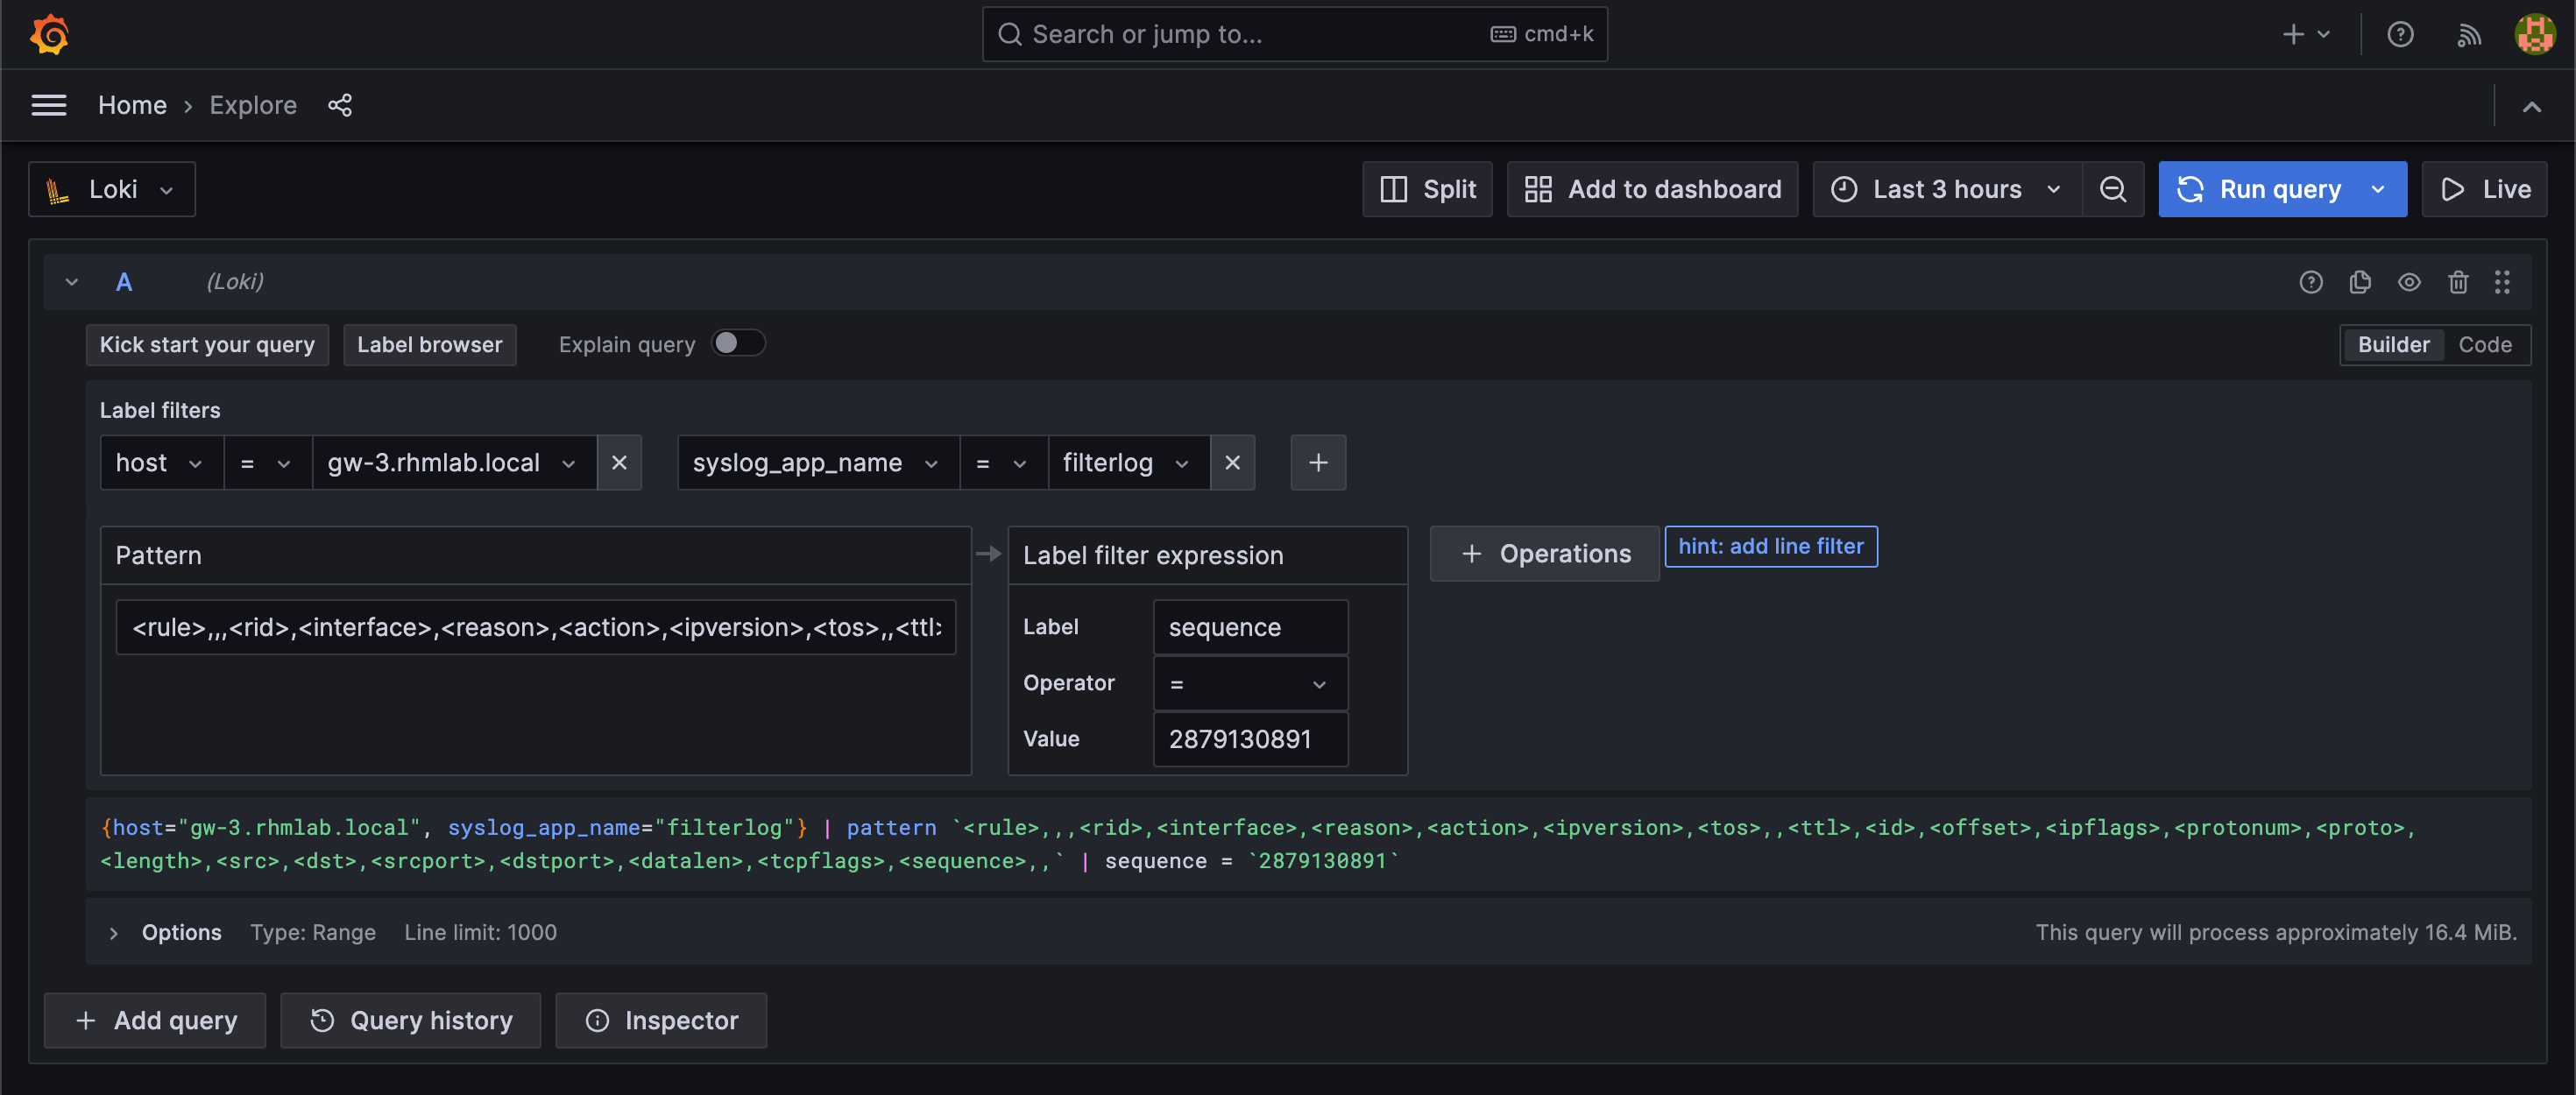
With this we can utilize the labels in searches:
With the example firewall log line
1142,,,03b6331b884ca335cbc0e2f022fe07a2,vlan0.100,match,pass,in,4,0x0,,64,9281,0,DF,6,tcp,60,192.168.100.15,192.168.1.251,38336,9100,0,S,2879130891,,64240,,mss;sackOK;TS;nop;wscale
We've used the following pattern
1<rule>,,,<rid>,<interface>,<reason>,<action>,<ipversion>,<tos>,,<ttl>,<id>,<offset>,<ipflags>,<protonum>,<proto>,<length>,<src>,<dst>,<srcport>,<dstport>,<datalen>,<tcpflags>,<sequence>,,
Now, this could be sufficient for working with logs in Grafana, and it will also adhere to Loki's idea of indexing metadata and not content. I have however wanted to see how we can add some of the fields as labels that we can use in visualizations
Pipelining in promtail
To parse the logs and add labels before pushing them to Loki we'll add a pipeline_stage to our Promtail config. We'll want this to run on the firewall logs explicitly so that we can match the specific log line format.
In my exploration of the logs I found that there's a few different patterns that we encounter from the filterlogs. So far I've seen differences based on the protocol in question, TCP has one set of data, UDP another and ICMP a third.
While I'm no expert in regex, I've managed to craft a regex search that works for both TCP and UDP, but for ICMP I've needed to create a separate one.
The example for tcp and udp looks like the following
1^(?s)(?P<fw_rule>\d+),,,(?P<fw_rid>.+?),(?P<fw_interface>.+?),(?P<fw_reason>.+?),(?P<fw_action>(pass|block|reject)),(?P<fw_dir>(in|out)),(?P<fw_ipversion>\d+?),(?P<fw_tos>.+?),(?P<fw_>.+?)?,(?P<fw_ttl>\d.?),(?P<fw_id>\d+?),(?P<fw_offset>\d+?),(?P<fw_ipflags>.+?),(?P<fw_protonum>\d+?),(?P<fw_proto>(tcp|udp|icmp)),(?P<fw_length>\d+?),(?P<fw_src>\d+\.\d+\.\d+\.\d+?),(?P<fw_dst>\d+\.\d+\.\d+\.\d+?),(?P<fw_srcport>\d+?),(?P<fw_dstport>\d+?),(?P<fw_datalen>\d+),?(?P<fw_tcpflags>\w+)?,?(?P<fw_sequence>\d+)?
We're utilizing named capture groups to configure the labels we'll later on pass to Loki. The fw_ is my own prefix for the label names
We'll use this in the match stage with a selector and the regex
 1pipeline_stages:
 2  - match:
 3    selector: '{syslog_app_name="filterlog"} !~ ".*icmp.*"'
 4    stages:
 5    - regex:
 6        expression: '^(?s)(?P<fw_rule>\d+),,,(?P<fw_rid>.+?),(?P<fw_interface>.+?),(?P<fw_reason>.+?),(?P<fw_action>(pass|block|reject)),(?P<fw_dir>(in|out)),(?P<fw_ipversion>\d+?),(?P<fw_tos>.+?),(?P<fw_>.+?)?,(?P<fw_ttl>\d.?),(?P<fw_id>\d+?),(?P<fw_offset>\d+?),(?P<fw_ipflags>.+?),(?P<fw_protonum>\d+?),(?P<fw_proto>(tcp|udp|icmp)),(?P<fw_length>\d+?),(?P<fw_src>\d+\.\d+\.\d+\.\d+?),(?P<fw_dst>\d+\.\d+\.\d+\.\d+?),(?P<fw_srcport>\d+?),(?P<fw_dstport>\d+?),(?P<fw_datalen>\d+),?(?P<fw_tcpflags>\w+)?,?(?P<fw_sequence>\d+)?'
 7    - labels:
 8        fw_src:
 9        fw_dst:
10        fw_action:
11        fw_dstport:
12        fw_proto:
13        fw_interface:
In Promtail we can add two different match stages to separate the diffrent regex expressions.
The full Promtail config with the pipeline_stage added
 1server:
 2  http_listen_port: 9080
 3  grpc_listen_port: 0
 4
 5positions:
 6  filename: /tmp/positions.yaml
 7
 8clients:
 9  - url: http://localhost:3100/loki/api/v1/push
10
11scrape_configs:
12
13- job_name: syslog
14  syslog:
15    listen_address: 0.0.0.0:1514
16    labels:
17      job: syslog
18    use_incoming_timestamp: true
19  relabel_configs:
20    - source_labels: [__syslog_message_hostname]
21      target_label: host
22    - source_labels: [__syslog_message_severity]
23      target_label: syslog_severity
24    - source_labels: [__syslog_message_severity]
25      target_label: level
26    - source_labels: [__syslog_message_app_name]
27      target_label: syslog_app_name
28    - source_labels: [__syslog_message_facility]
29      target_label: syslog_facility
30    - source_labels: [__syslog_message_msg_id]
31      target_label: syslog_msgid
32    - source_labels: [__syslog_message_proc_id]
33      target_label: syslog_procid
34    - source_labels: [__syslog_connection_ip_address]
35      target_label: syslog_connection_ip_address
36    - source_labels: [__syslog_connection_hostname]
37      target_label: syslog_connection_hostname
38  pipeline_stages:
39  - match:
40      selector: '{syslog_app_name="filterlog"} !~ ".*icmp.*"'
41      stages:
42      - regex:
43          expression: '^(?s)(?P<fw_rule>\d+),,,(?P<fw_rid>.+?),(?P<fw_interface>.+?),(?P<fw_reason>.+?),(?P<fw_action>(pass|block|reject)),(?P<fw_dir>(in|out)),(?P<fw_ipversion>\d+?),(?P<fw_tos>.+?),(?P<fw_>.+?)?,(?P<fw_ttl>\d.?),(?P<fw_id>\d+?),(?P<fw_offset>\d+?),(?P<fw_ipflags>.+?),(?P<fw_protonum>\d+?),(?P<fw_proto>(tcp|udp|icmp)),(?P<fw_length>\d+?),(?P<fw_src>\d+\.\d+\.\d+\.\d+?),(?P<fw_dst>\d+\.\d+\.\d+\.\d+?),(?P<fw_srcport>\d+?),(?P<fw_dstport>\d+?),(?P<fw_datalen>\d+),?(?P<fw_tcpflags>\w+)?,?(?P<fw_sequence>\d+)?'
44      - labels:
45          fw_src:
46          fw_dst:
47          fw_action:
48          fw_dstport:
49          fw_proto:
50          fw_interface:
51  - match:
52      selector: '{syslog_app_name="filterlog"} |~ ".*icmp.*"'
53      stages:
54      - regex:
55          expression: '^(?s)(?P<fw_rule>\d+),,,(?P<fw_rid>.+?),(?P<fw_interface>.+?),(?P<fw_reason>.+?),(?P<fw_action>(pass|block|reject)),(?P<fw_dir>(in|out)),(?P<fw_ipversion>\d+?),(?P<fw_tos>.+?),(?P<fw_>.+?)?,(?P<fw_ttl>\d.?),(?P<fw_id>\d+?),(?P<fw_offset>\d+?),(?P<fw_ipflags>.+?),(?P<fw_protonum>\d+?),(?P<fw_proto>(tcp|udp|icmp)),(?P<fw_length>\d+?),(?P<fw_src>\d+\.\d+\.\d+\.\d+?),(?P<fw_dst>\d+\.\d+\.\d+\.\d+?),(?P<fw_datalen>datalength=\d+?)'
56      - labels:
57          fw_src:
58          fw_dst:
59          fw_action:
60          fw_proto:
61          fw_interface:
The relabelling config is similar to what you'd do in Prometheus, and these are done for all the logs coming in to Promtail and will add those as labels to the logs. The pipeline_stages stanza on the other hand is where we do stuff specific for the firewall logs.
We're matching log lines on the syslog_app_name="filterlog" selector to ensure the pipelining is only done for the firewall logs. In my environment there's no other sources for filterlog so I can match on that alone, but here you'd want to specify more filtering options to get it unique.
To decide which regex to use we're piping the log lines from filterlog and match on icmp or not.
The named groups in the regex matches the log lines from OPNsense and extracts labels for the fields in the log line. Finally we decide which labels we'll pass on to Loki. Since there's a limit to how many labels we can pass to Loki we've kept it to just a subset of the labels extracted from the log line.
With this in place we can see that we get more labels on our logs
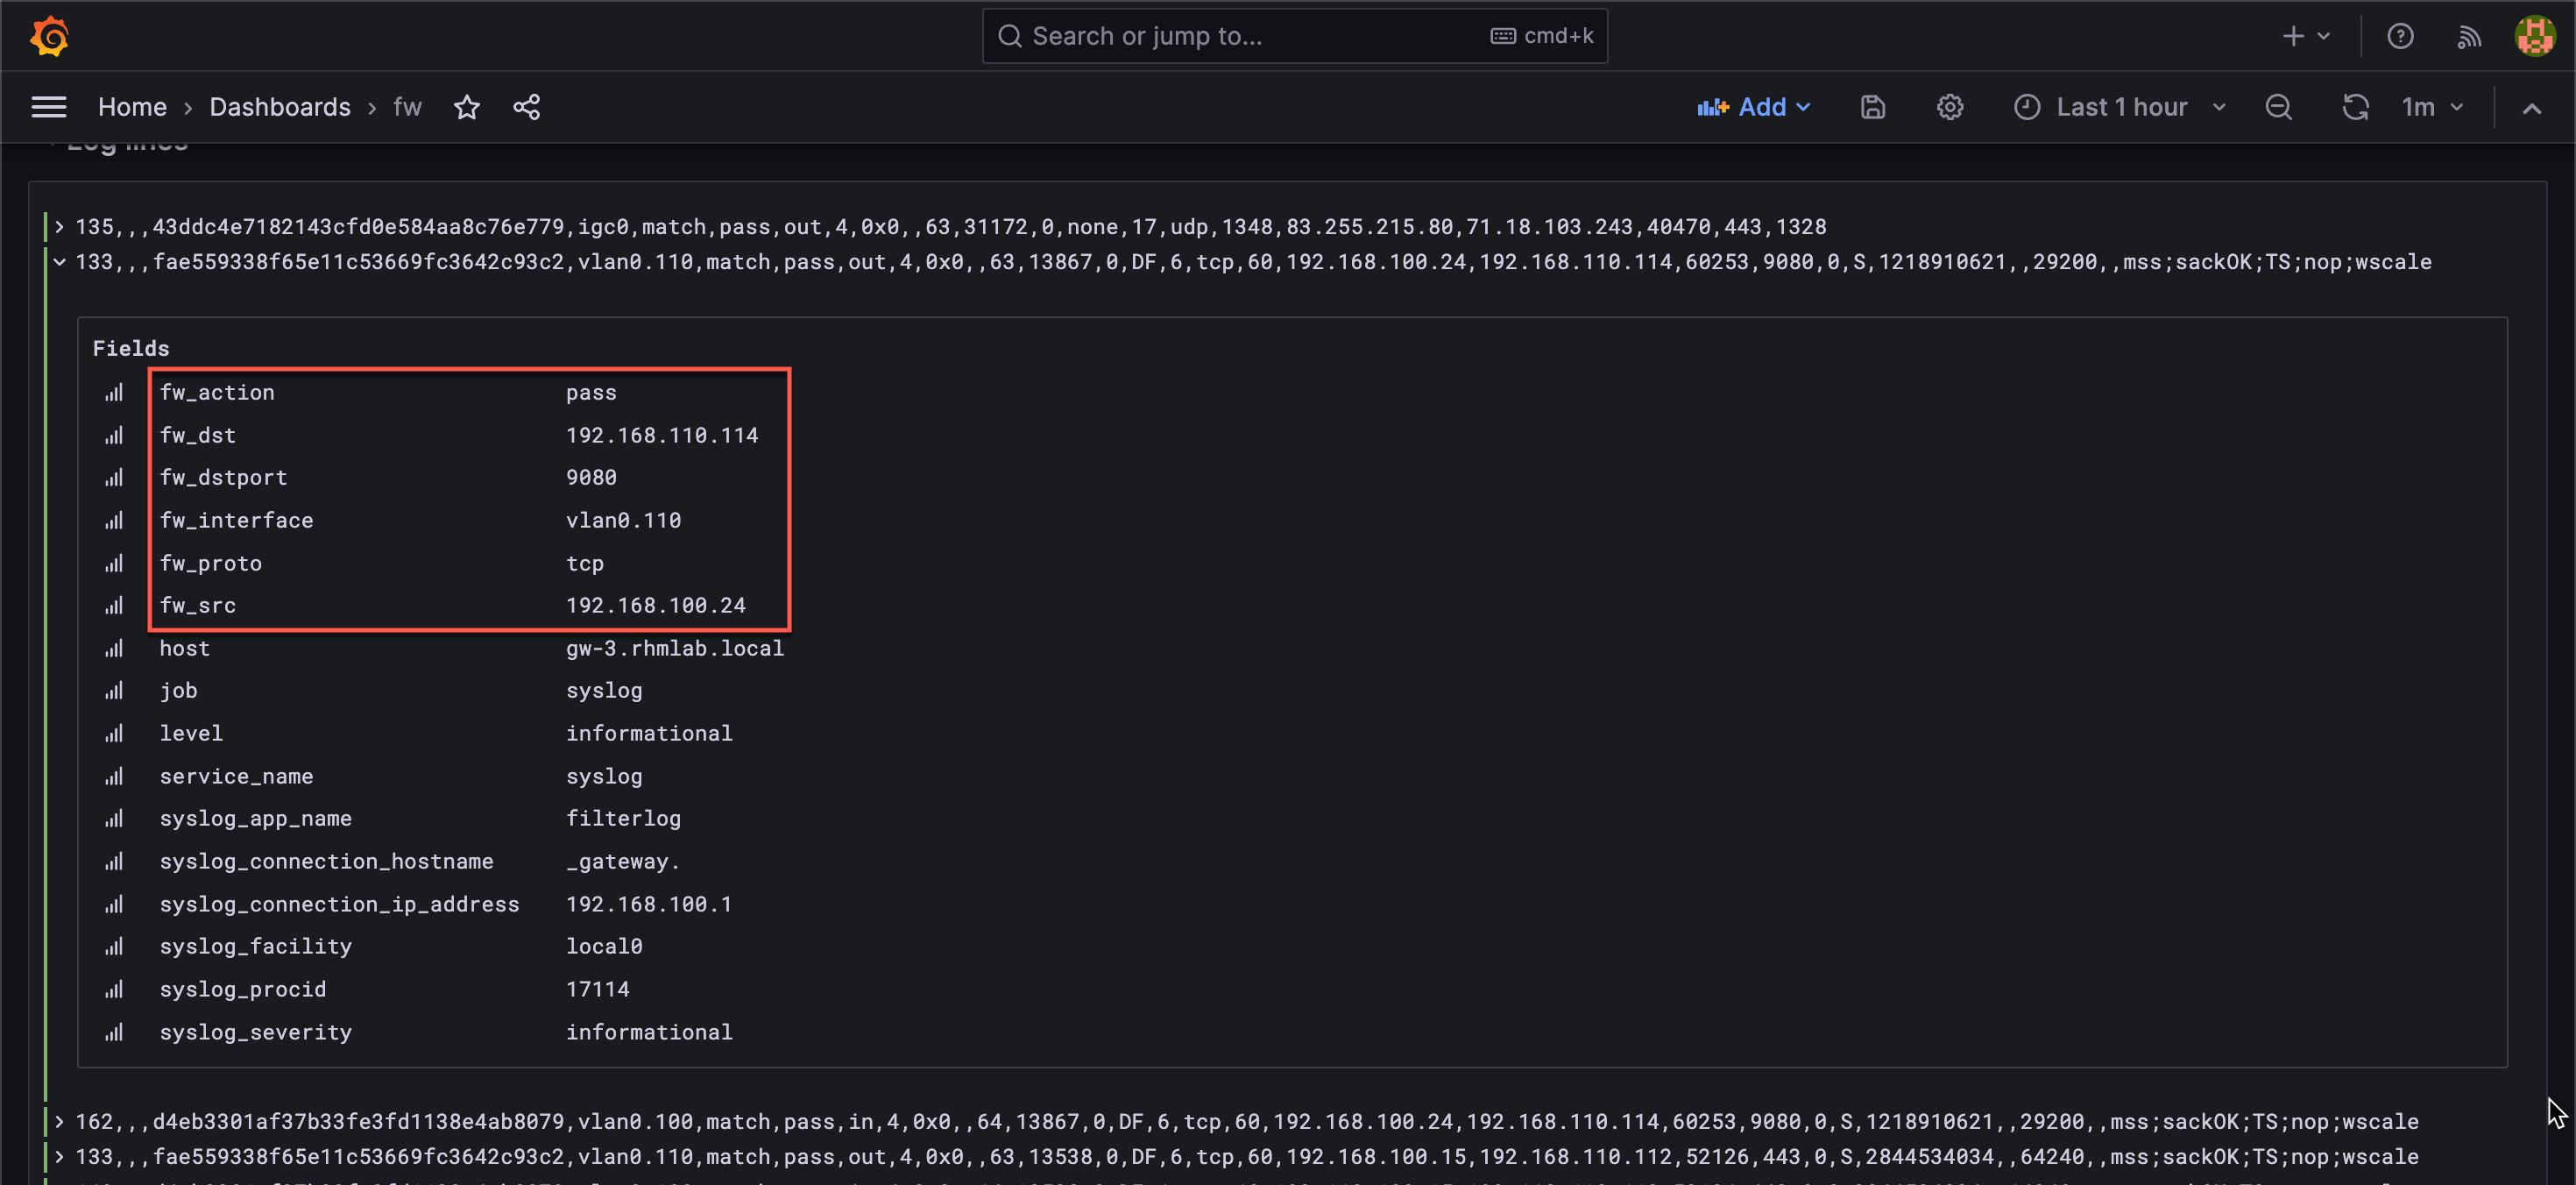
Now we can build out visualizations somewhat easier than relying on pattern matching in every query
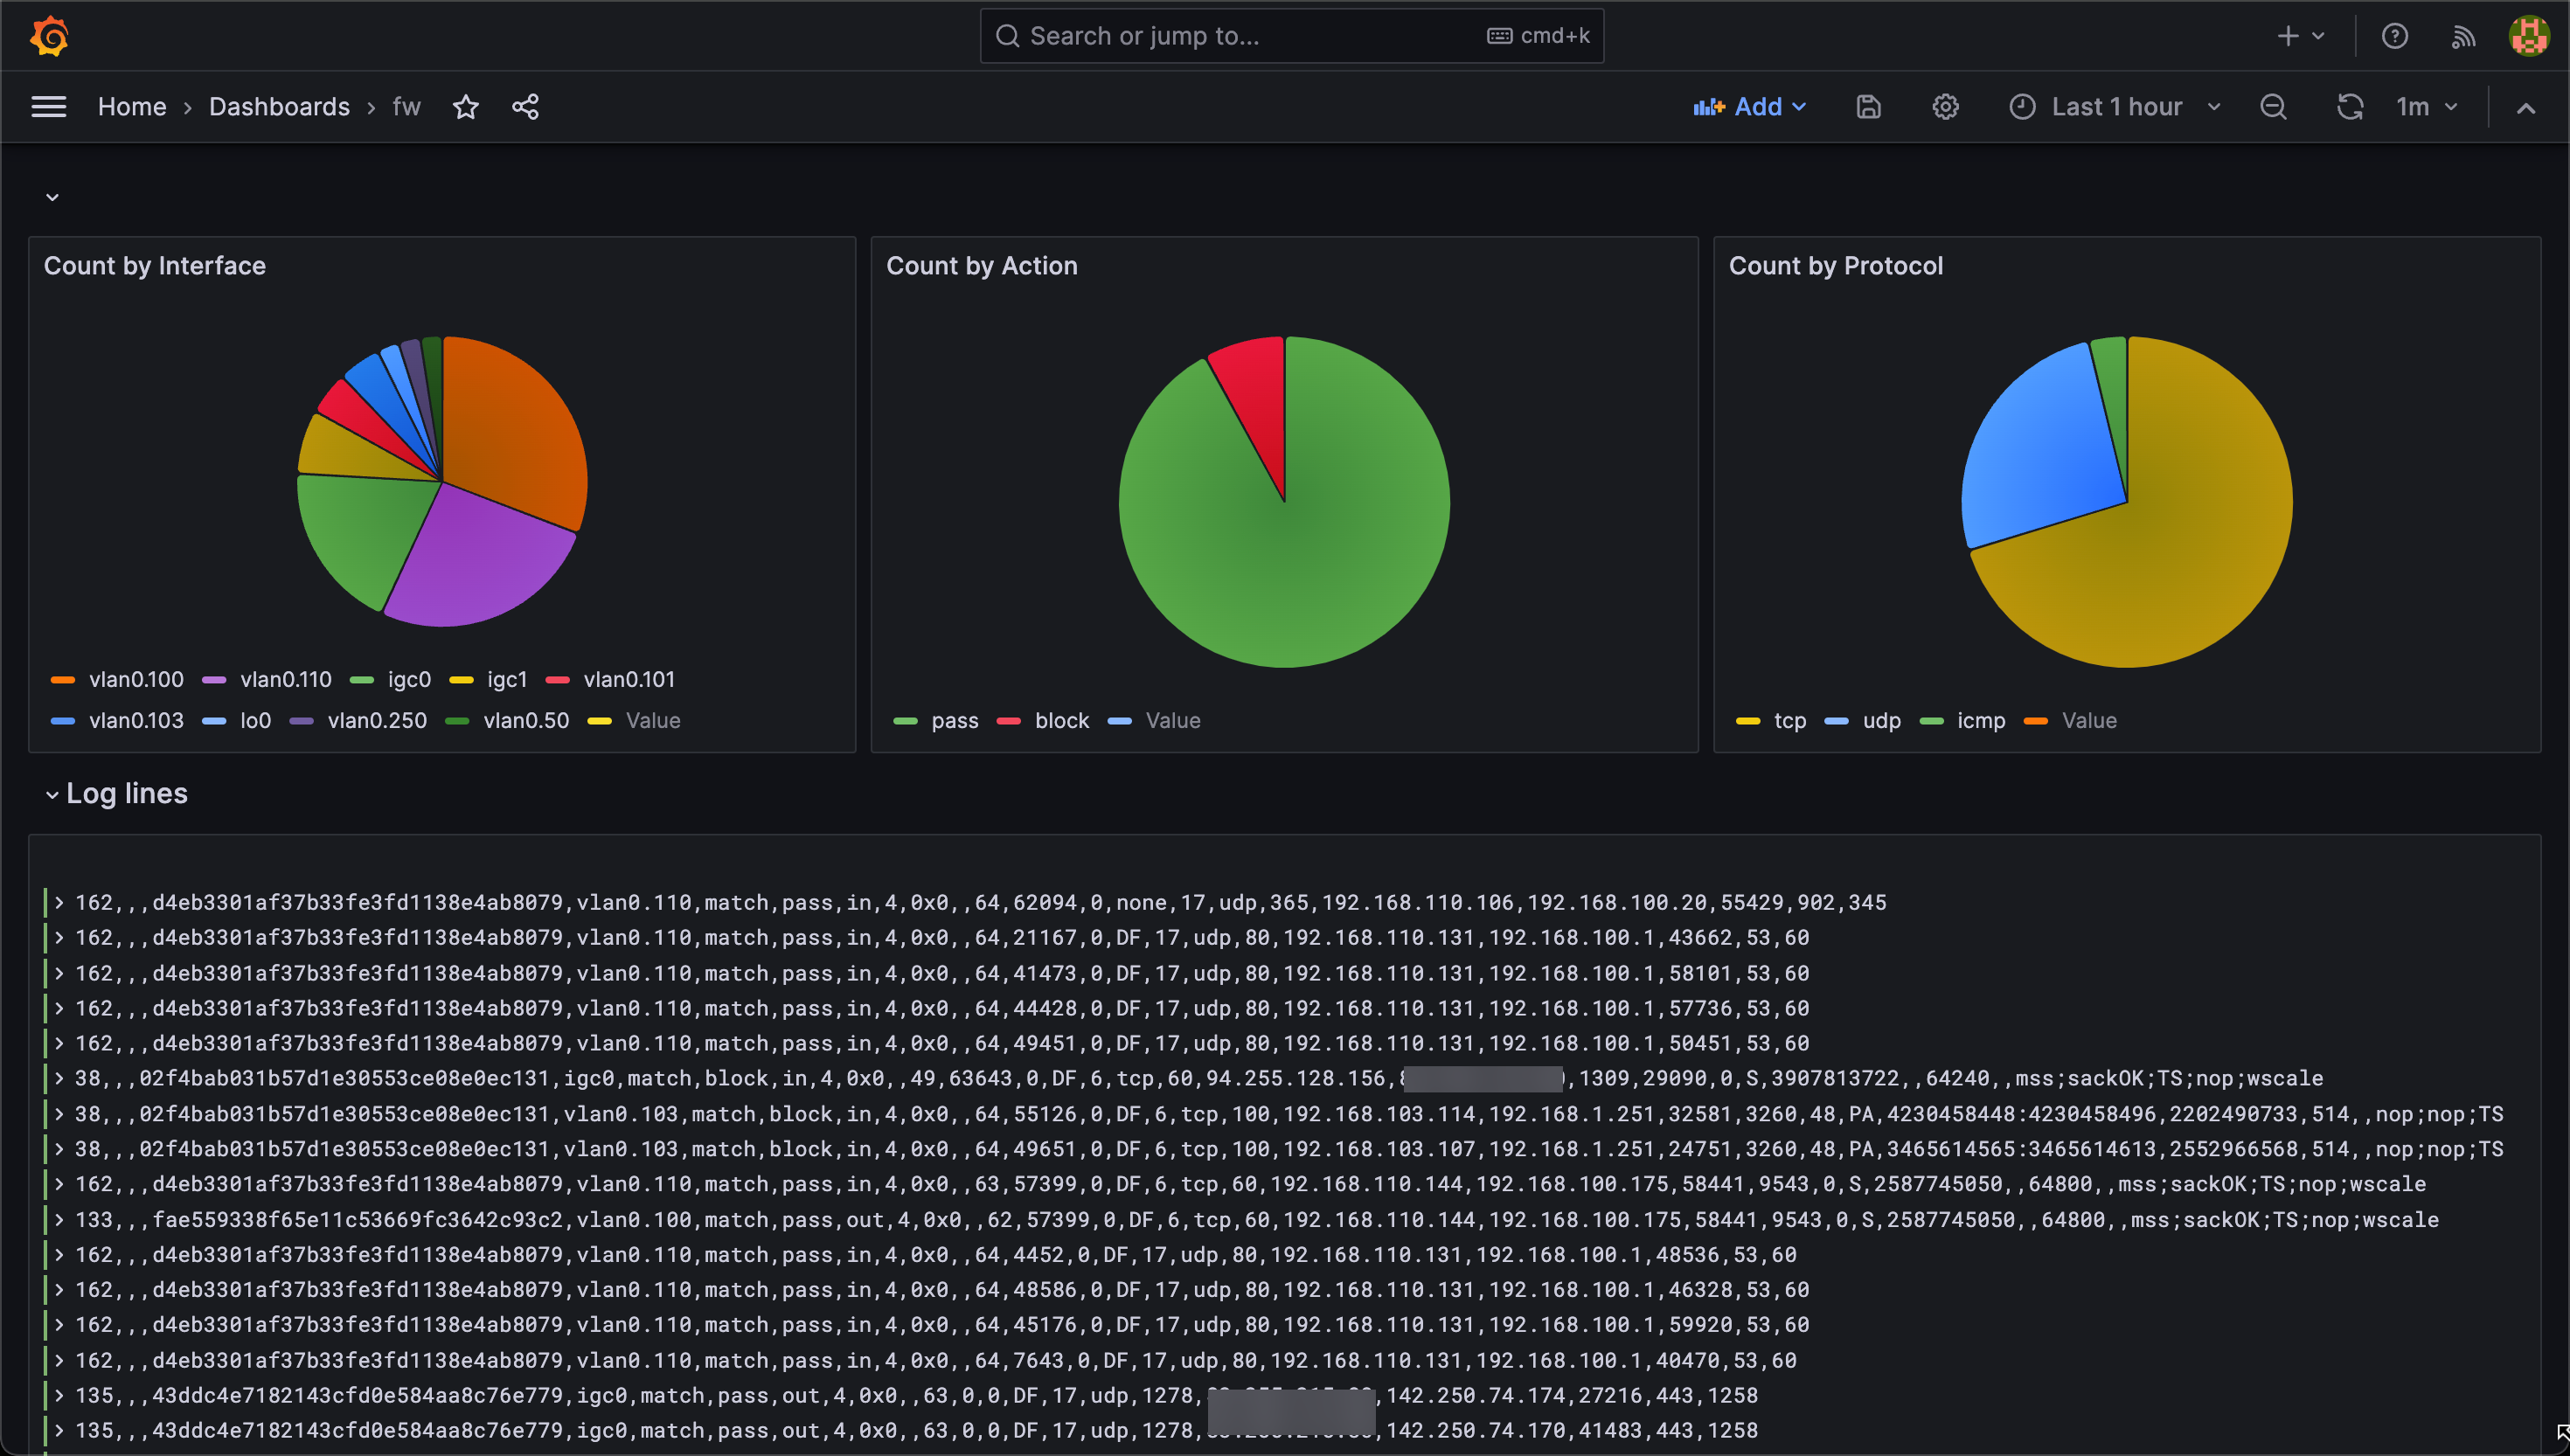
In this post we take a look at Structured Metadata which is another way of adding label like data to your logs
Summary
This post has shown how one could make use of Grafana Loki and Promtail to set up a target for firewall logs from OPNsense.
As mentioned Loki is built around indexing the metadata of logs instead of the contents. This post shows examples that adds some labels to the log lines which is not adhering to that practice, but as shown I've done that for easier visualization later on.
Please feel free to reach out if you have any comments and questions