vSAN Monitoring with Grafana and InfluxDB
In this post we will take a look at using the Telegraf Agent for pulling vSAN metrics and visualizing them with Grafana.
I've previously written about visualizing vSphere and vSAN metrics with Grafana, you can check out those posts here
This post assumes you already have Telegraf and Grafana running in your environment
For information about how to install Telegraf and Grafana, check the official documentation
The Telegraf agent will pull a great deal of metrics, we'll only touch on a few of them in this post. For a full list of metrics check out the Github repo
The infrastructure at hand
In this post we will make use of a vSAN cluster running on version 8.0.1 and we're using the new Express Storage Architecture (ESA). There's four ESXi hosts, each with 64 GB RAM and with two disks; a 500GB NVMe and a 2 TiB SSD. All disks is added to the vSAN storage pool
Telegraf config
Telegraf is running as a service on a Ubuntu VM in the infrastructure. Besides the default config where Telegraf monitors the machine it is running on we've only added configuration for the vSphere plugin.
The vSphere plugin config has been extracted to it's own file(s) to keep things tidy.
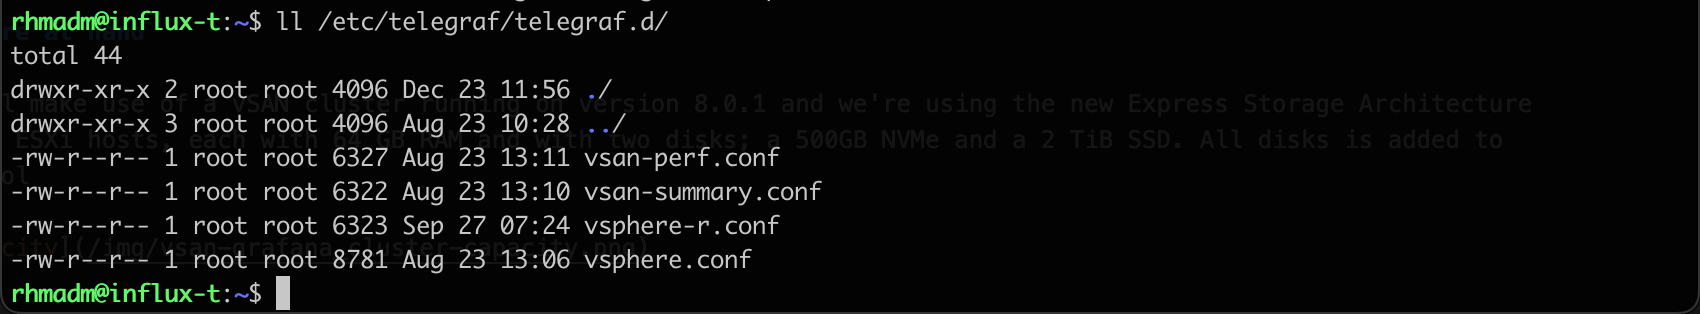
As you'll see I've separated the config in four different files. This will spin up four instances of the agent. The reason for doing so is because the different metrics is pulled on different intervals.
As an example we can take a look at the realtime performance data for virtual machines and hosts which vCenter will aggregate on a 20 second interval where as the performance data for datacenters, datastores and clusters will be aggregated on a 5 minute interval. For Telegraf to pull data for datastores and clusters every 20 seconds is inefficient.
This might not be a big issue in smaller environments, but with a large estate one needs to be as efficient as possible to be able to pull all data inside the specific time interval.
The same goes for the vSAN data which is available on intervals of 30 seconds and 5 minutes. We'll refer to these as realtime and historical.
For more details on the realtime and historical metrics check out the respective sections of the plugin documentation:
vSAN realtime metrics config
The config for the vSAN realtime instance is set up as the following
 1[[inputs.vsphere]]
 2  ## List of vCenter URLs to be monitored. These three lines must be uncommented
 3  ## and edited for the plugin to work.
 4  vcenters = [ "https://vcenter-01.domain.local/sdk", "https://vcenter-02.domain.local/sdk" ]
 5  username = "telegraf@vsphere.local"
 6  password = "SuperPassword123456."
 7
 8
 9  ## VMs
10  vm_metric_exclude = ["*"] ## Nothing is excluded by default
11
12  ## Hosts
13  host_metric_exclude = ["*"] ## Nothing excluded by default
14
15  ## Clusters
16  cluster_metric_exclude = ["*"] ## Nothing excluded by default
17
18  ## Resource Pools
19  resource_pool_metric_exclude = ["*"] ## Nothing excluded by default
20
21  ## Datastores
22  datastore_metric_exclude = ["*"] ## Nothing excluded by default
23
24  ## Datacenters
25  datacenter_metric_include = [] ## if omitted or empty, all metrics are collected
26  datacenter_metric_exclude = [ "*" ] ## Datacenters are not collected by default.
27
28  ## VSAN
29  vsan_metric_include = ["summary.*"] ## if omitted or empty, all metrics are collected
30   vsan_metric_exclude = [] ## vSAN are not collected by default.
31  ## Whether to skip verifying vSAN metrics against the ones from GetSupportedEntityTypes API.
32  # vsan_metric_skip_verify = false ## false by default.
33
34  ## Use SSL but skip chain & host verification
35  insecure_skip_verify = true
36
37  interval = "30s"
Note that we're excluding the vSphere metrics that are collected by default, and for the vSAN metrics we're only including the summary metrics
vSAN historical
The config for the vSAN historical data is quite similar. The only difference being that we're setting a different interval for the instance to run, and selecting different vSAN metrics
 1[[inputs.vsphere]]
 2  ## List of vCenter URLs to be monitored. These three lines must be uncommented
 3  ## and edited for the plugin to work.
 4  vcenters = [ "https://vcenter-01.domain.local/sdk", "https://vcenter-02.domain.local/sdk" ]
 5  username = "telegraf@vsphere.local"
 6  password = "SuperPassword123456."
 7
 8
 9  ## VMs
10  vm_metric_exclude = ["*"] ## Nothing is excluded by default
11
12  ## Hosts
13  host_metric_exclude = ["*"] ## Nothing excluded by default
14
15  ## Clusters
16  cluster_metric_exclude = ["*"] ## Nothing excluded by default
17
18  ## Resource Pools
19  resource_pool_metric_exclude = ["*"] ## Nothing excluded by default
20
21  ## Datastores
22  datastore_metric_exclude = ["*"] ## Nothing excluded by default
23
24  ## Datacenters
25  datacenter_metric_include = [] ## if omitted or empty, all metrics are collected
26  datacenter_metric_exclude = [ "*" ] ## Datacenters are not collected by default.
27
28  ## VSAN
29  vsan_metric_include = ["performance.*"] ## if omitted or empty, all metrics are collected
30   vsan_metric_exclude = [] ## vSAN are not collected by default.
31  ## Whether to skip verifying vSAN metrics against the ones from GetSupportedEntityTypes API.
32  # vsan_metric_skip_verify = false ## false by default.
33
34  ## Use SSL but skip chain & host verification
35  insecure_skip_verify = true
36
37  interval = "300s"
With the Telegraf config ready let's take a look at the Grafana dashboards
Grafana dashboards
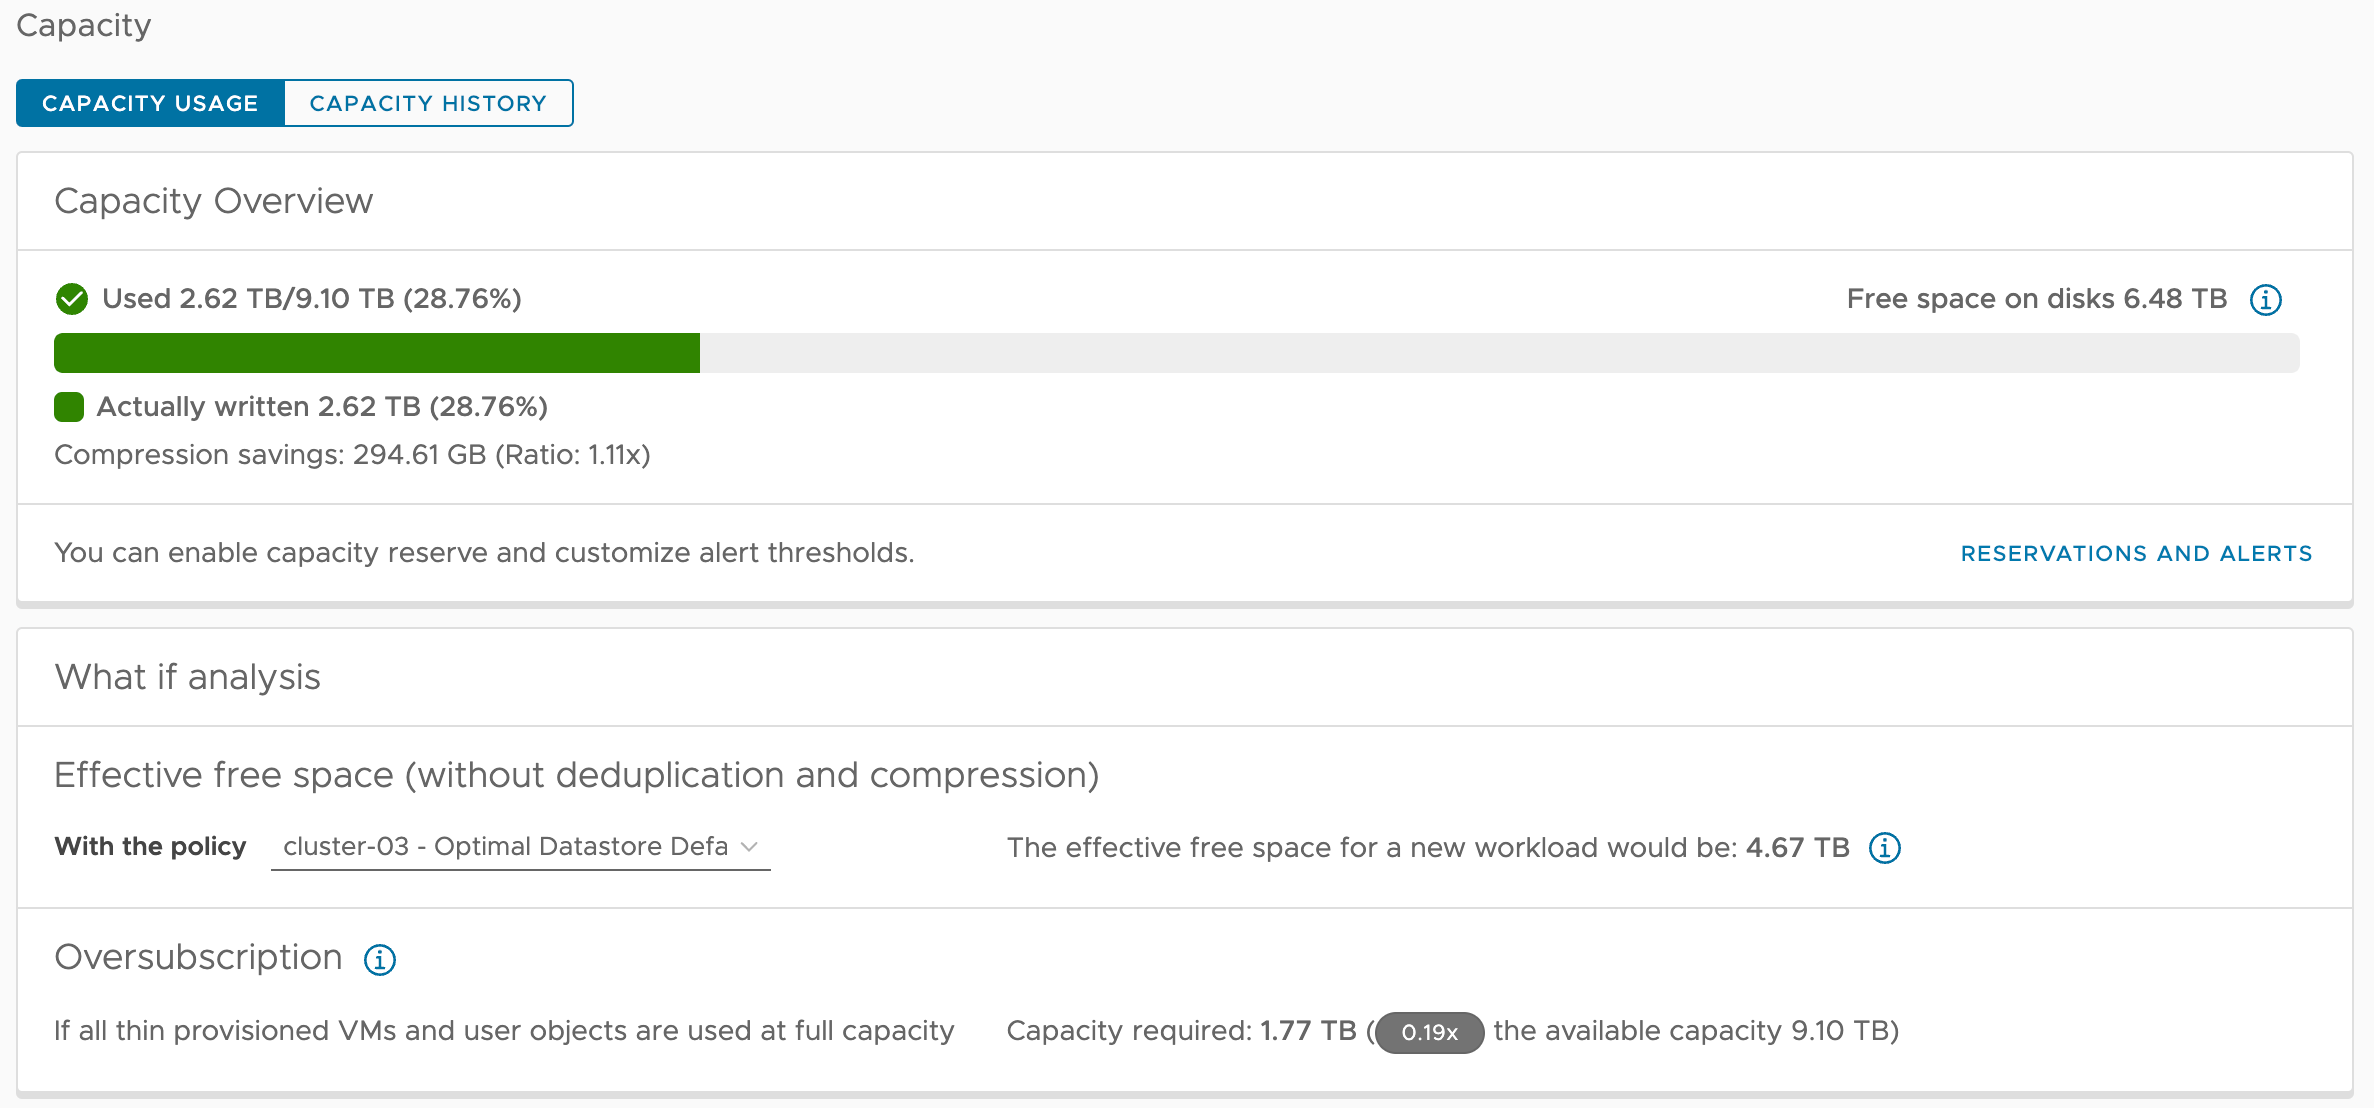
In this post we'll create two Grafana dashboards. We'll try to mimic the built-in dashboard you'll get from the vCenter UI for performance, and we'll add a dashboard for Capacity
Performance dashboard
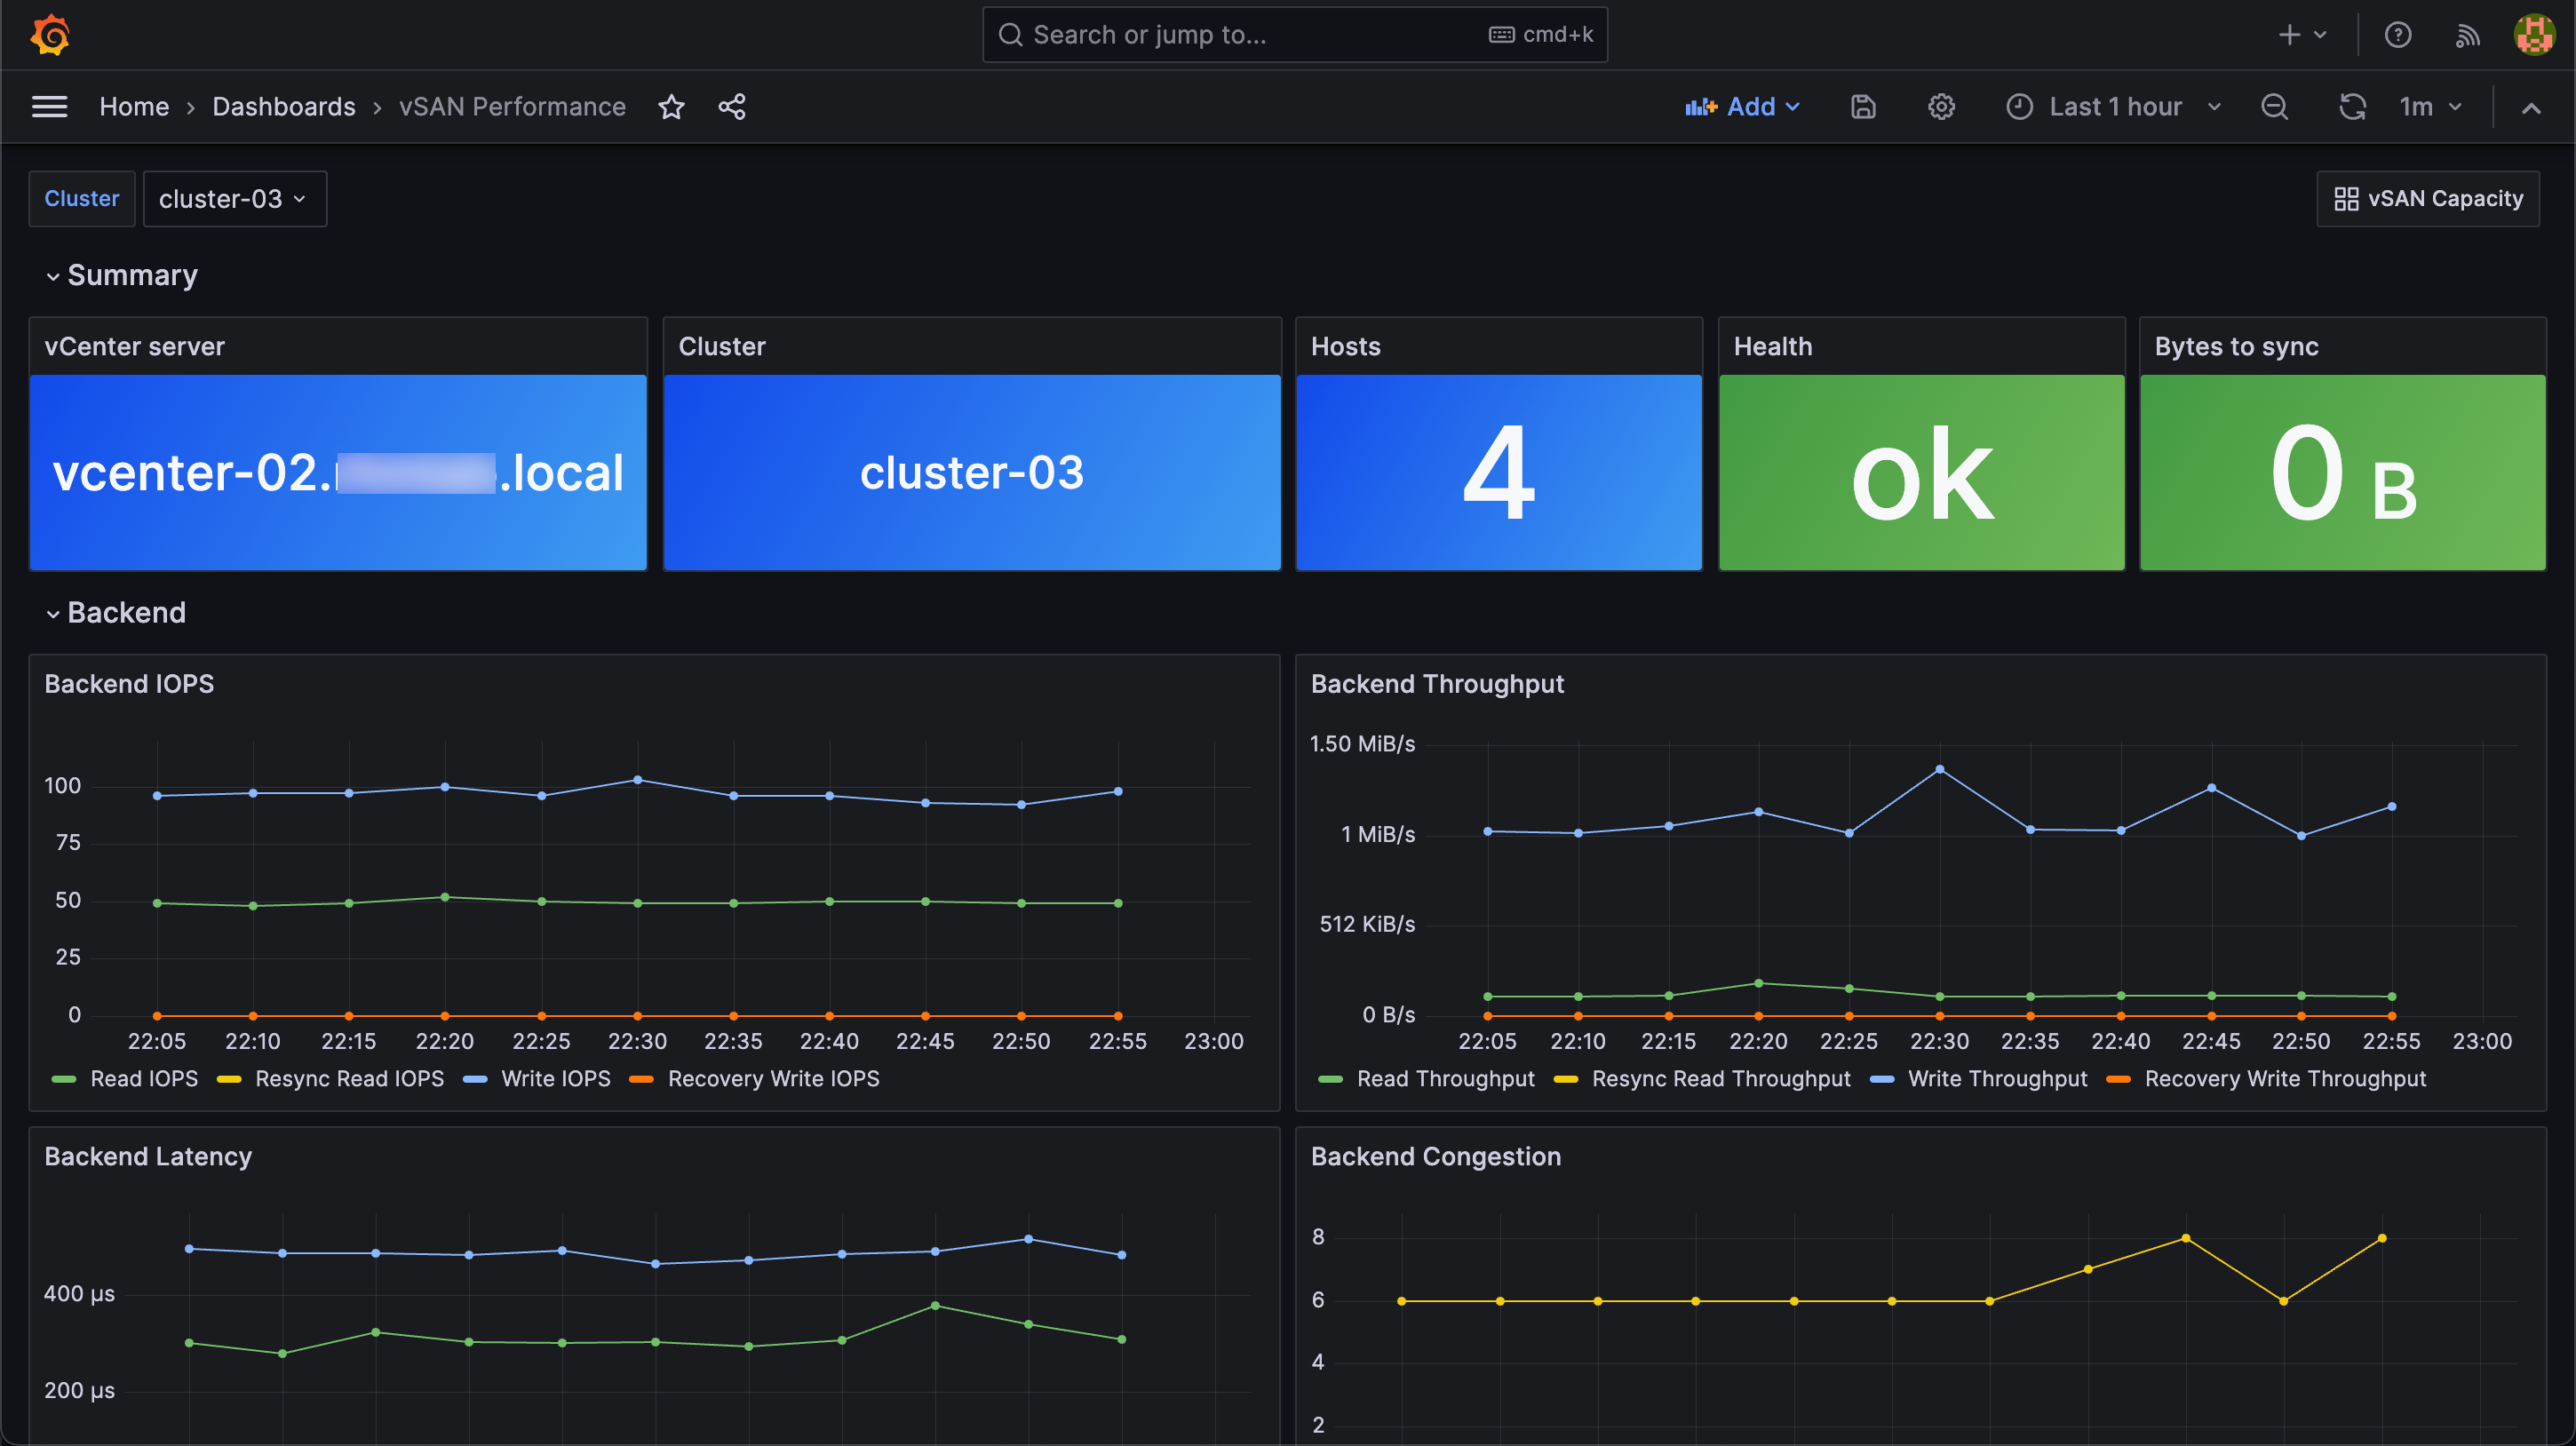
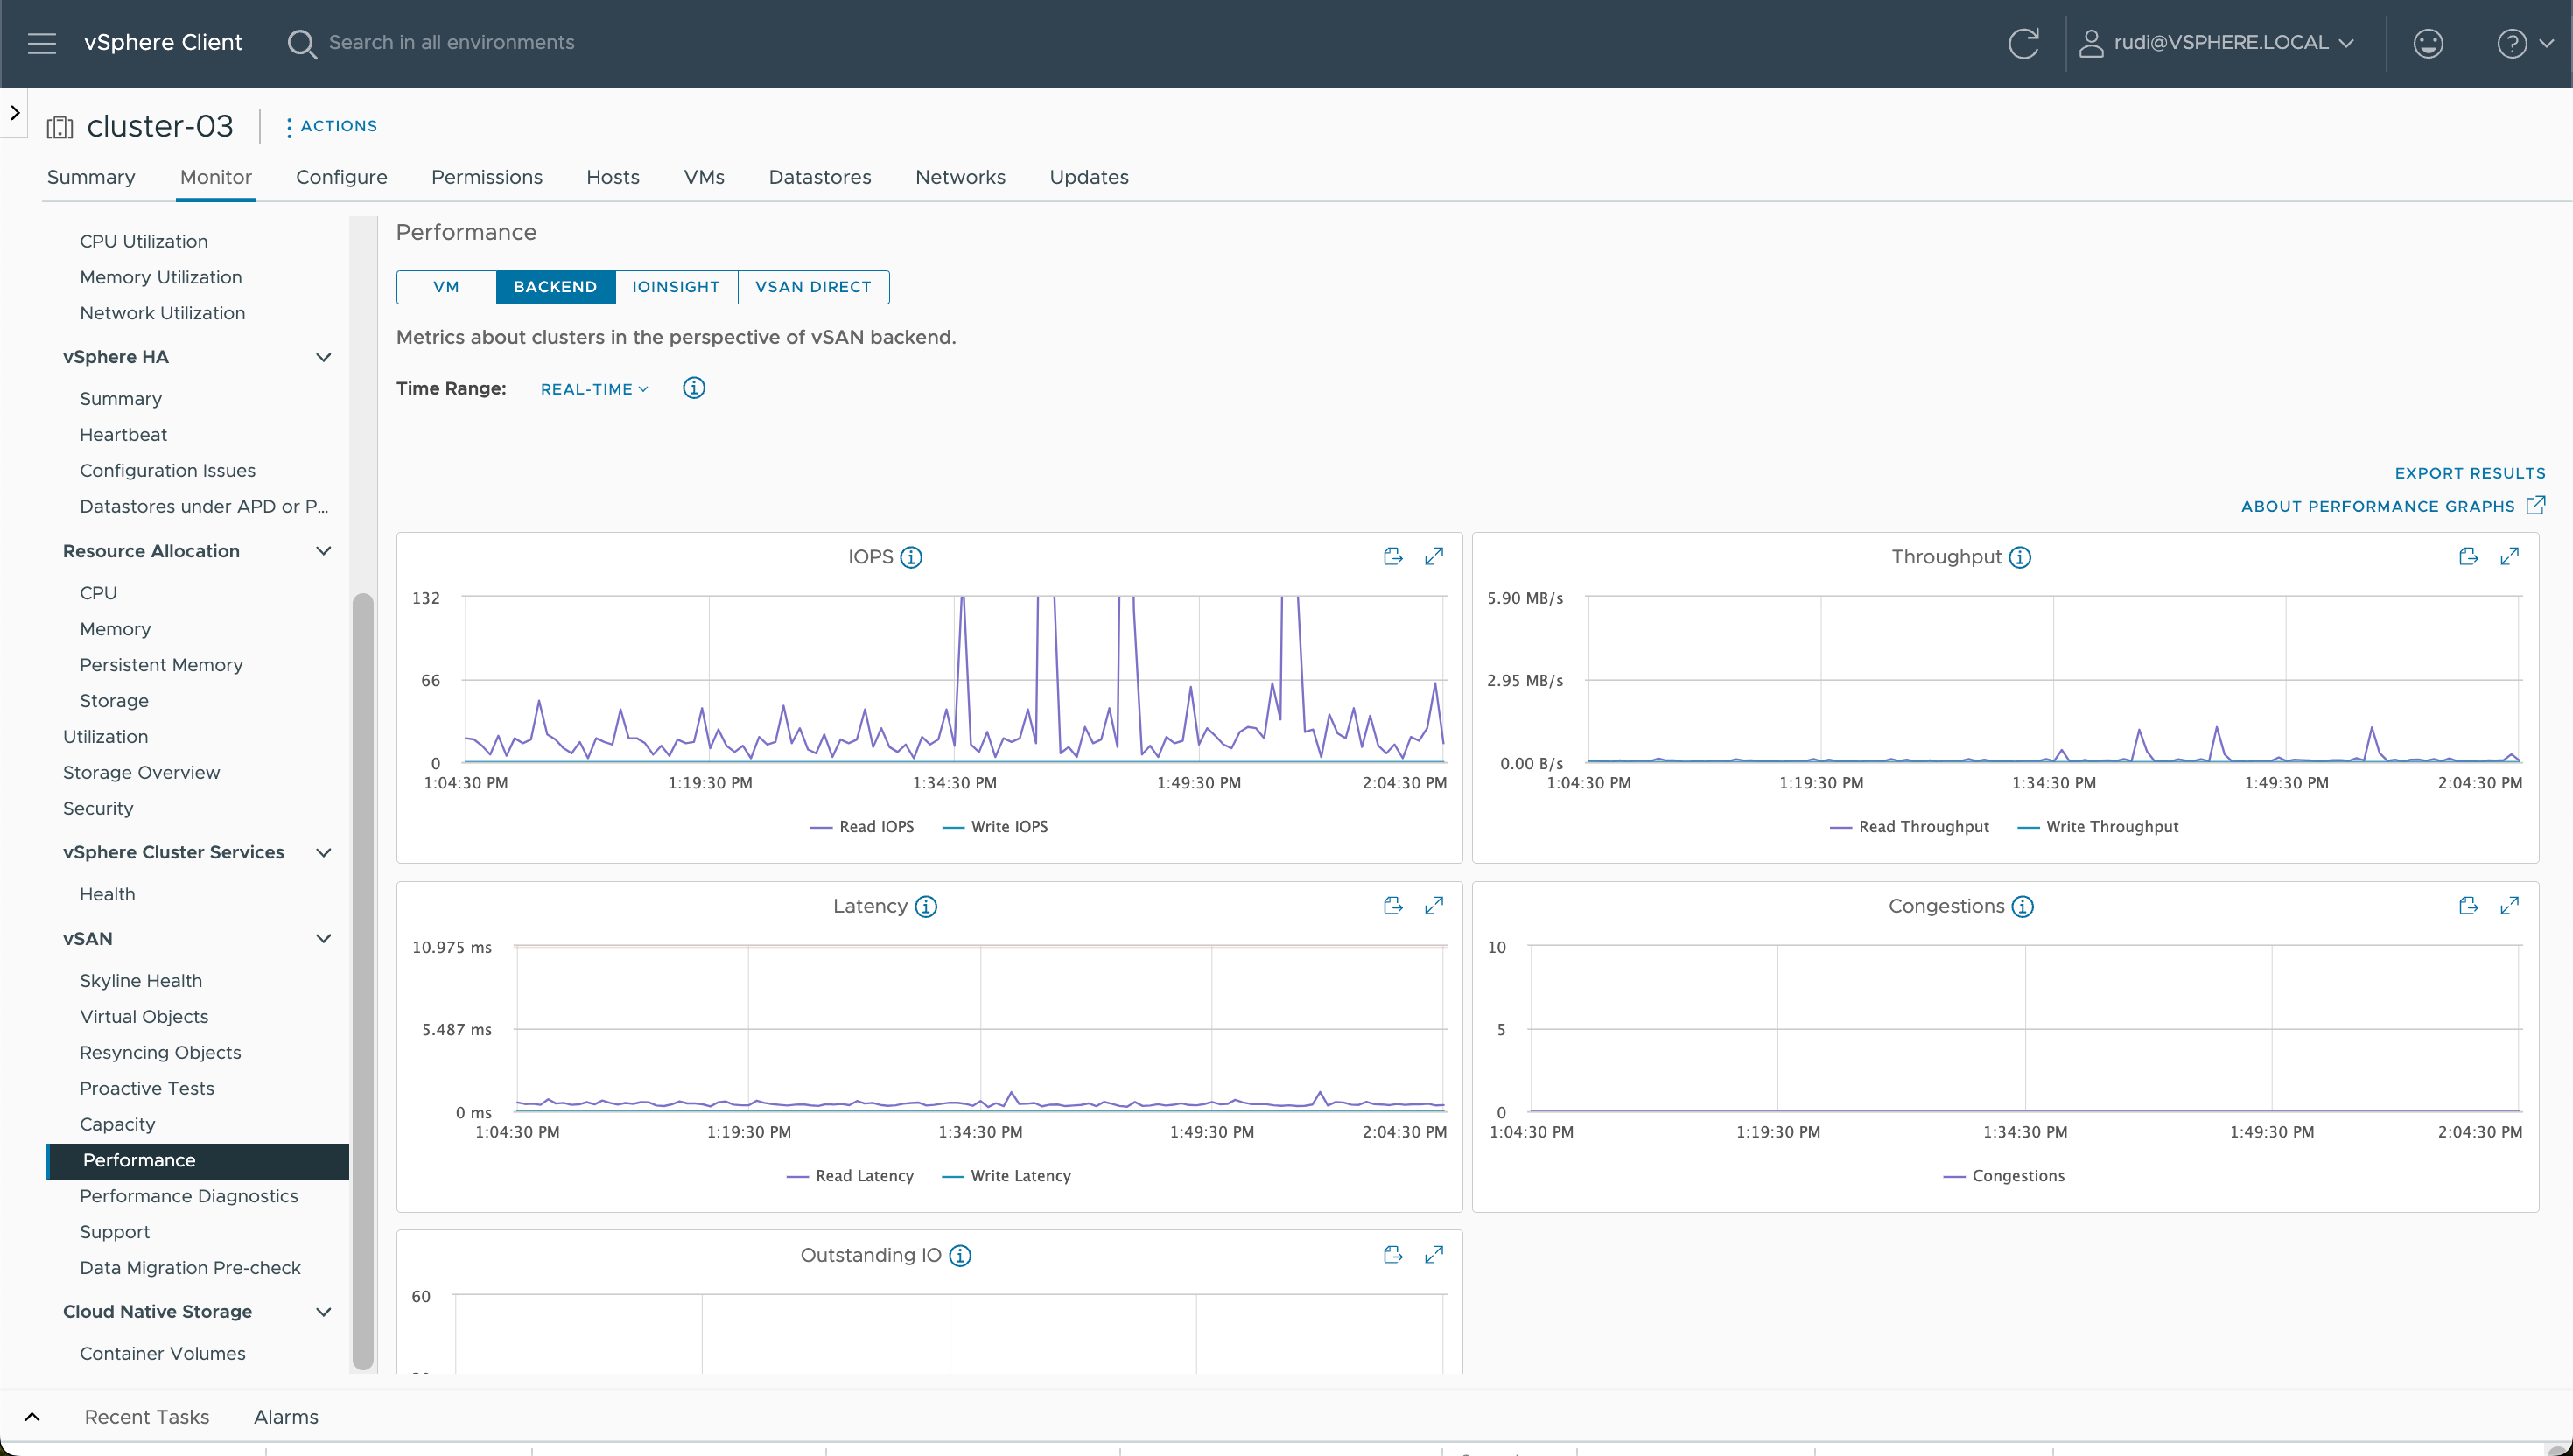
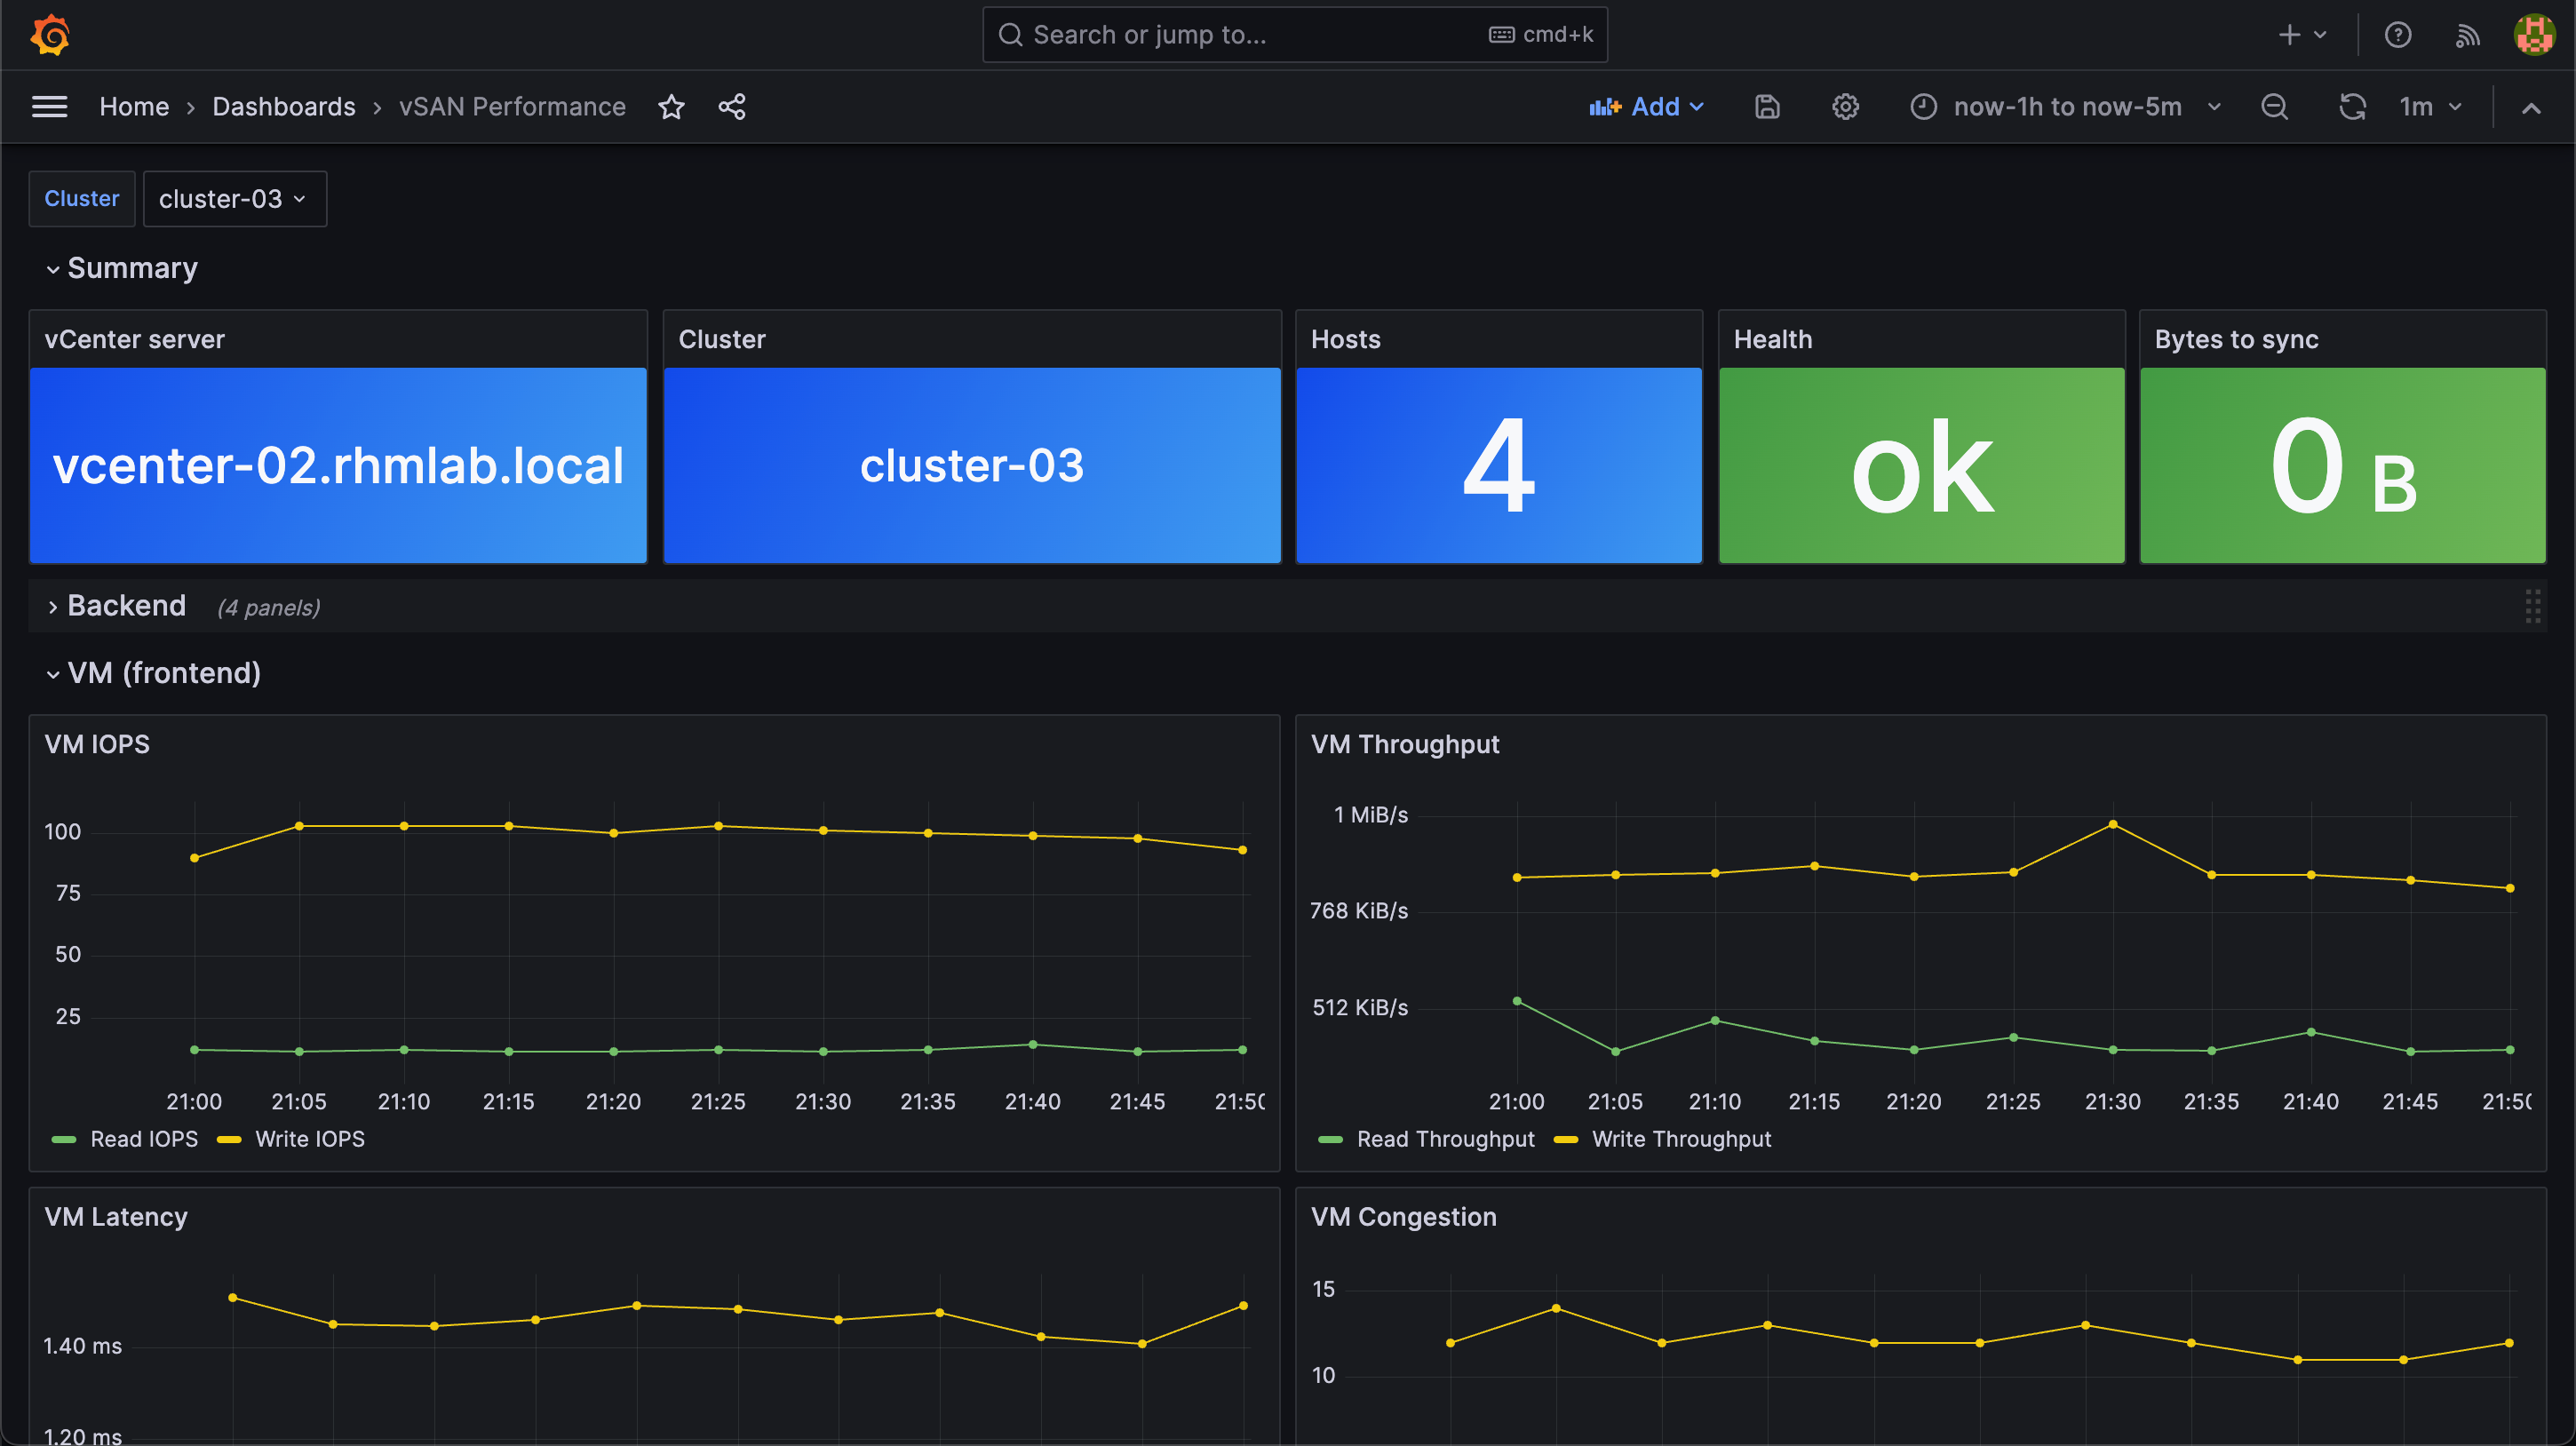
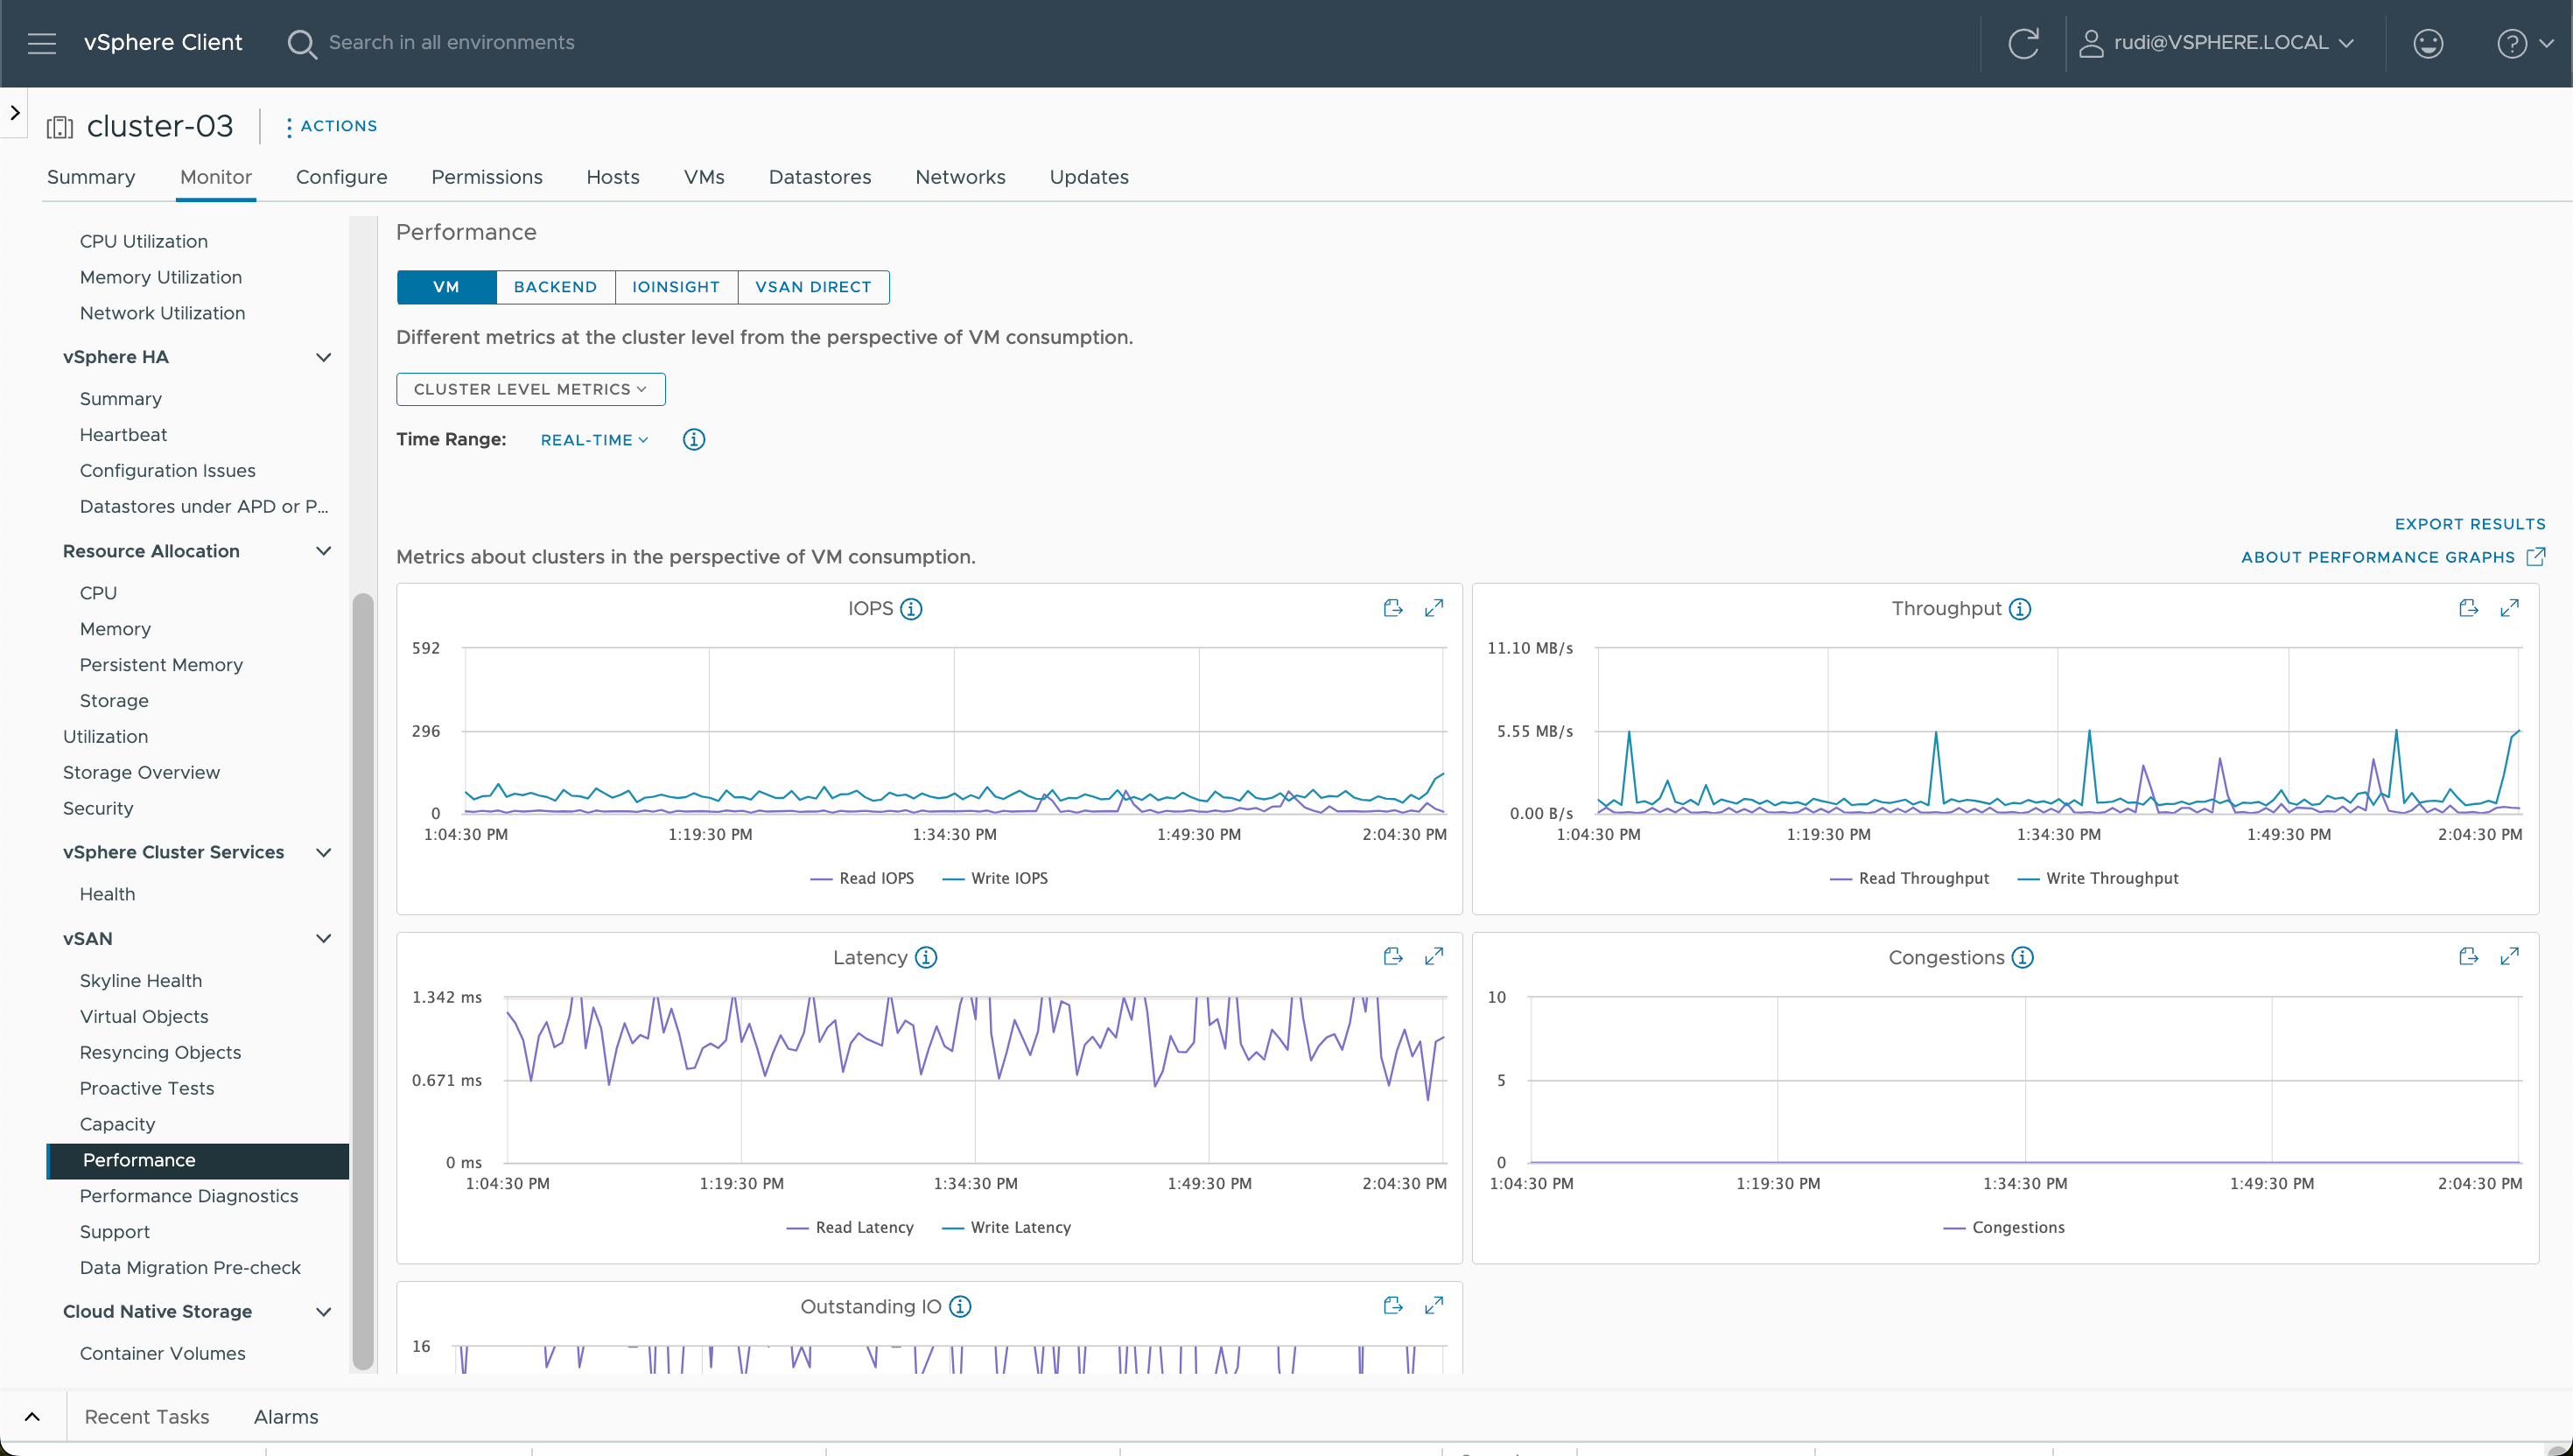
So the Performance dashboard was built to resemble the built-in dashboard from the vCenter UI
In the vCenter UI we have a few different graphs available from the Performance page. We'll focus on the ones available in the "VM" and "Backend" areas
The "Backend" graphs are grouped to the "Backend" row
The "VM" graphs are grouped to the "VM (frontend)" row
There's also a row for data resyncing. These will be showing thata in case there's a lot of data being resync'ed. Typically when entering hosts in maintenance, adding disks etc.
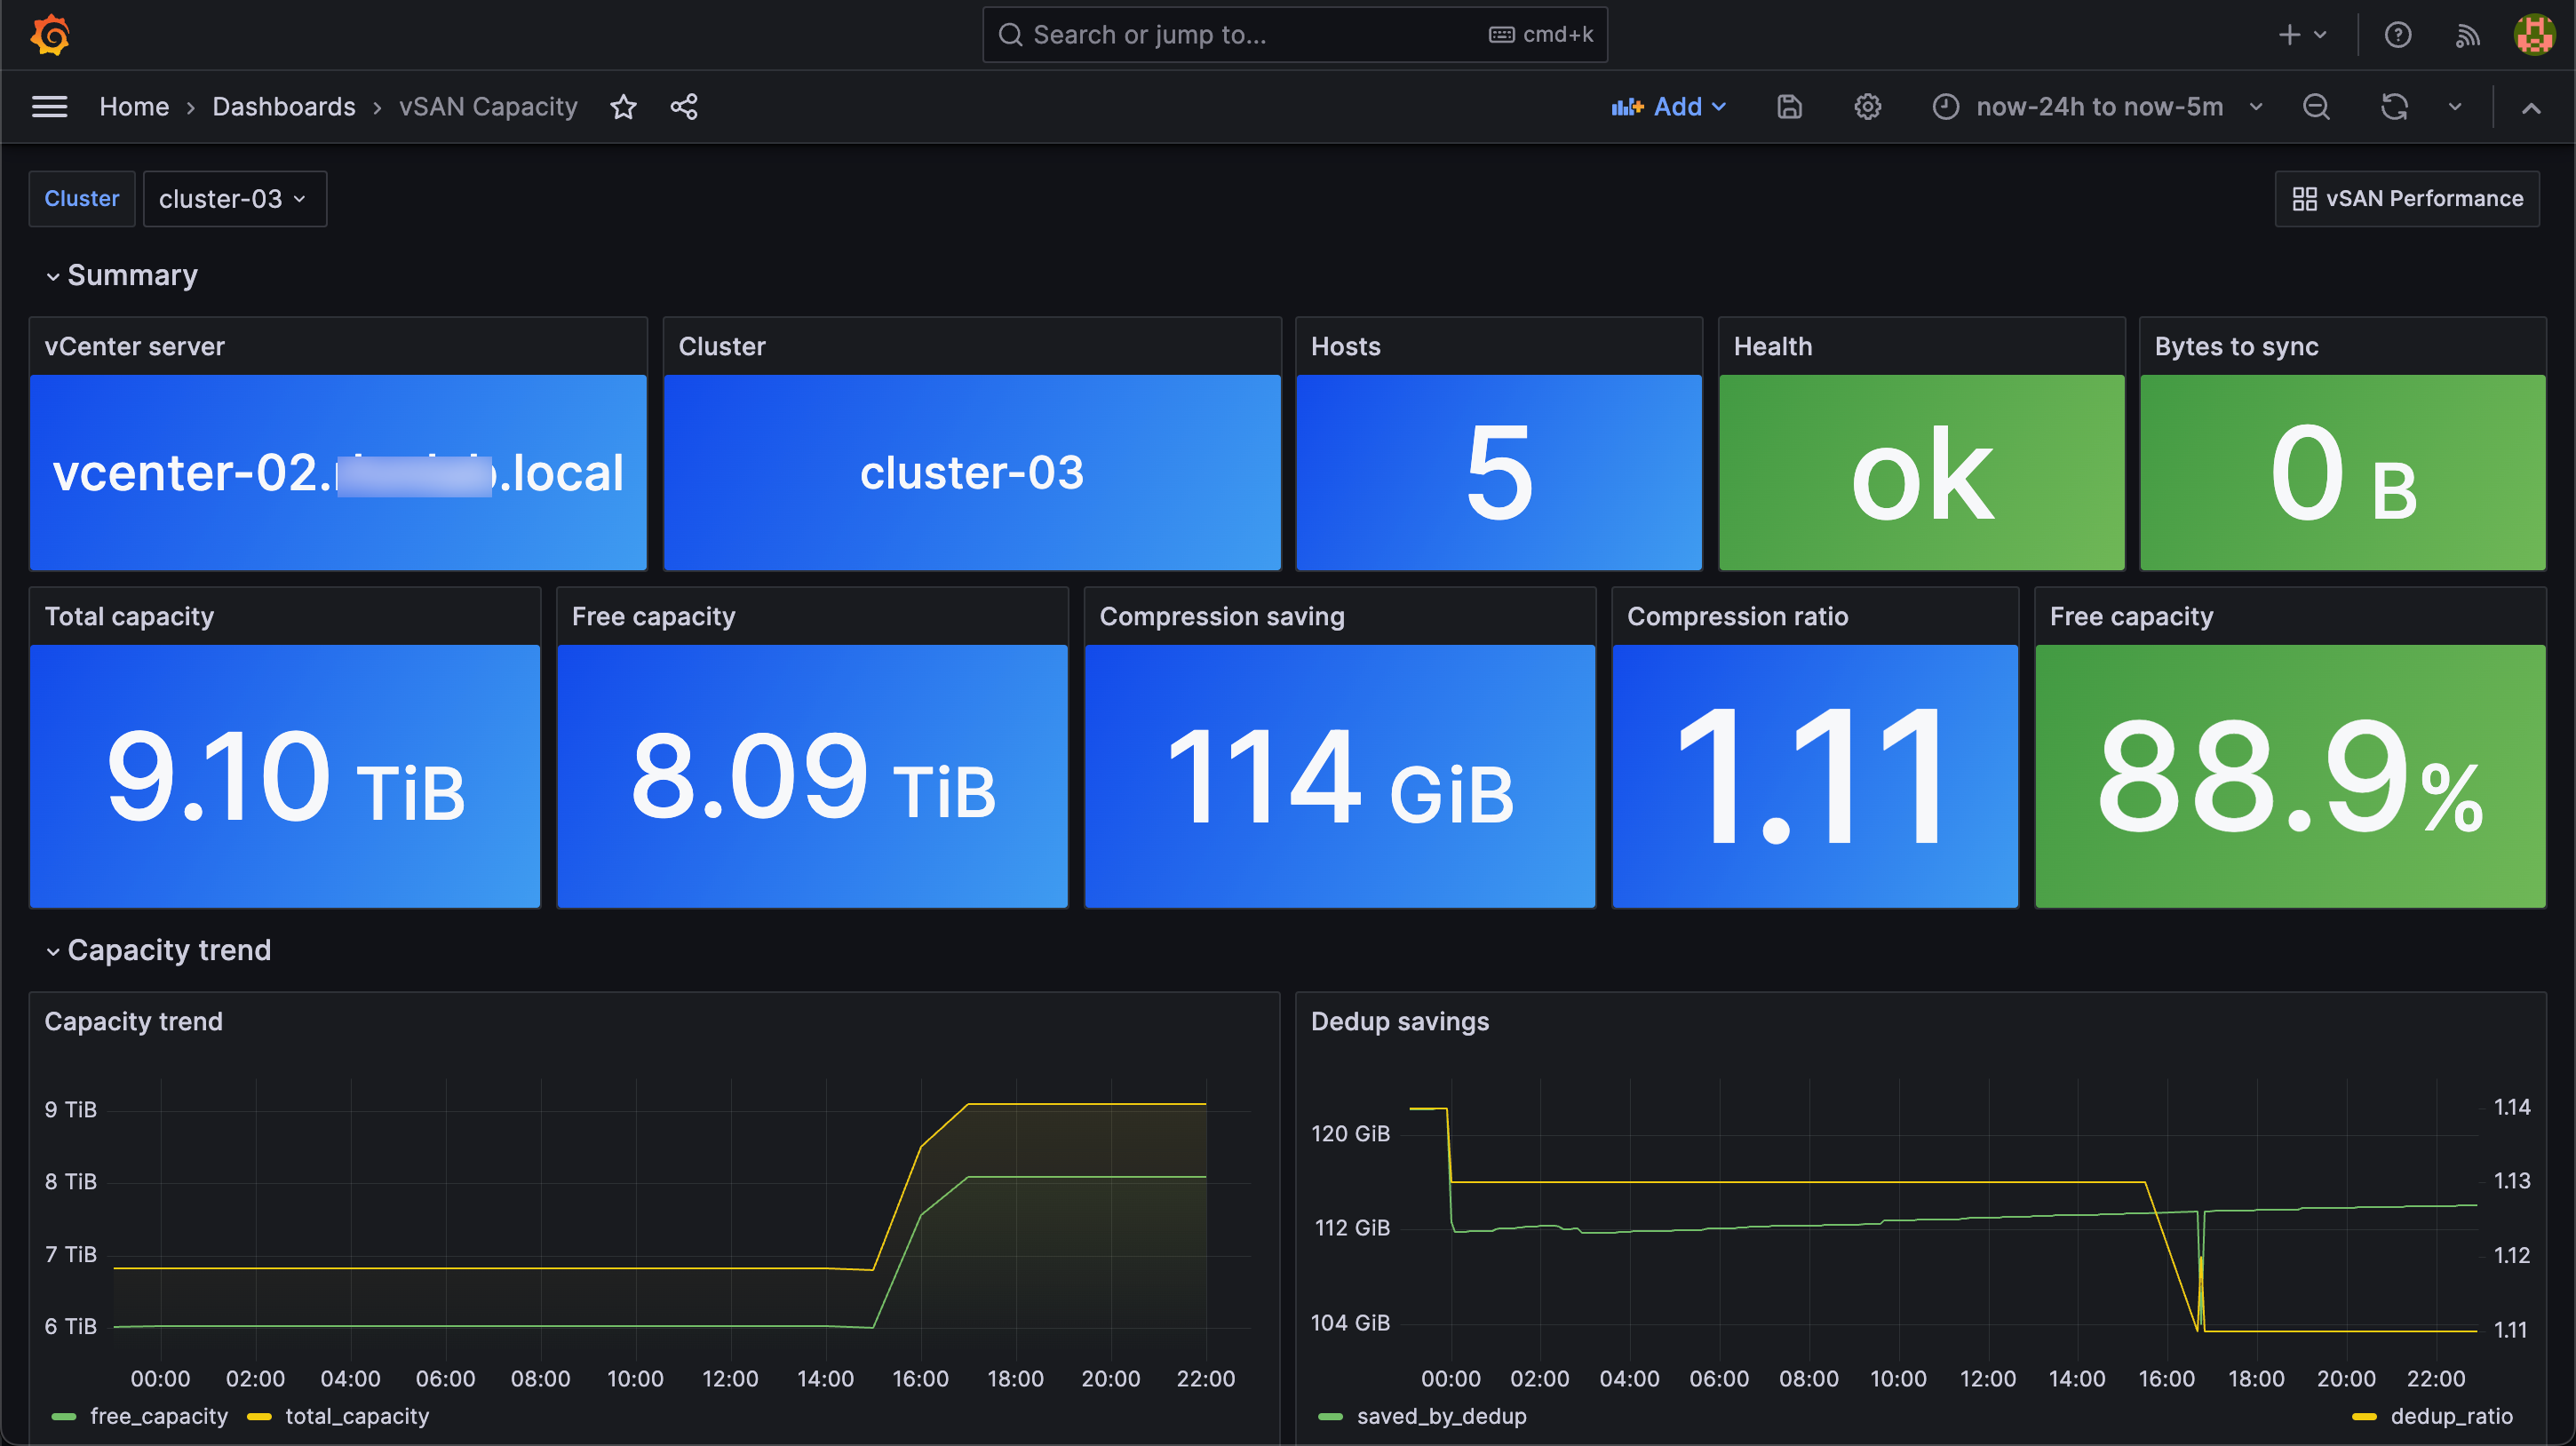
Capacity dashboard
We've also built a dashboard for monitoring the Capacity and the trends in this area.

Note that I was experimenting with a fifth host in the cluster when writing this post, hence the value "5" for hosts
Importing Dashboards in Grafana
Grafana import dashboard documentation
The dashboards are available on Github. To import them in Grafana you can simply copy the JSON and paste it in the "import" wizard in Grafana. Note that the datasource with the Telegraf data should be configured prior to importing the dashboards
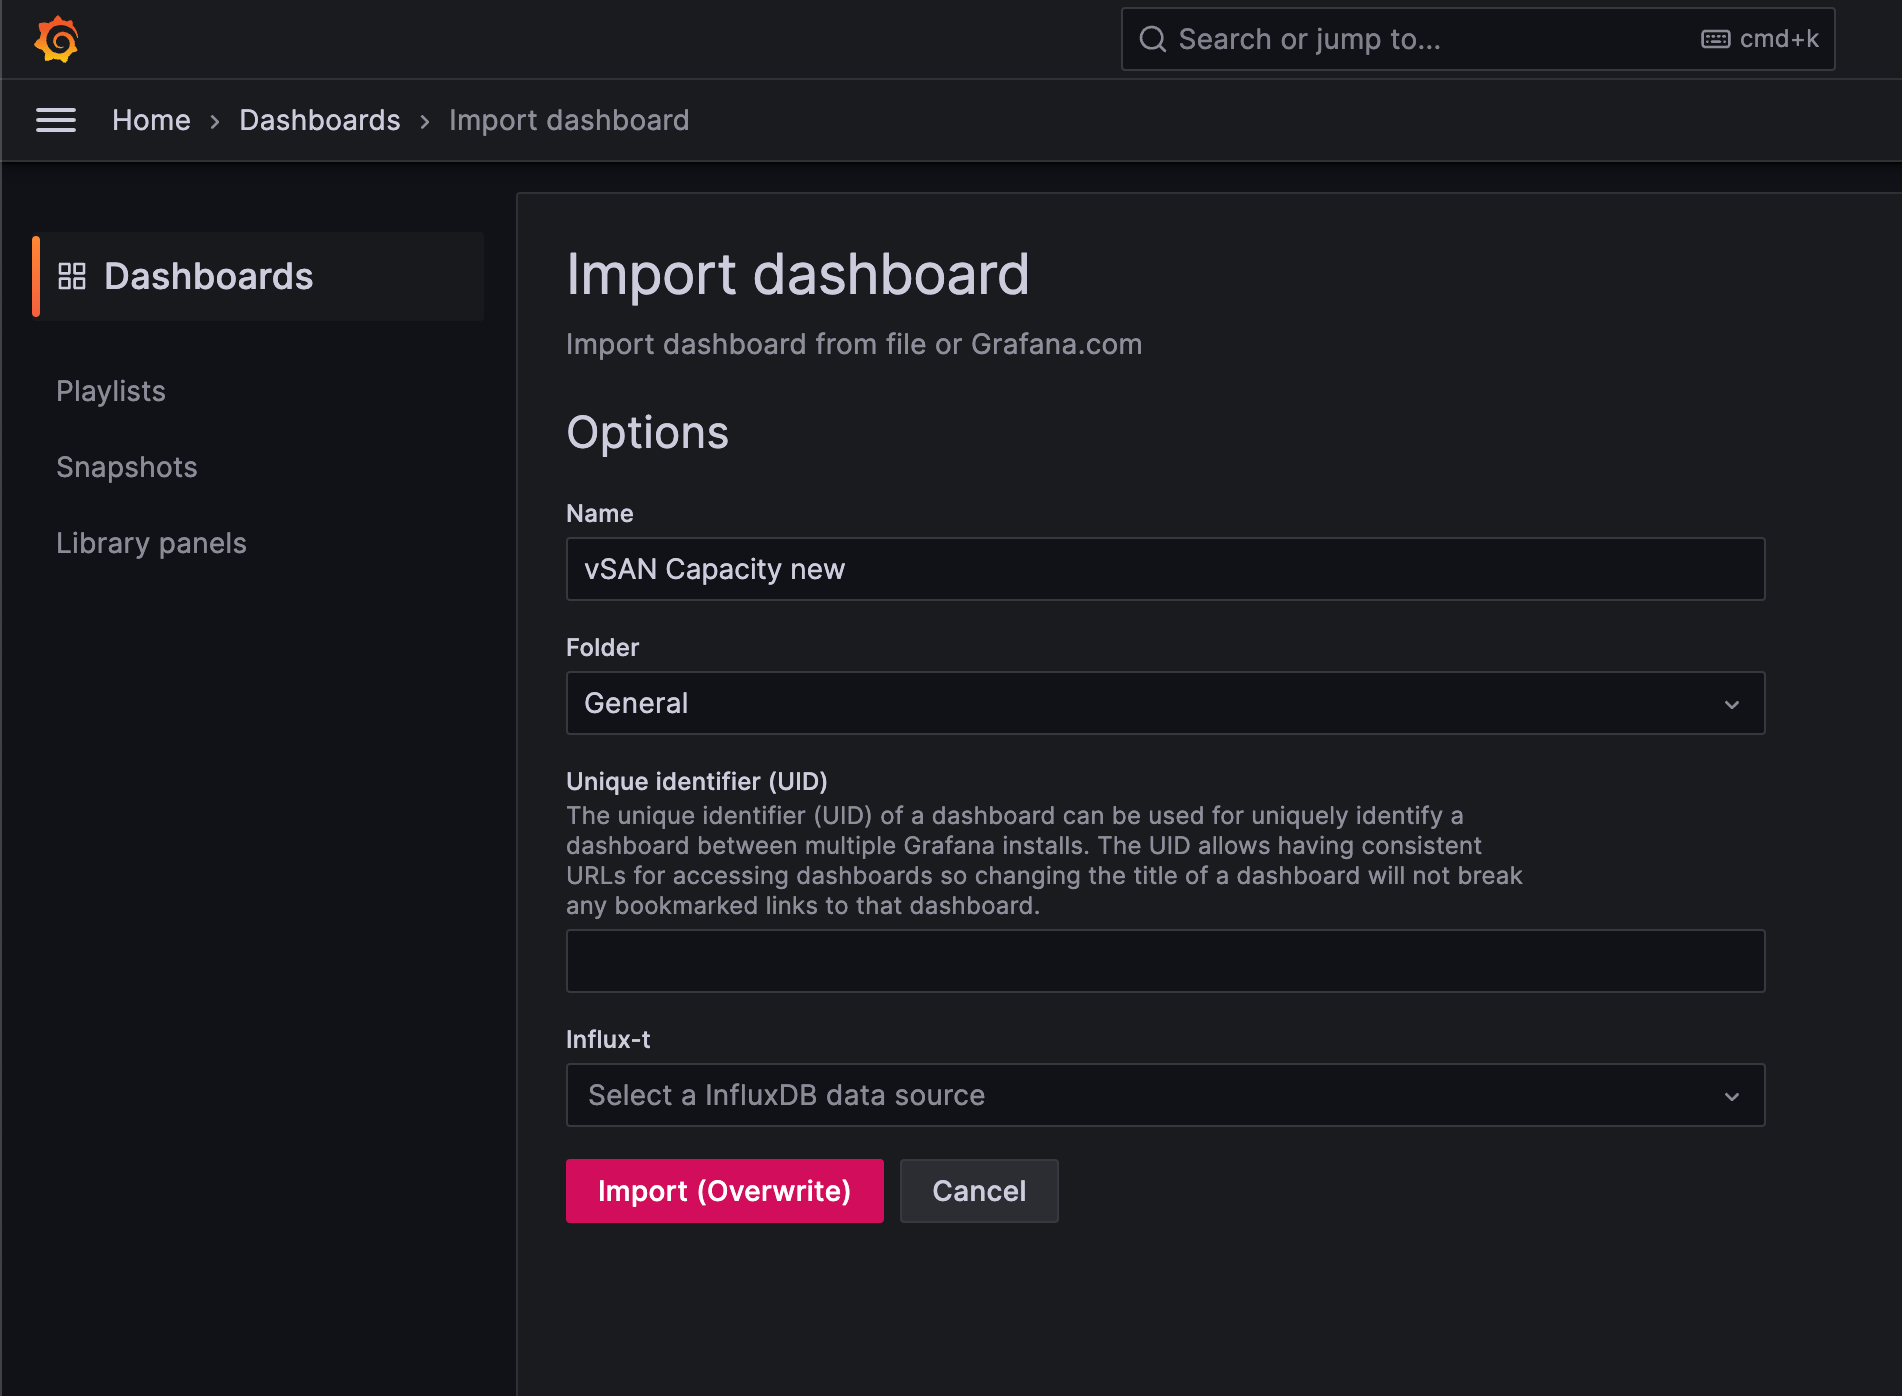
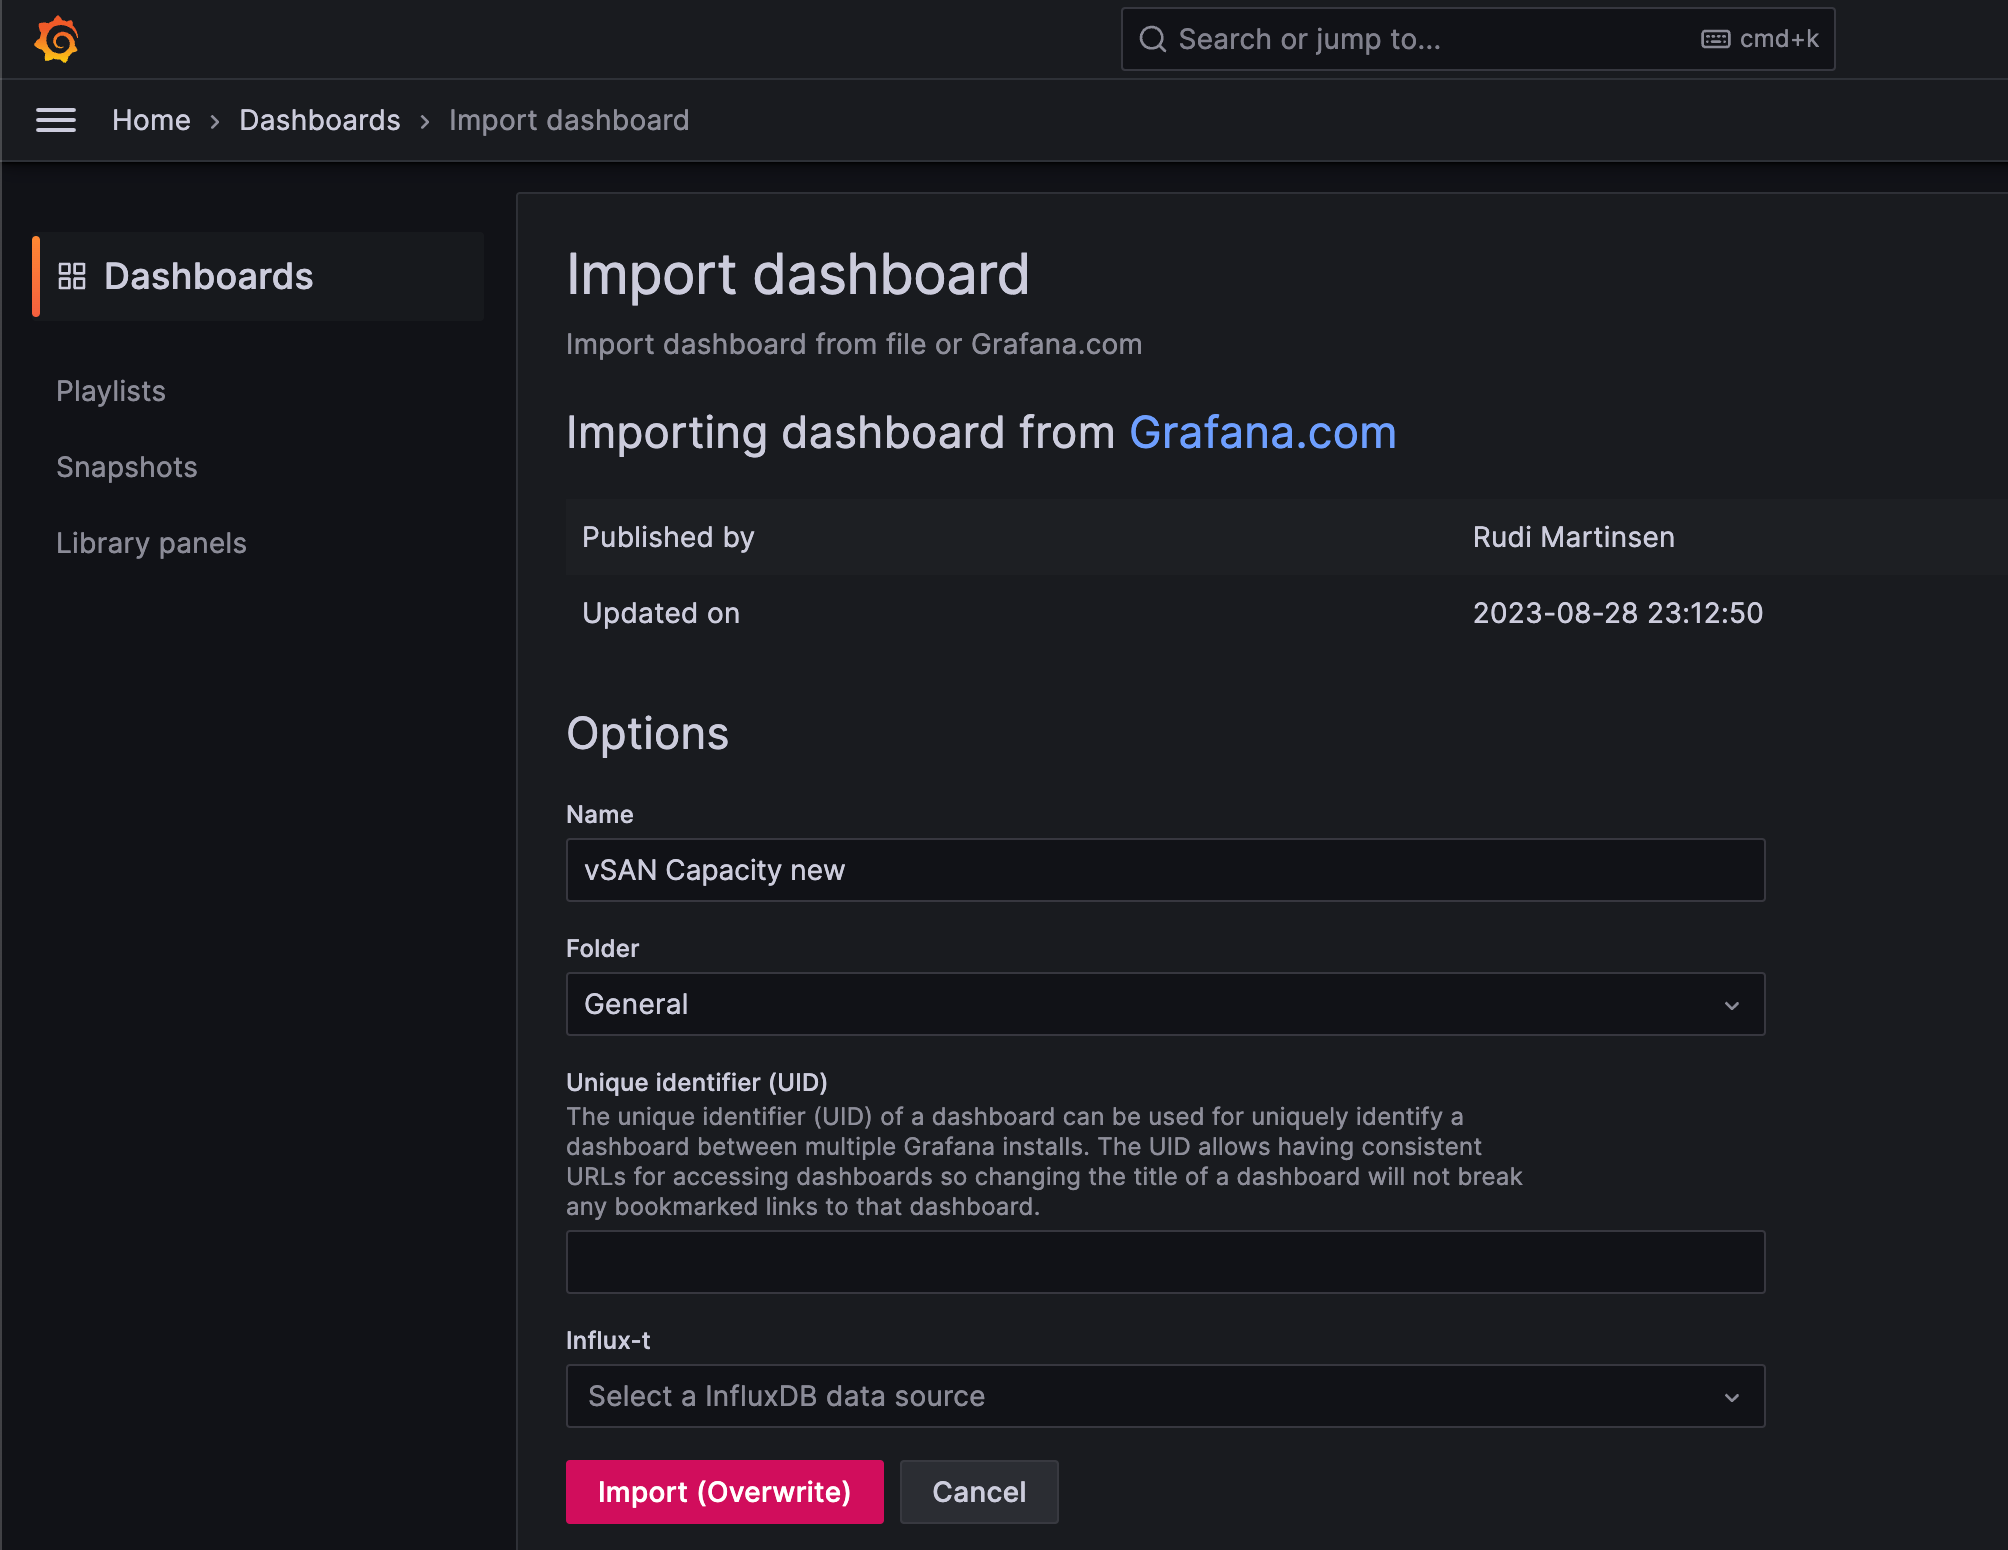
Another option is to import directly from Grafana.com. The two dashboards are available from the community resources:
After adding the specific dashboard ID and clicking Load you'll get the same options for giving the dashboard a name and selecting a input data source