vSphere Performance - Telegraf, Influxdb and Grafana 7 - Manual queries
Overview
Intro
This is the eight part of a blog series about Telegraf, InfluxDB and Grafana where we use vSphere performance data as our metric data.
Over the last posts we have seen a few of the built-in panels in Grafana as well as how to add community plugins which can extend Grafana to make it fit your needs. In this post we will take a look at how and why we would create manual InfluxDB queries in addition to the normal query builder feature.
The posts in this series build on each other, but you should hopefully be able to use them as reference if you're just jumping in to a specific post. I am using vSphere performance data from an InfluxDB database pulled by Telegraf for my examples.
Manual queries
The query editor in Grafana is where you build out your queries to get the values you need to create your graphs. Based on the data source you've selected the query builder looks different and have different features.
InfluxDB Query builder
For InfluxDB you get the query builder as we've seen in previous parts of this series
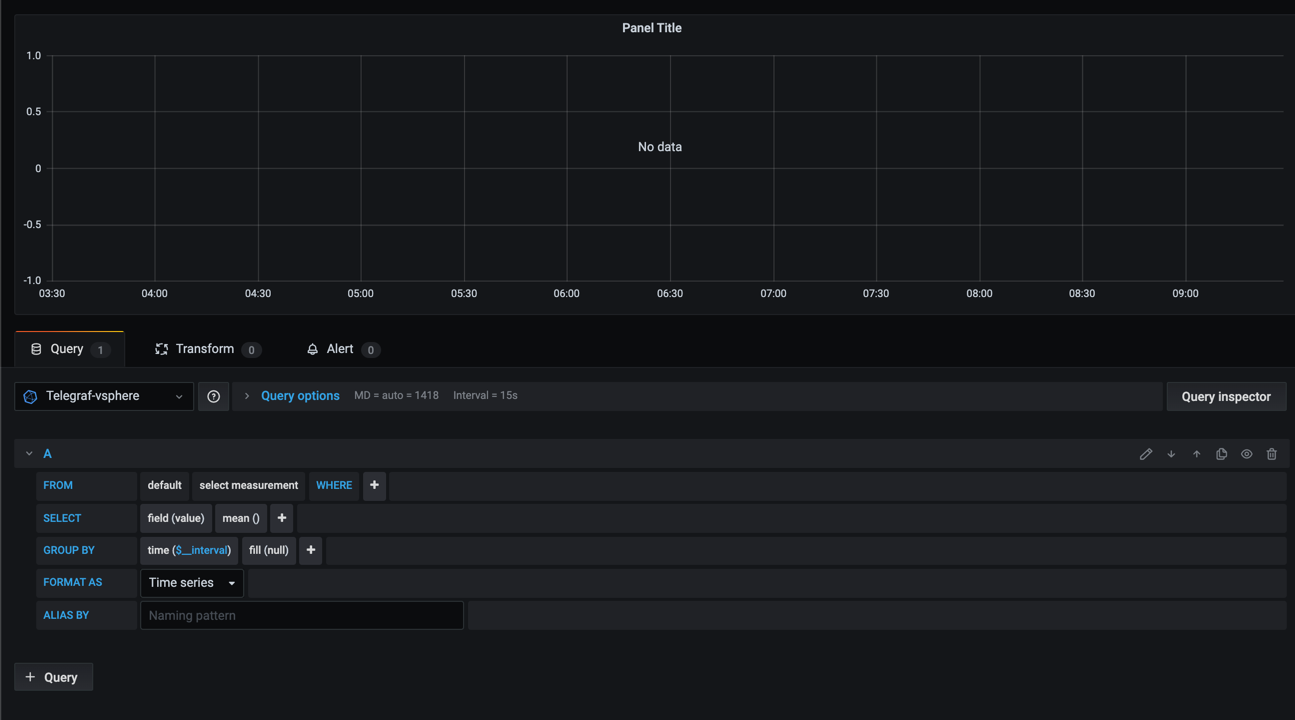
The ability to point and click to build your query is one of the things that makes it so easy to get started with and use InfluxDB.
Prometheus Query builder
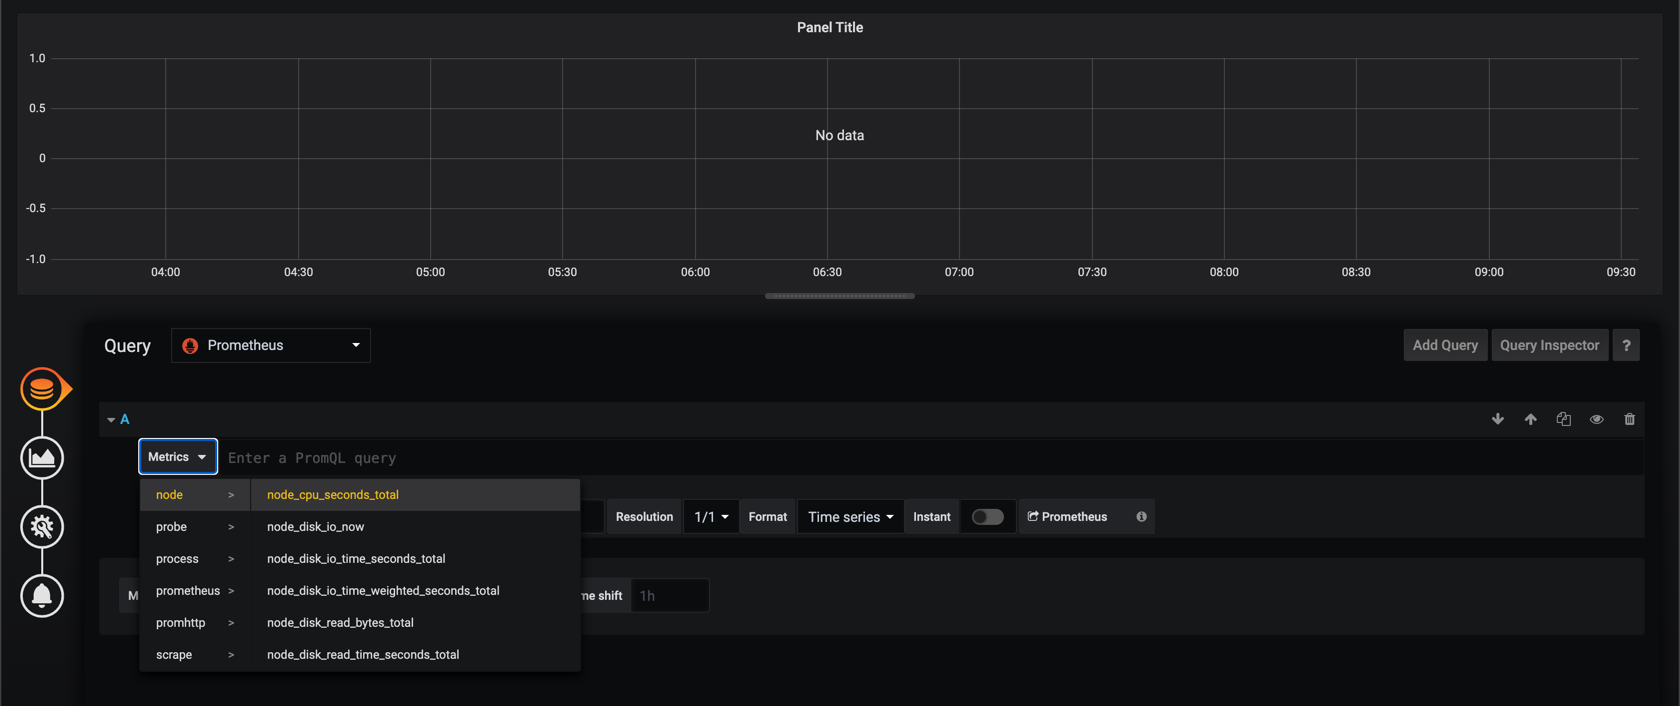
Let's take a look at a query editor with a Prometheus datasource selected
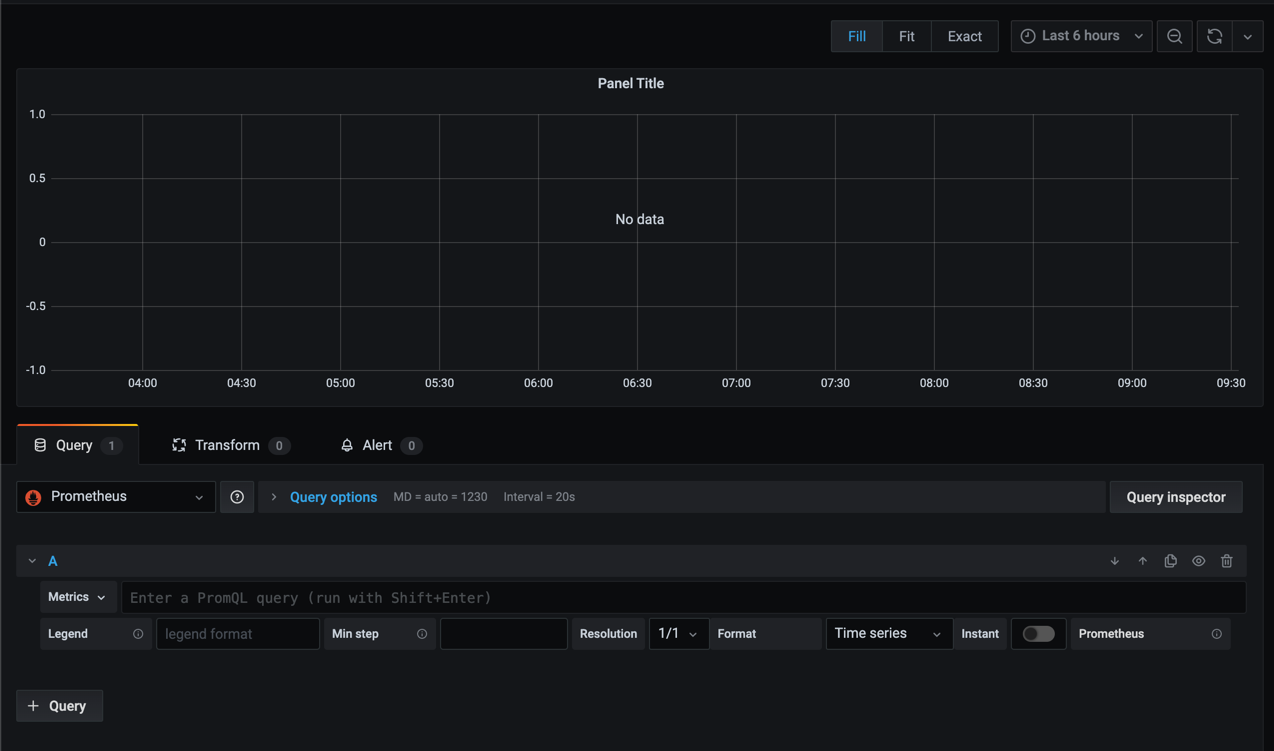
As we can see there's not the same experience as with InfluxDB as the datasource. To be fair it is possible to select the measurement equivalent in Prometheus, but you do not get the filtering options etc
The point here is not to say that InfluxDB is better than Prometheus, because they both have their strengts, as do other databases. But again, I find that InfluxDB is easier to use and to get started with which is key when you are starting out in a project like this.
Why create manual Influx queries?
There will however come situations where the default query builder for InfluxDB won't give you exactly the options that you need. Then you can choose to switch to the Text edit mode
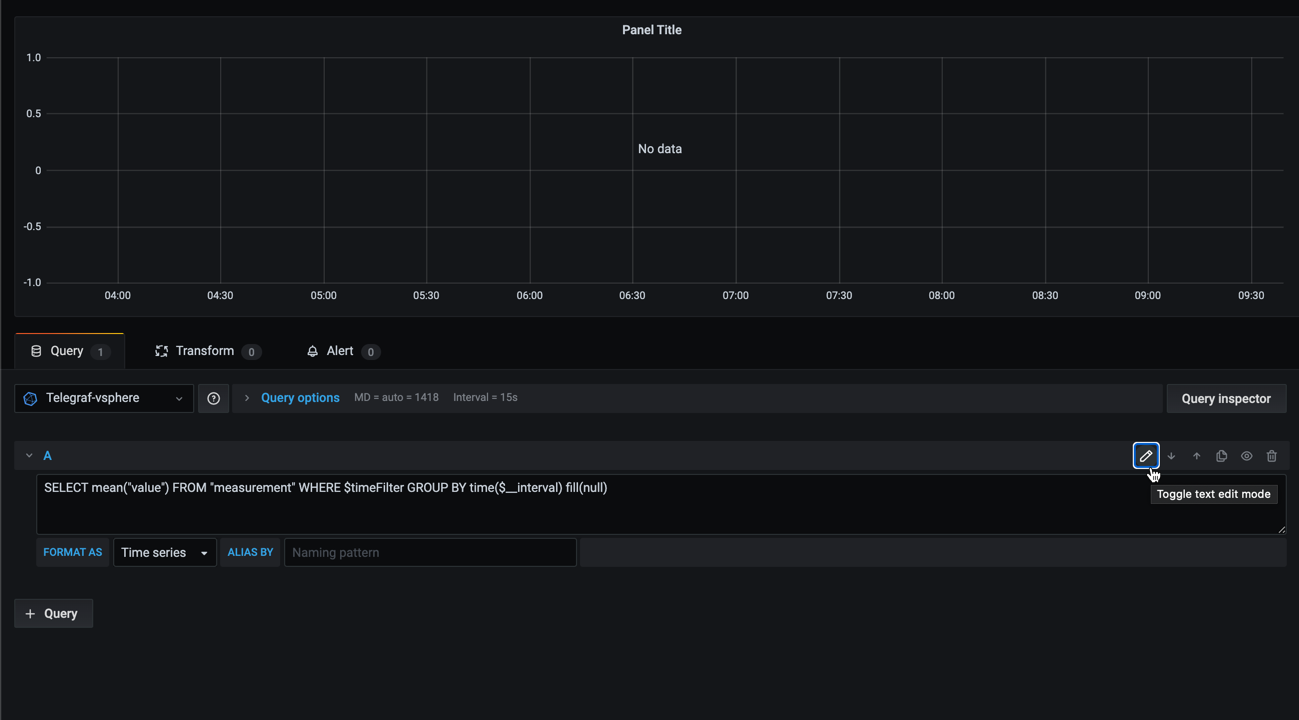
In here you can write your Influx query as you would do in the Influx CLI.
We'll take an example of building a query for showing the count of ESXi hosts in a specific cluster. In our database we have no measurement with the count of hosts available so we need to derive this from a metric query.
If you have experience with relational databases like MS SQL you're maybe familiar with using functions to count things in a table based on a grouping or filtering and that's what we'll do in this case.
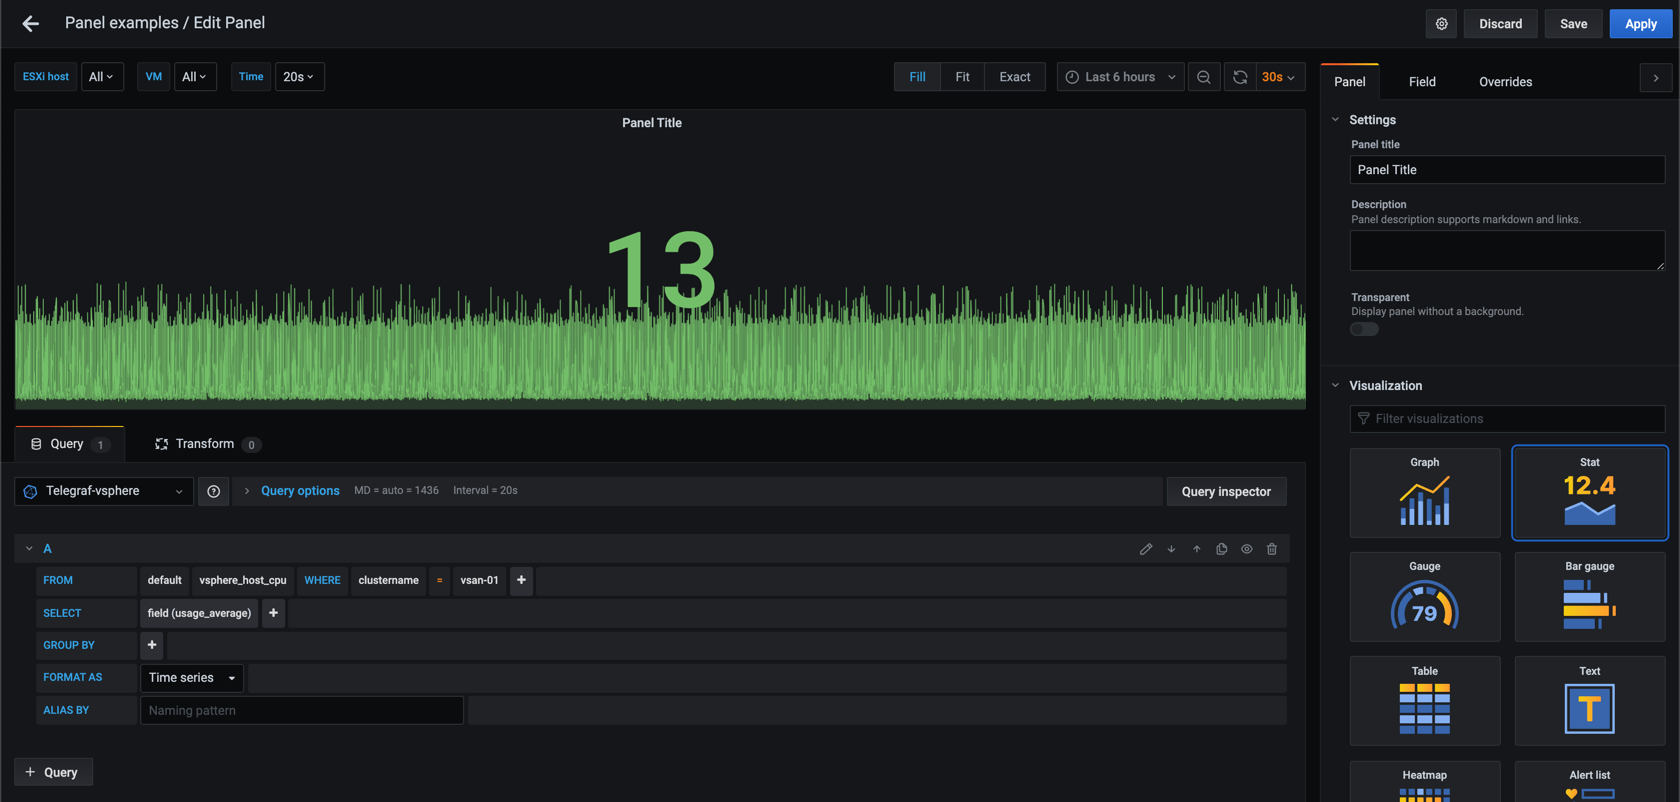
First I'll switch the visualiztion panel to a Stat panel, and I'll select one of the host measurements and fields and filter on my cluster so I don't need to type in that from memory. Note that I have removed the default grouping on time as this won't work in our final query
Now let's switch to Text edit mode
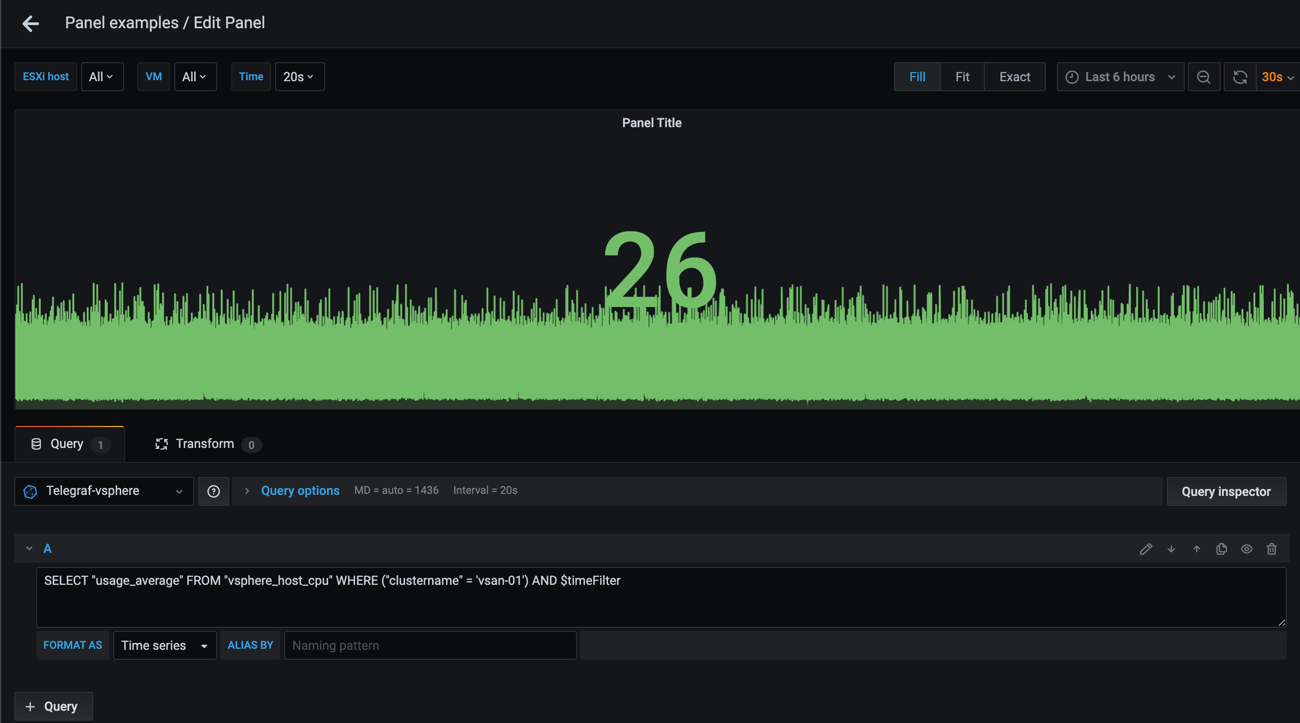
We have a functioning query and we can see that we have three different hosts that reports data. What we want is to get the specific count, 3, instead of the metric values.
The clue here is to construct a query against a sub query, the same technique as you might use in normal SQL. So we'll keep our initial query, but do a new query on the result of that initial query.
To do that we'll add in a new SELECT statement around the initial query
The initial query
1SELECT "usage_average" FROM "vsphere_host_cpu" WHERE ("clustername" = 'vsan-01') AND $timeFilter
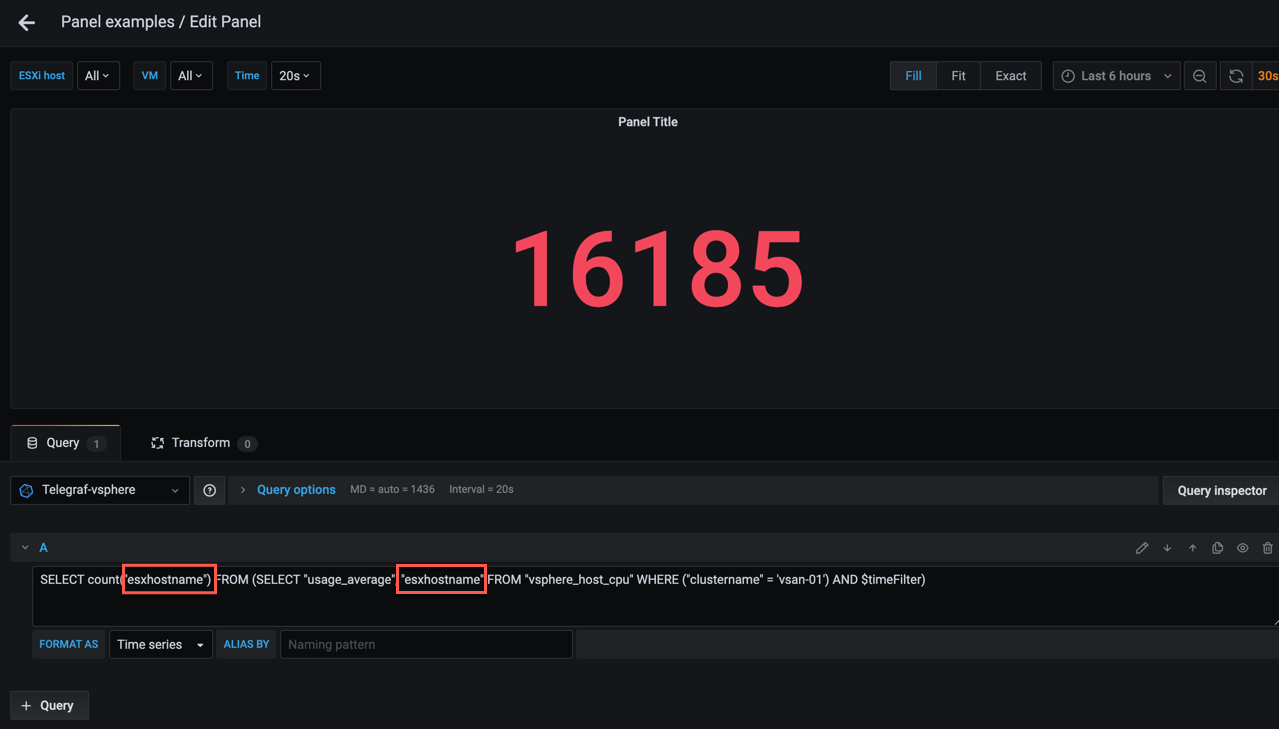
When we add the new SELECT statement we'll use the count function, and we need to specify what we want to count. In our case that would be ESXi hosts which we have in the esxhostname tag. To be able to count on that we also need to adjust the initial query so it will add the tag in it's result.
1SELECT count("esxhostname") FROM (SELECT "usage_average", "esxhostname" FROM "vsphere_host_cpu" WHERE ("clustername" = 'vsan-01') AND $timeFilter)
We get a single count result, but not exactly the result we expected. I do not have room for over 16000 hosts in my lab!
Of course we need to query the distinct count of hosts
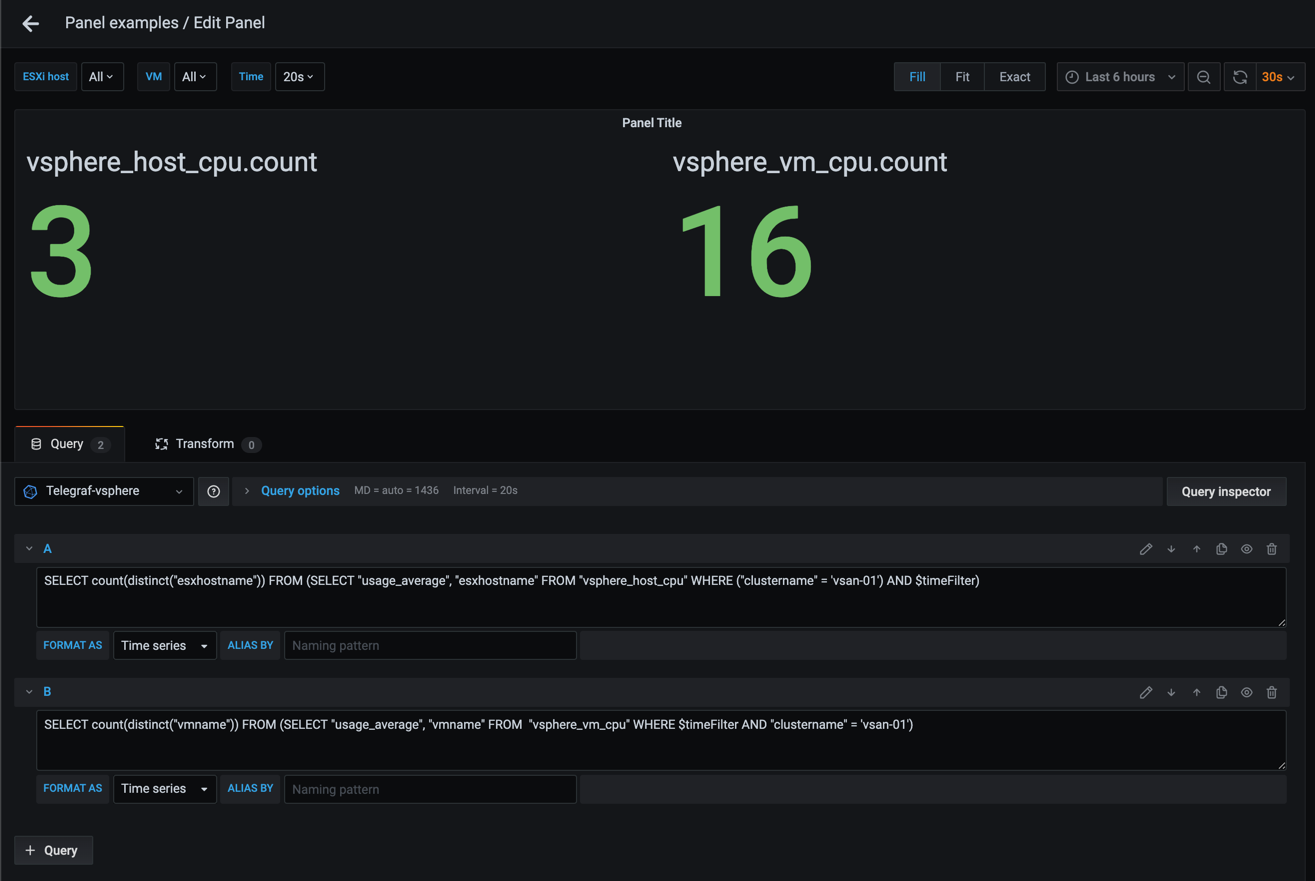
1SELECT count(distinct("esxhostname")) FROM (SELECT "usage_average", "esxhostname" FROM "vsphere_host_cpu" WHERE ("clustername" = 'vsan-01') AND $timeFilter)
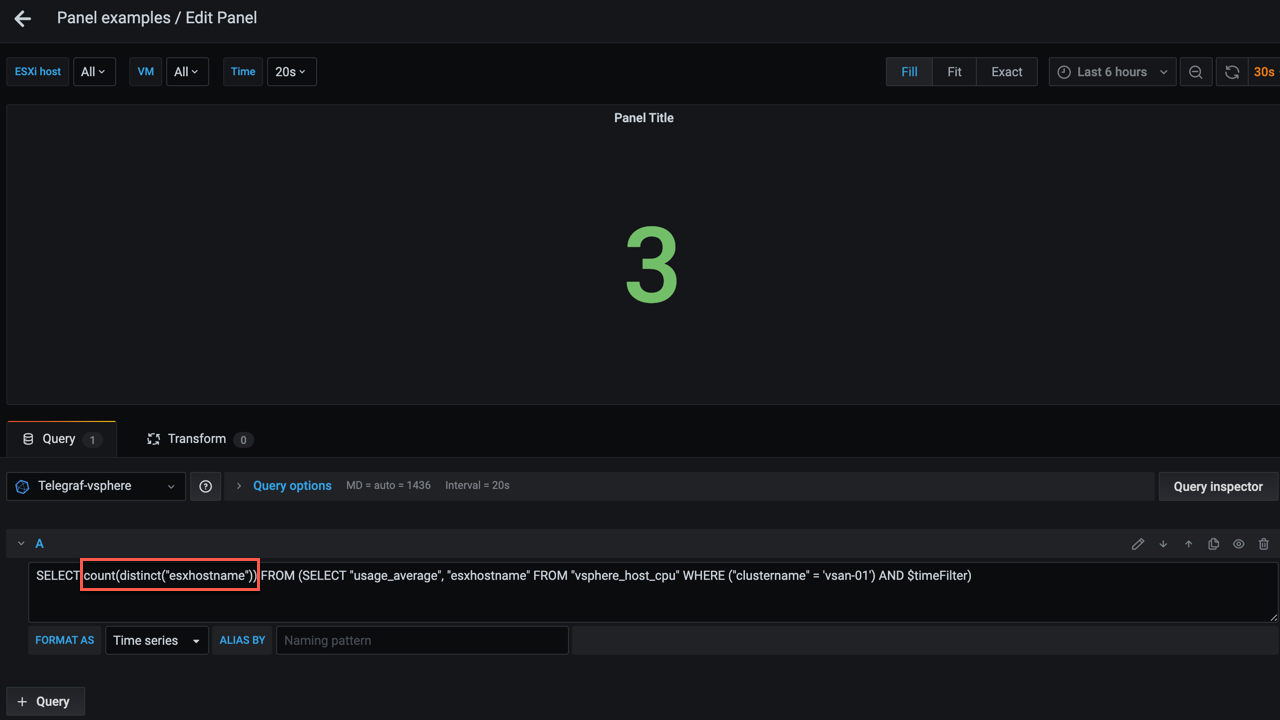
That looks better. Now we can add a query for the count of VMs in a cluster in the same way
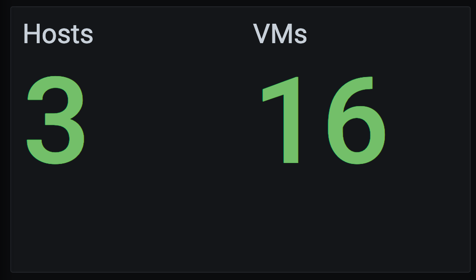
The finished result, now with headings for the two values which is set through field overrides which we discussed in a previous post
Summary
This post has been about how and why you would create manual InfluxDB queries with the Text edit mode instead of using the normal query builder where you can click and choose fields, tags etc.
This technique might not be one you need to use very often, but it's very powerful to have in your toolbox so you can build that perfect dashboard.
Thanks for reading, and as always, feel free to reach out if you have any questions or comments