vSphere Performance - Telegraf, InfluxDB and Grafana 7 - The Stat Panel
Overview
Intro
This is the sixth part of a blog series about Telegraf, InfluxDB and Grafana where we use vSphere performance data as our metric data.
In the last post we discussed how to use the Variable feature in Grafana, building on what we discussed around Grouping and Filtering. This post will introduce the Stat panel which is one of many visualization panels available in Grafana.
These posts build on each other, but you should hopefully be able to use them as reference if you're just jumping in to a specific post. I am using vSphere performance data from an InfluxDB database pulled by Telegraf for my examples.
The new stat panel deserves it's own blog post because of all the possibilities in it, and it has become my favorite panel in Grafana!
Note: I started working on this post on Grafana 7.0. In Grafana 7.1 a new text mode was added to the panel which is not covered in this post
Stat panel
In Grafana 6 a new panel was released in beta, the stat panel. The panel is similar to the singlestat panel and as it went GA in Grafana 7 it replaces the singlestat panel which is now deprecated.
What is very nice with Grafana, and the development behind it, is that there has always been a smooth way to migrate from an older version of a panel to a new one so if you already have a lot of singlestat panels and have upgraded to Grafana 7 you should be able to migrate singlestat panels to stat panels with just a few clicks.
Create panel
To get started with a stat panel we click the "Add panel" icon at the top which presents a Graph panel editor by default. Note that in Grafana v6 and earlier you got to choose the panel type at this point, but as we'll see it's very easy to switch panel types.
Let's quickly set up a query so we have some data to play with. We'll select the correct datasource, select the vsphere_host_cpu measurement, the usage_average field and add a where filter for the esxhostname tag. I also have to specify the Min interval time interval to get the data correct.
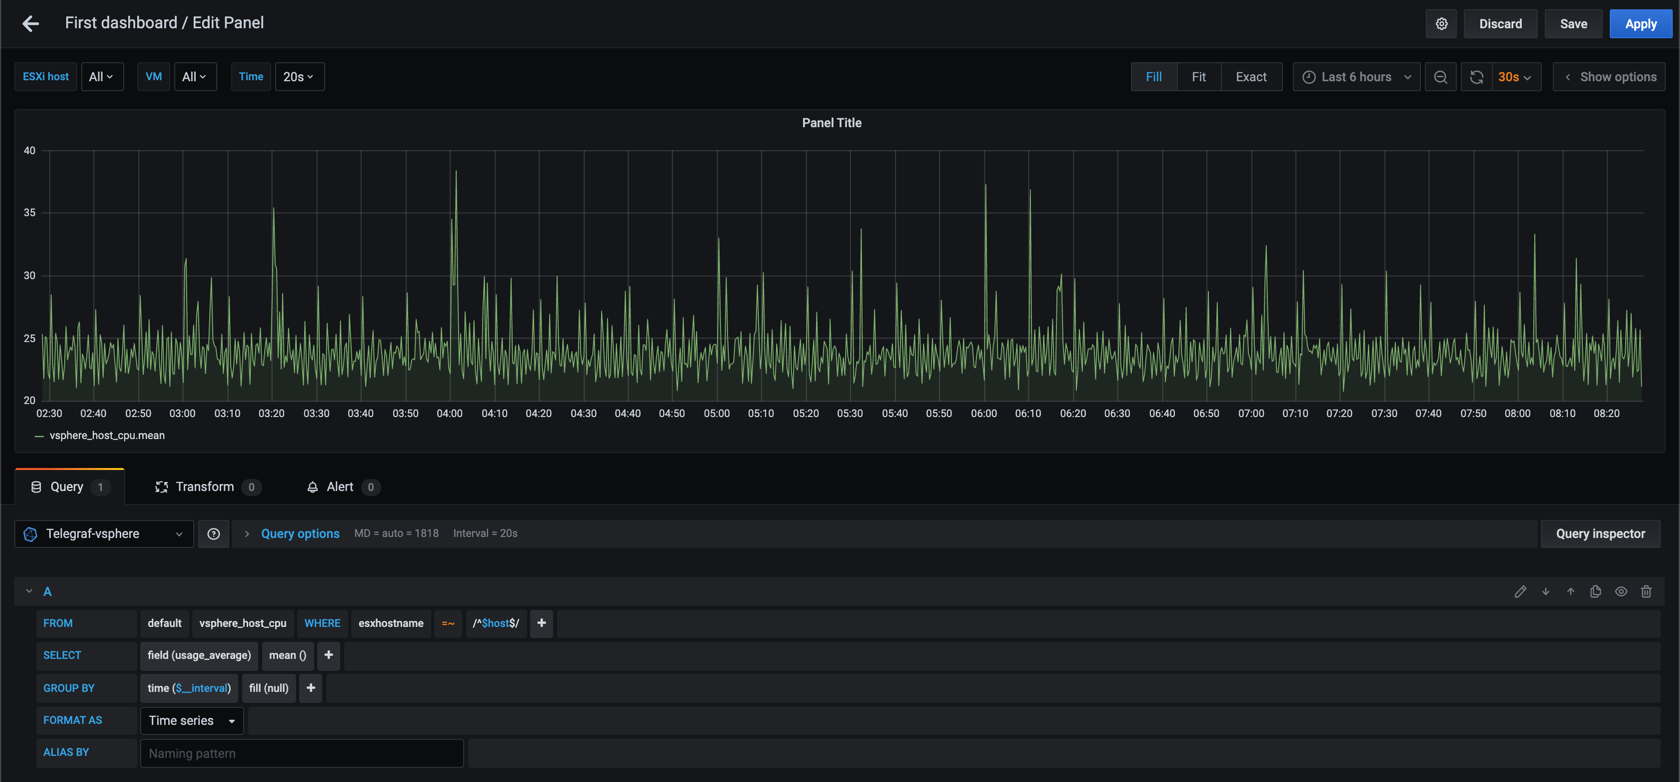
If you've followed this series this graph should be familiar as we have used this in the previous examples. Now let's change this so we get a Stat panel.
Switching panel type
To do this we expand the Visualization section of the Panel options. The Panel options has been reworked in Grafana 7 so if you are on an older version the UI will be different.
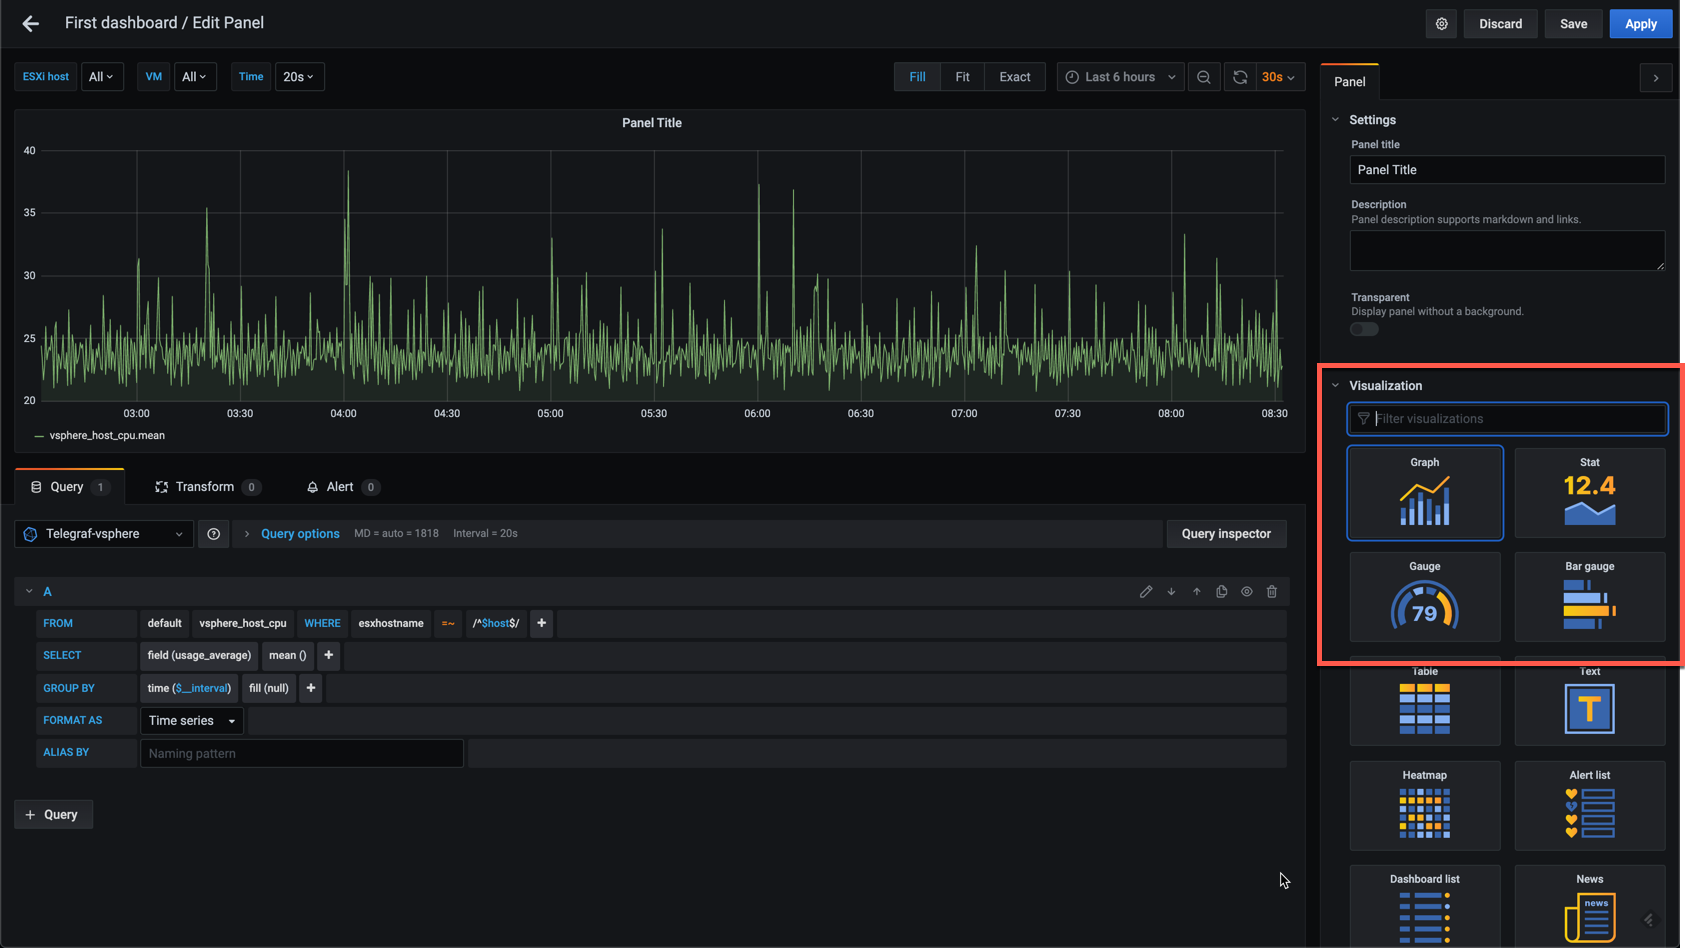
As we can see there's lots of panels to choose from, but for now let's select the Stat panel.
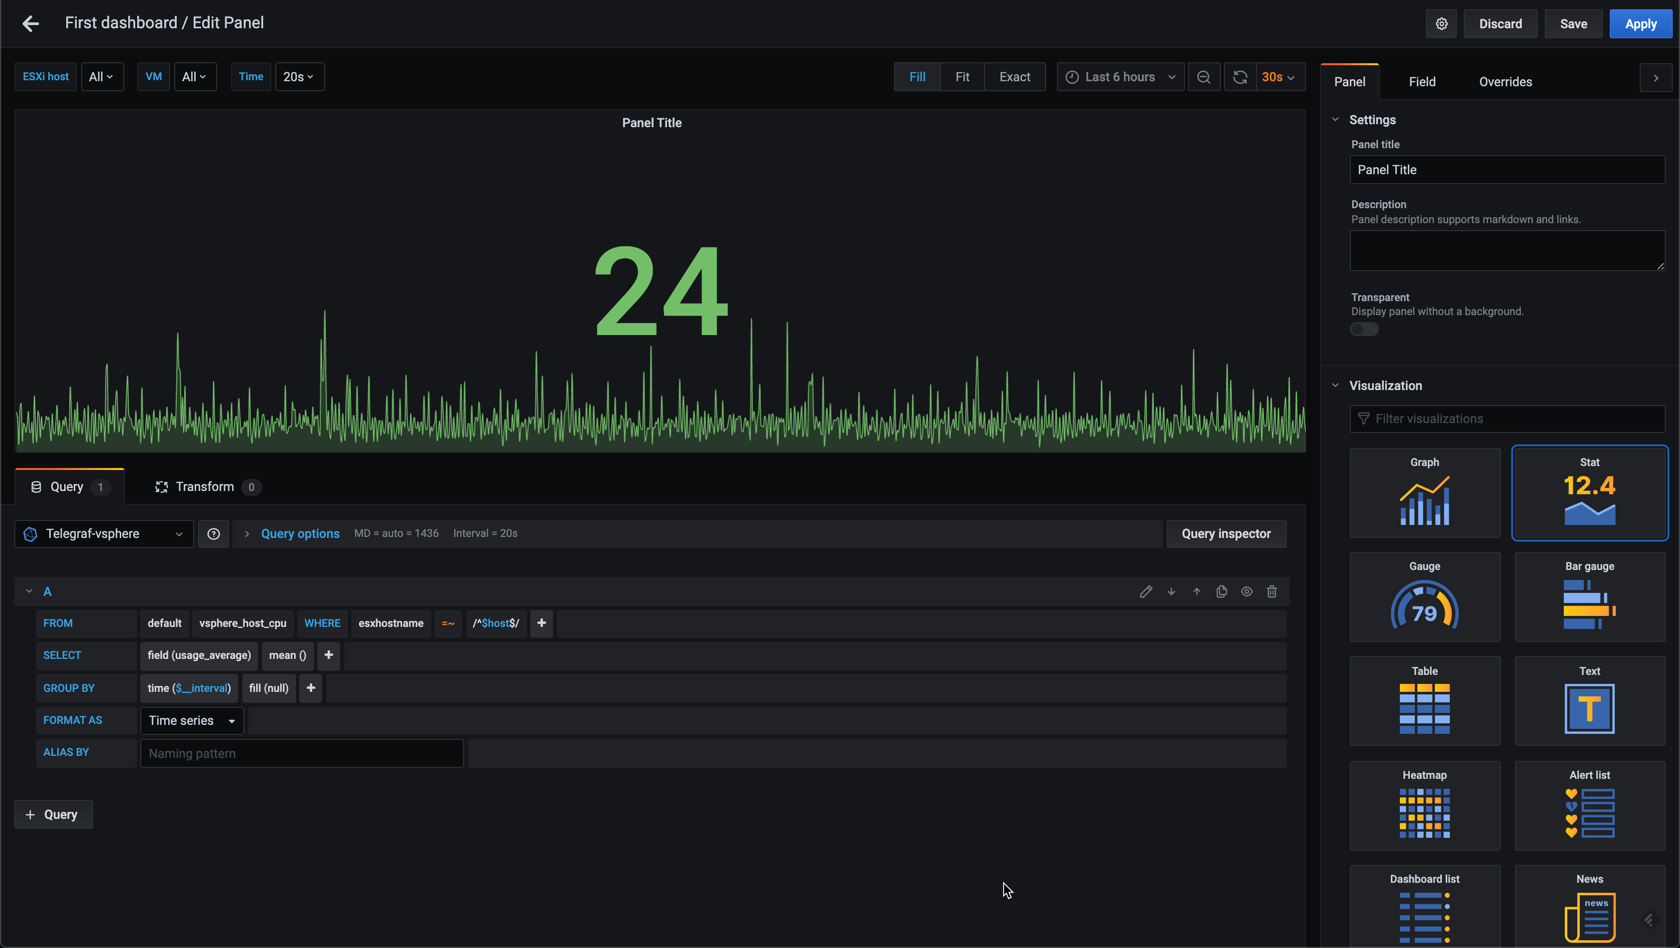
Easy right? Now let's check a few of the options of the Stat panel so we can customize our panel.
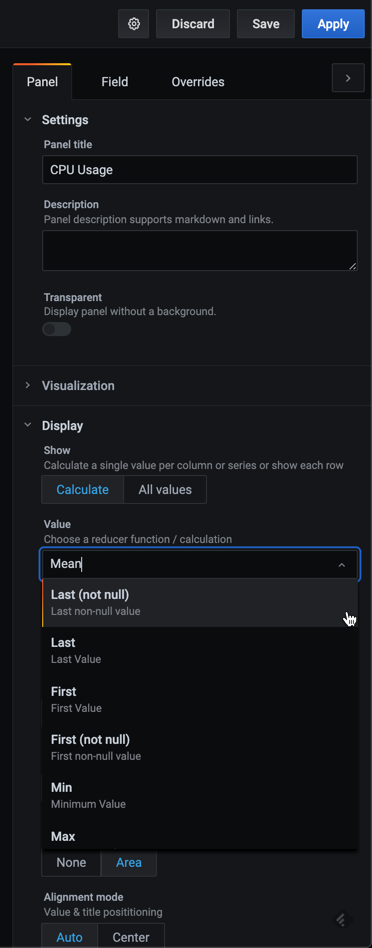
Panel options
First we'll set the Panel title as we've seen with the Graph panels. Normally I find it most interesting to display the current, i.e. the Last, value in Stat panels, by default the Mean value is displayed. To fix this expand the Value dropdown to select the Last (not null) option
Color and Graph modes
Now, let's see what the Color Mode option does. Switching from the default Value to Background
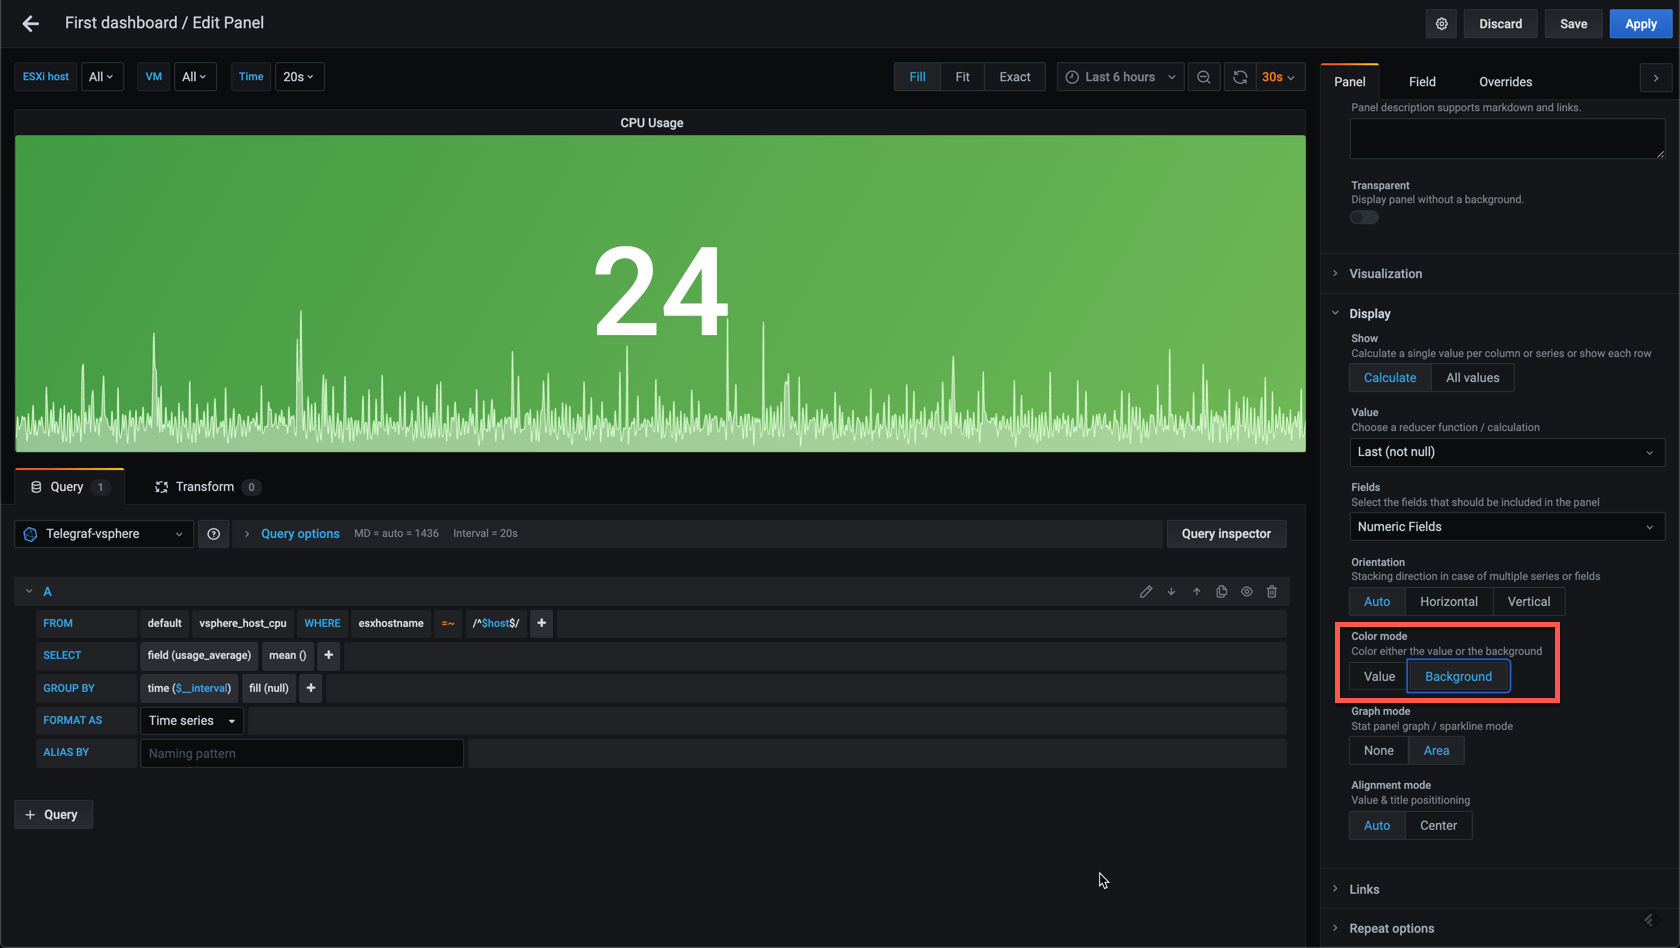
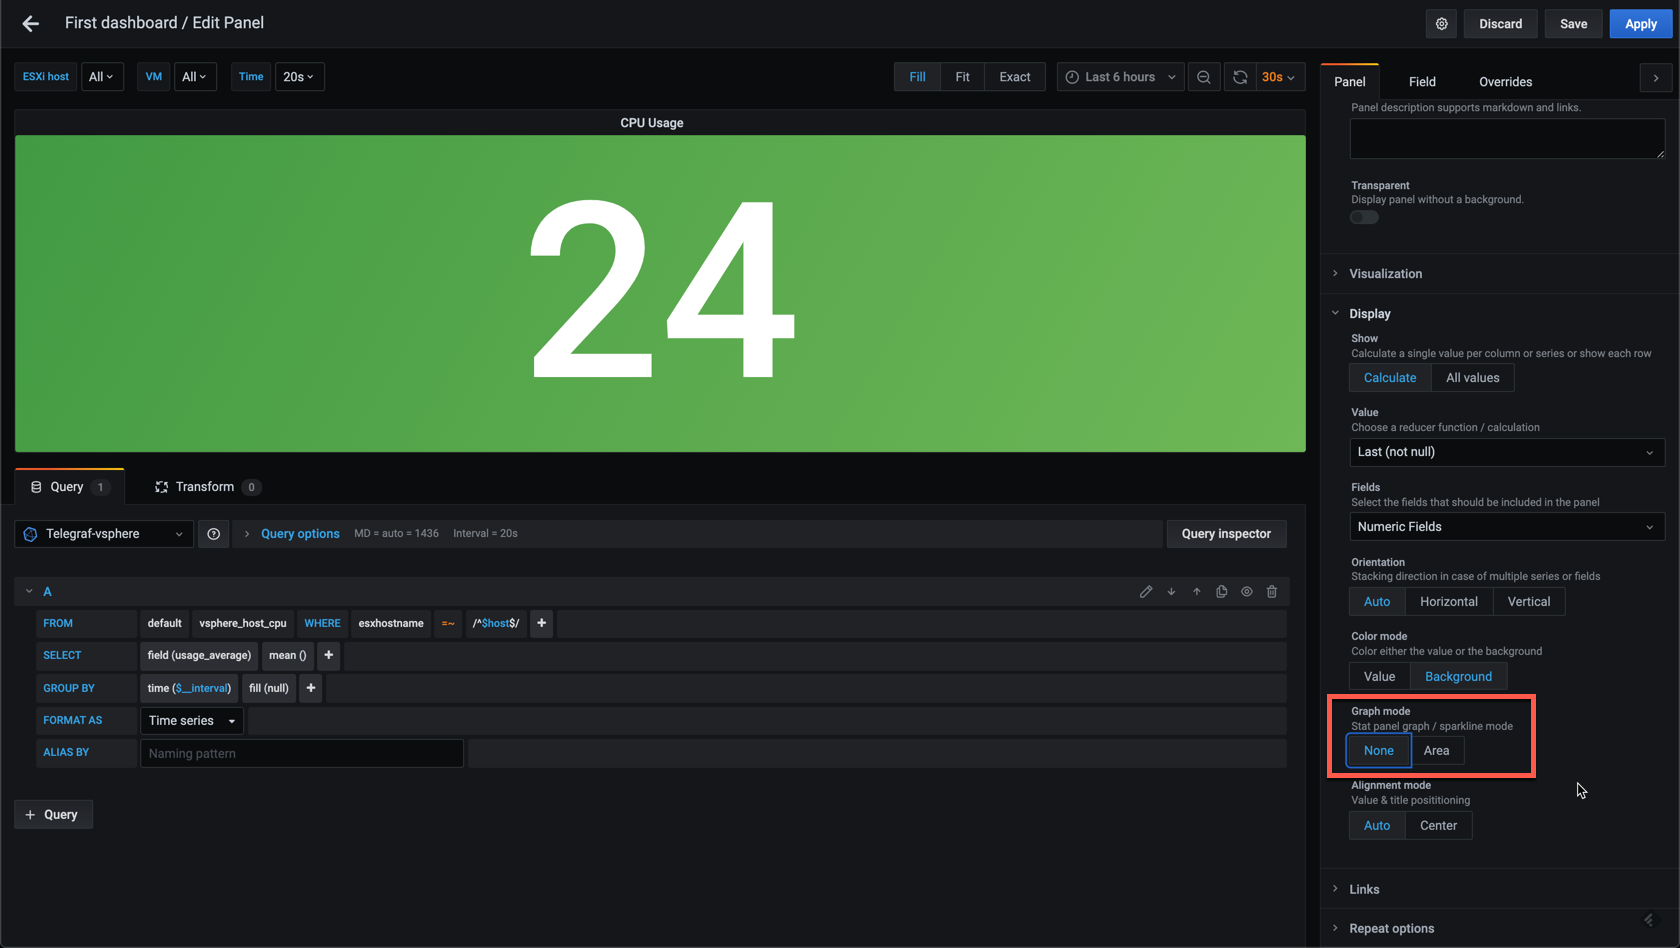
Neat, or what? By default there's also a graph displayed on the panel. If you want to remove this you control this with the Graph mode option
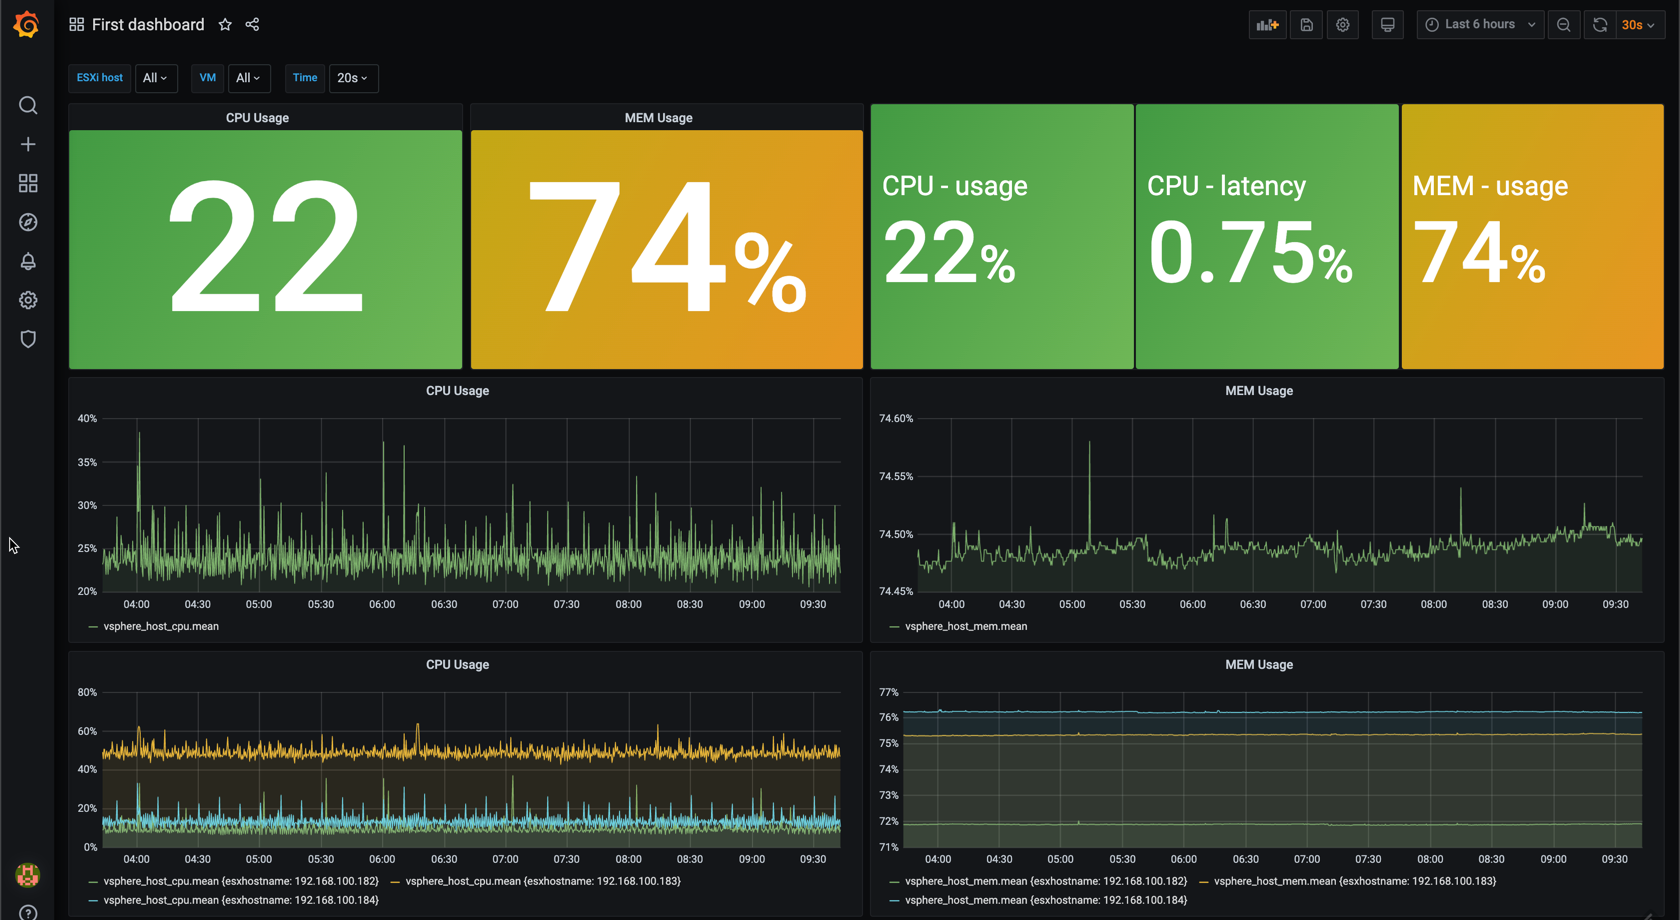
Let's take a look at our current dashboard
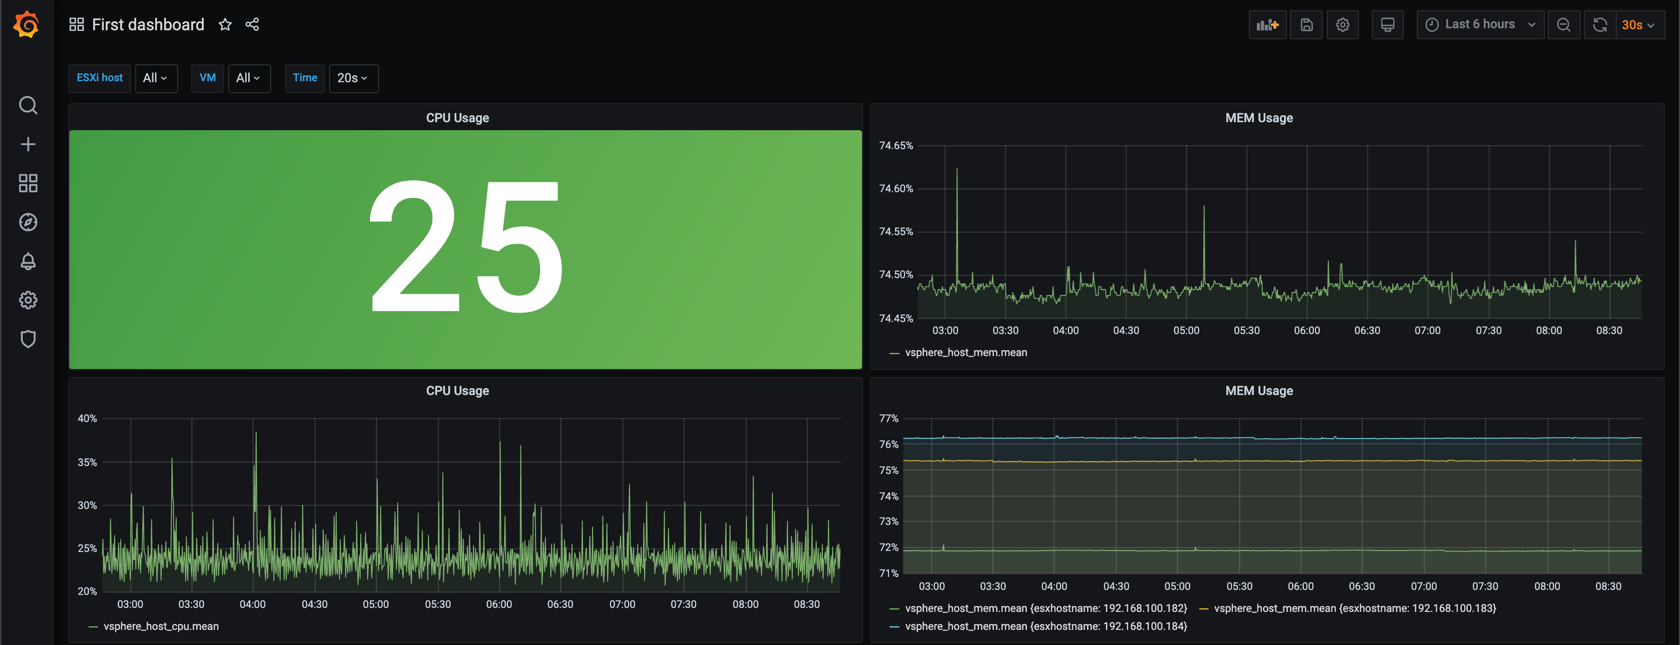
Let's duplicate the stat panel and configure this to use the vsphere_host_mem measurement so we have one for the Memory usage as well.
Field options
Now, let's explore a few options in the Stat panel found in the Field tab of the Panel options. Again, this section is completely new in Grafana 7 so in previous versions these options is placed elsewhere in the editor.
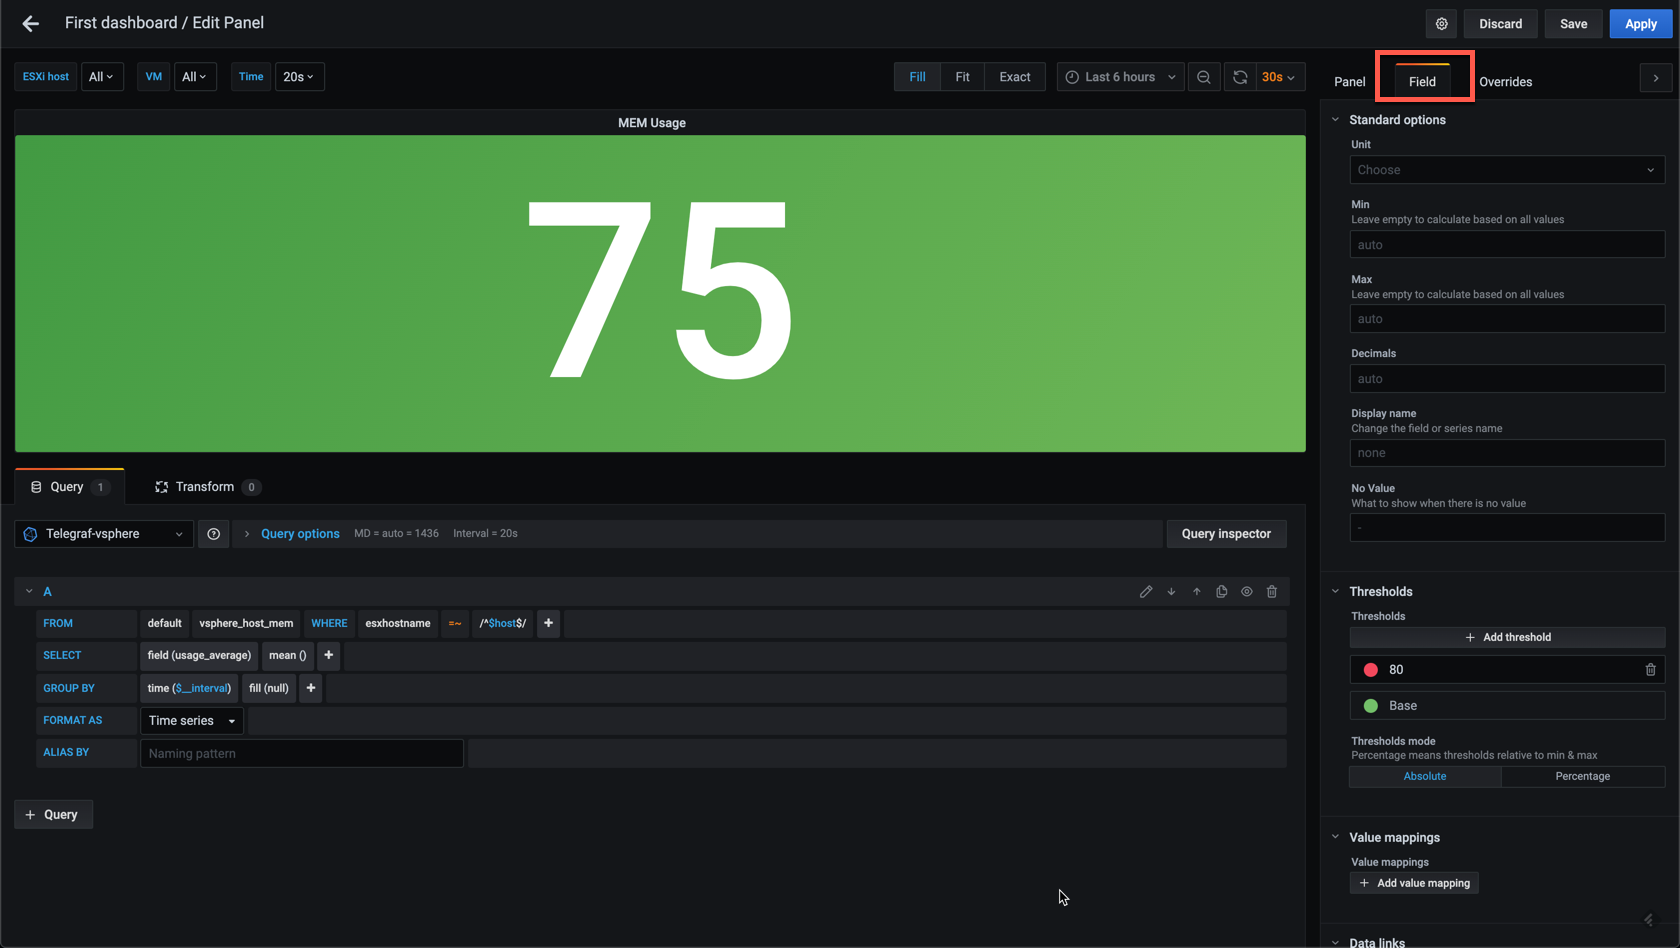
Thresholds
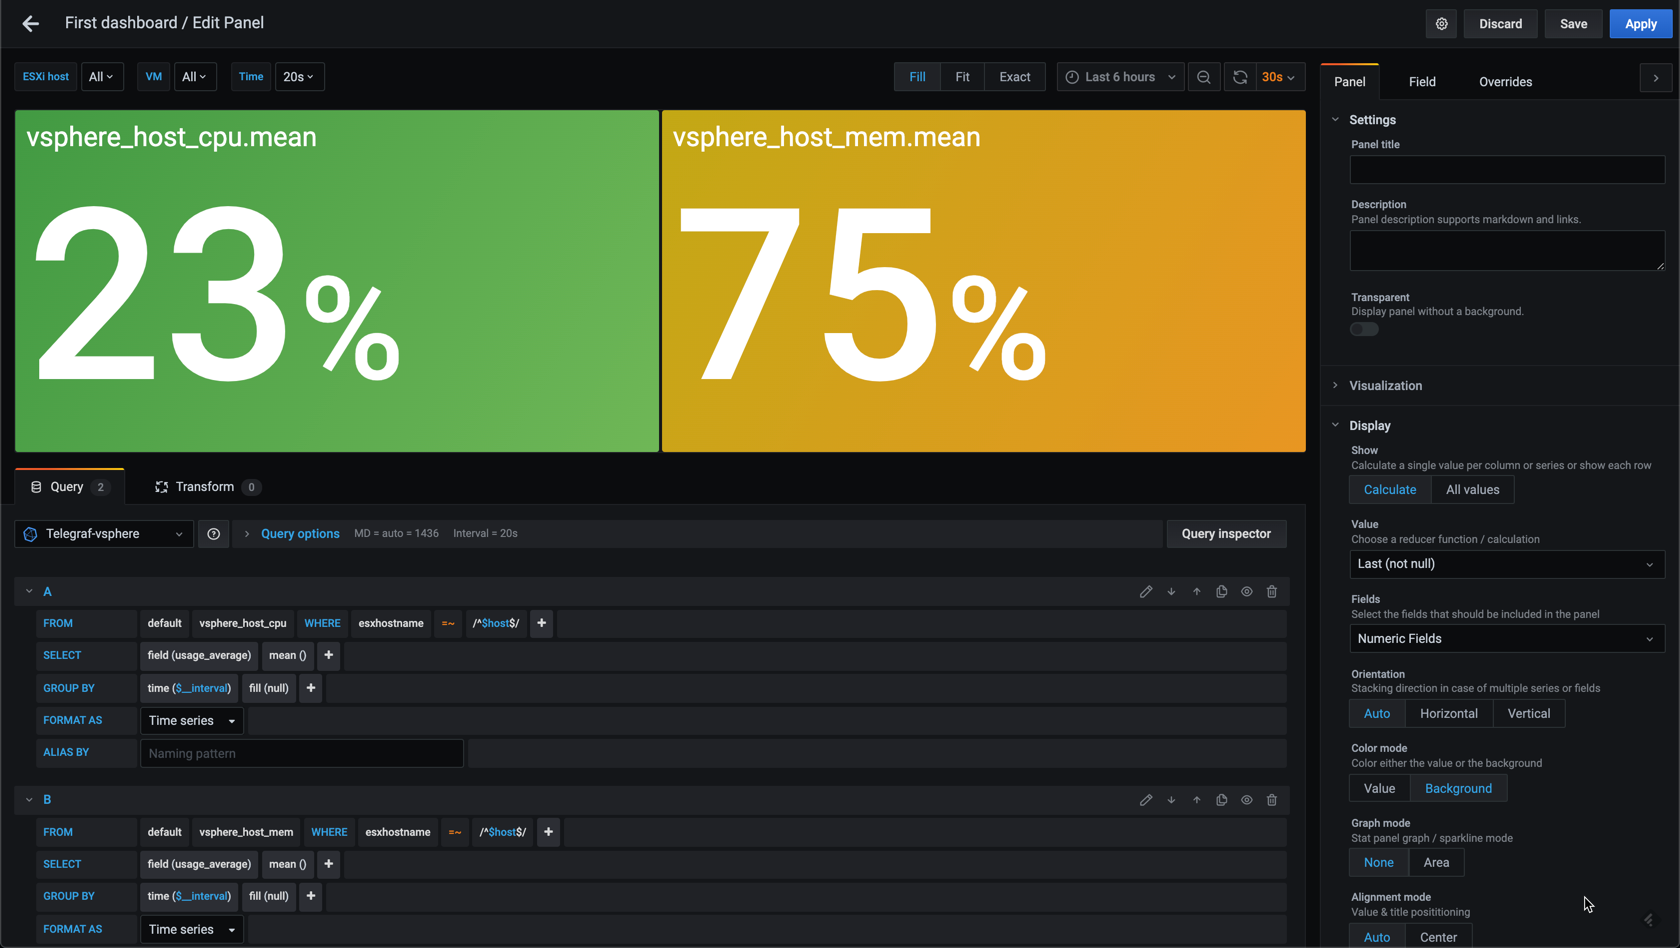
Like we did for our Graph panels let's first set the correct unit of this data to Percent. Let's also check what we can get from the Thresholds feature. In my example I'll add in a third threshold value and set it to 70
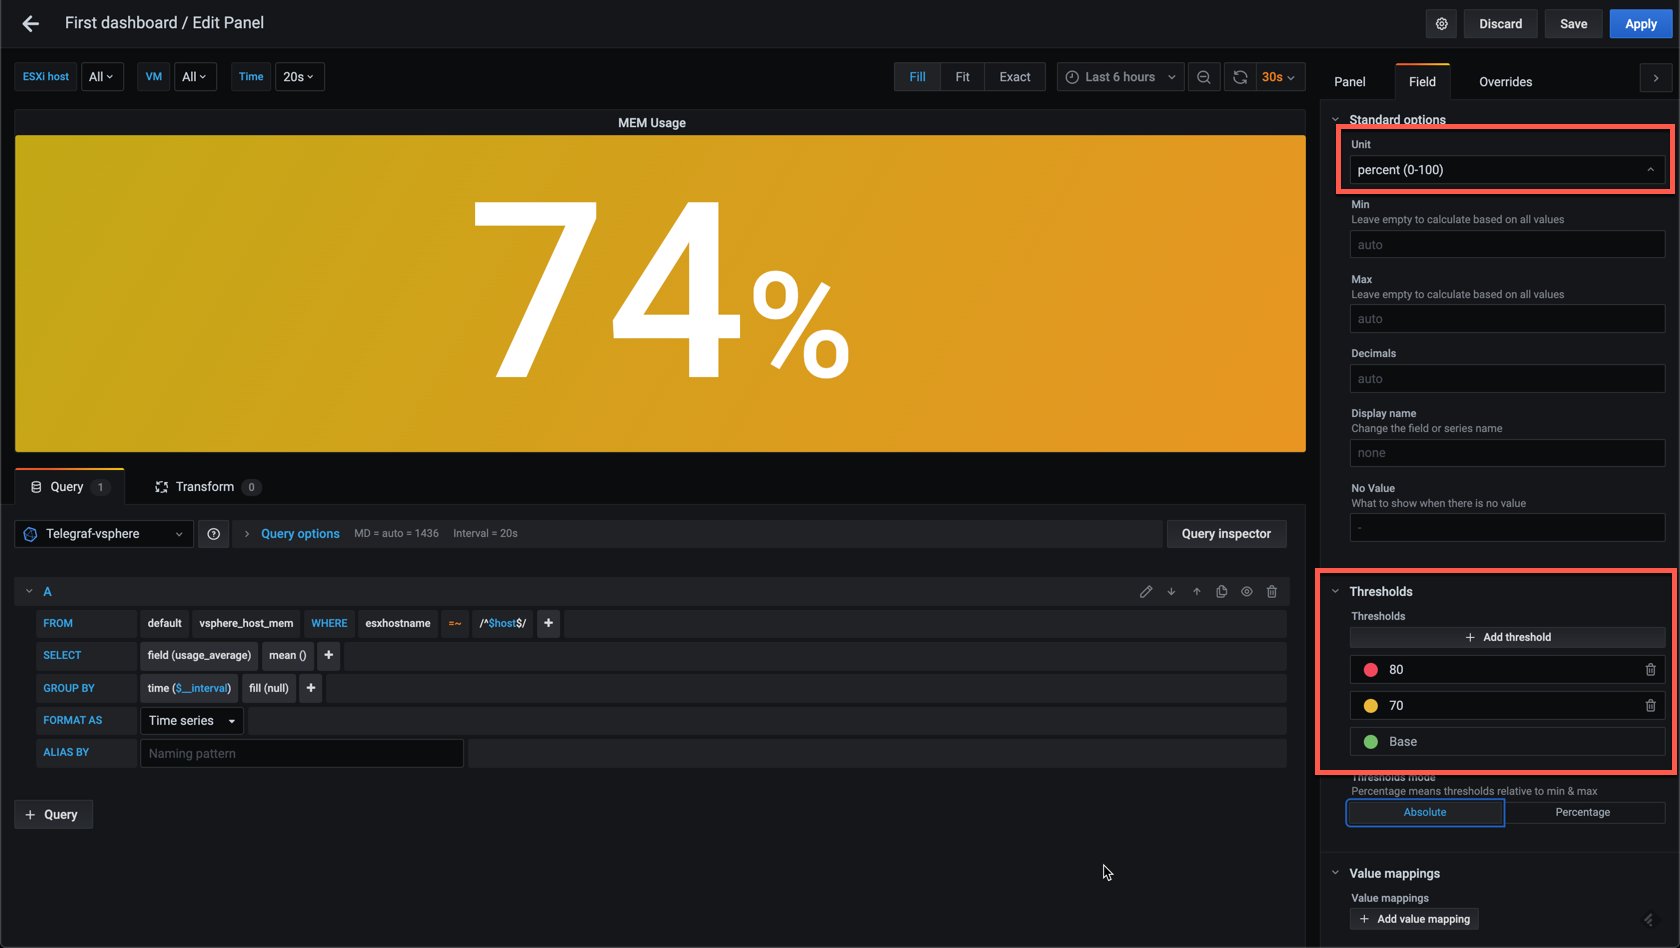
In my example this colors the MEM stat panel yellow as my current value is above the 70 threshold
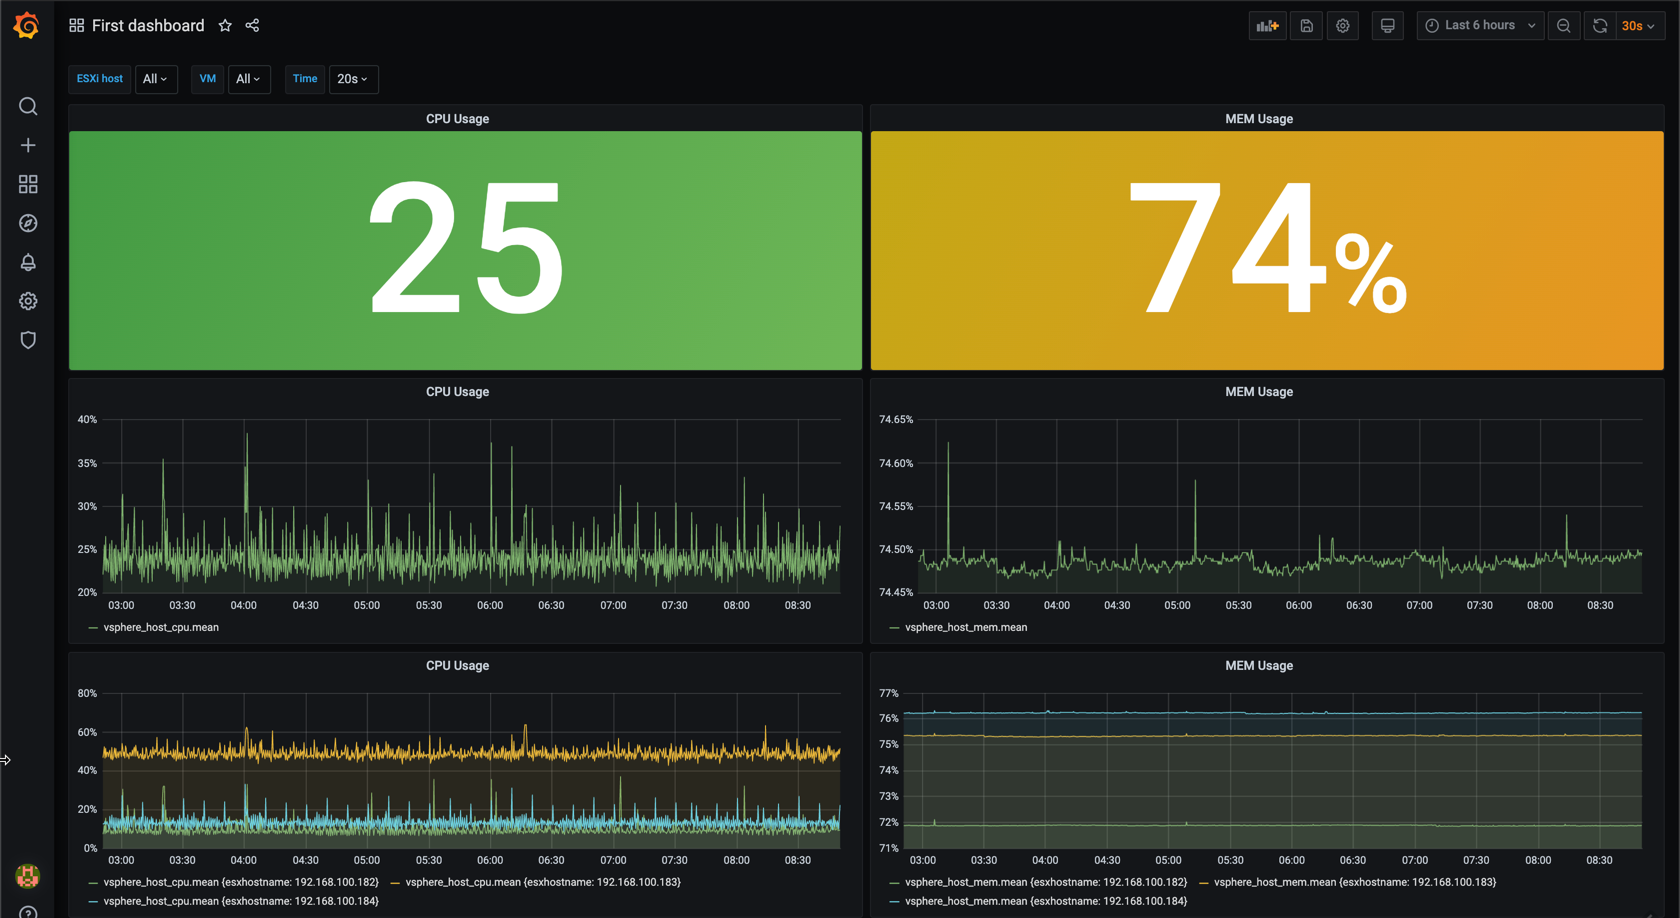
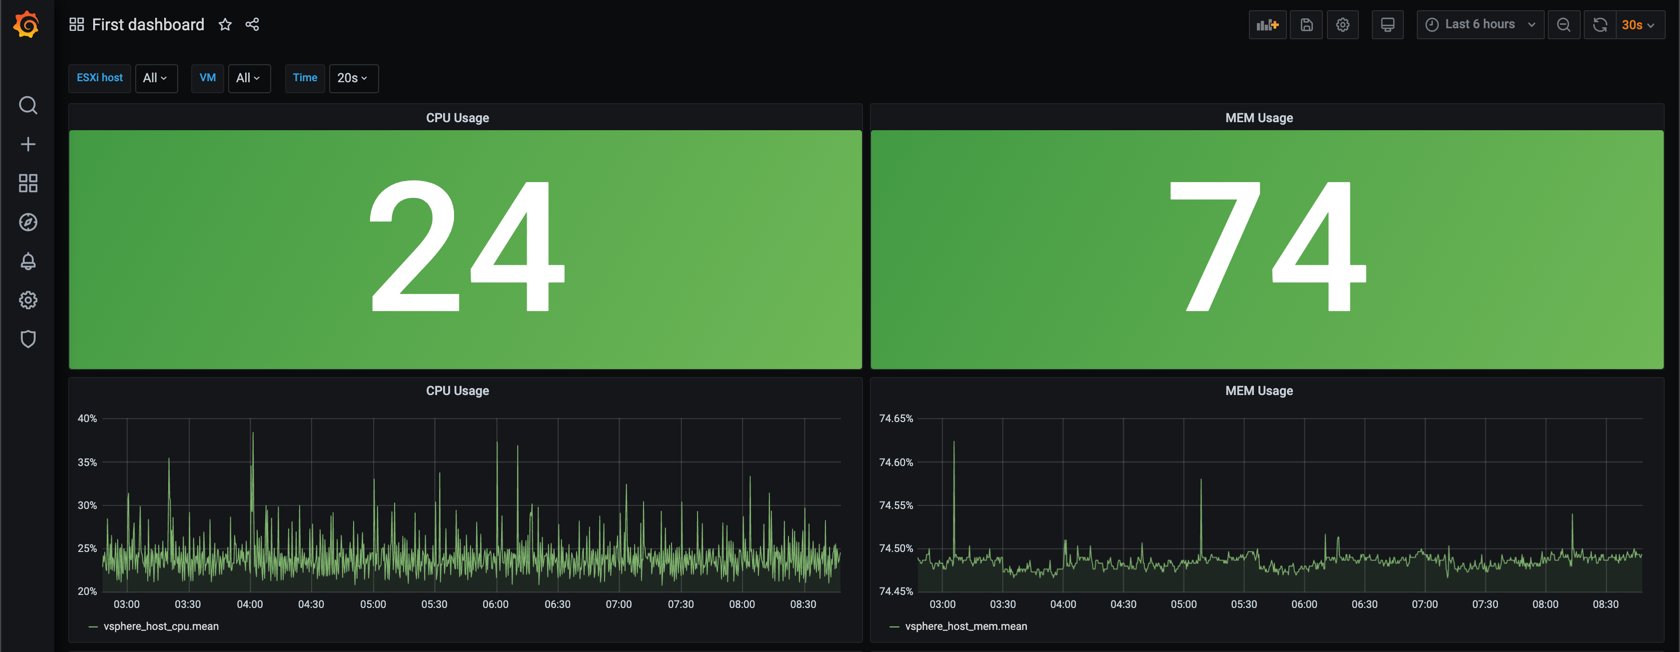
Our dashboard is coming to life with some nice coloring!
Multiple queries
Now, let's check out a few other ways we can utilize the stat panel. As with the graph panel it supports multiple queries and this is something you might want to make use of
In this example I've hit the Duplicate query icon in the Query editor to quickly copy my first query
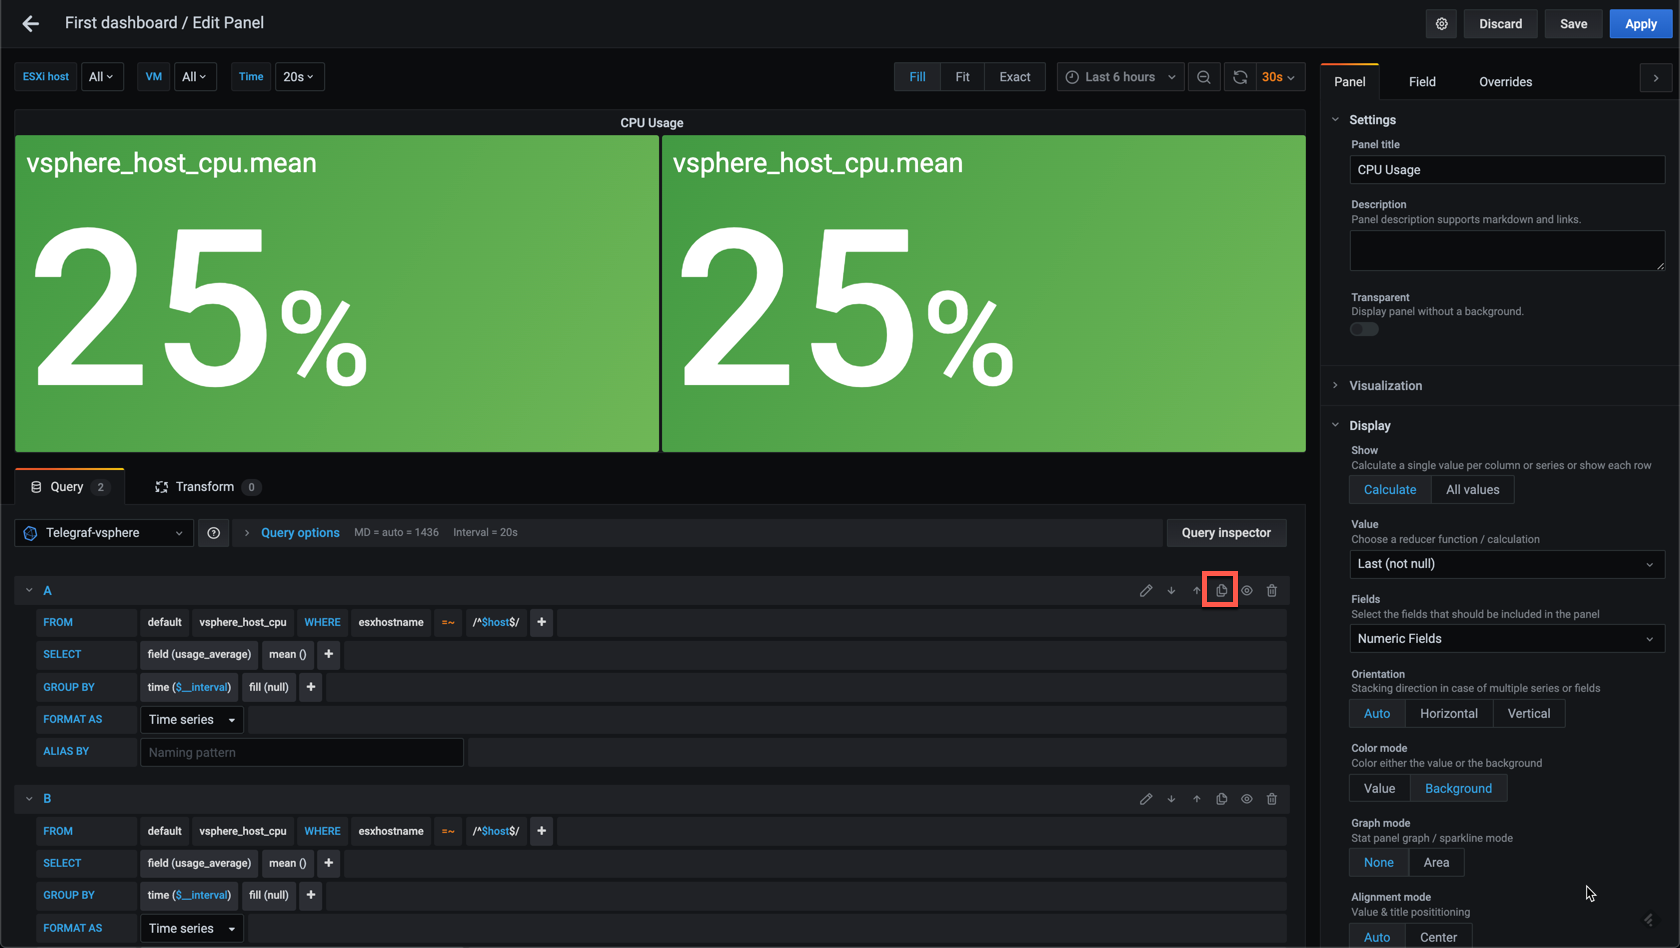
I'll adjust the second query to display Memory data, and I've also removed the Panel title. (We should do something about the value names however)
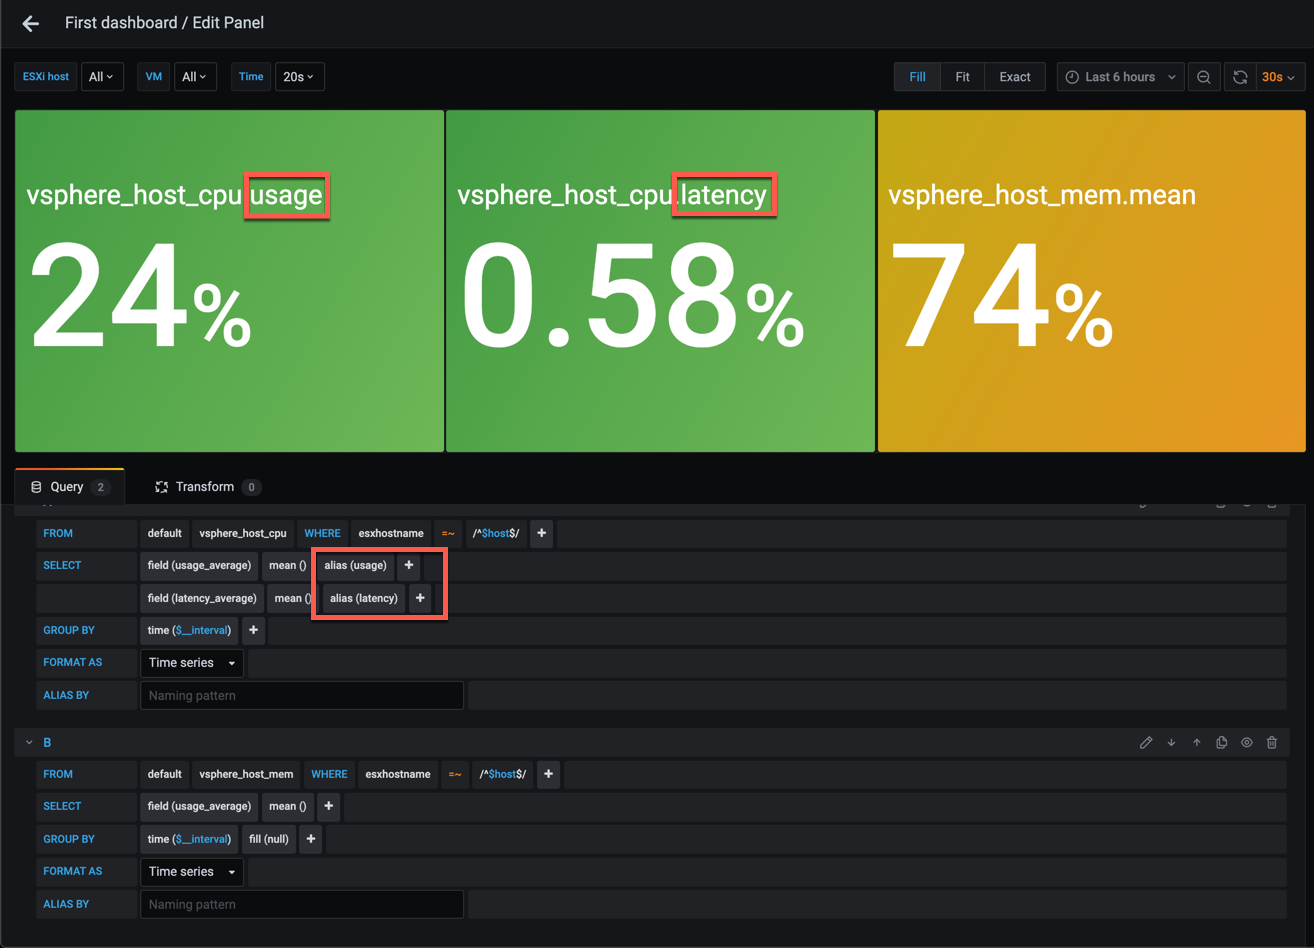
We could add more metrics to this panel, either by adding another query or if we already have the correct measurement query by adding an additional field to that query. In this example I've added the latency_average for the CPU measurement
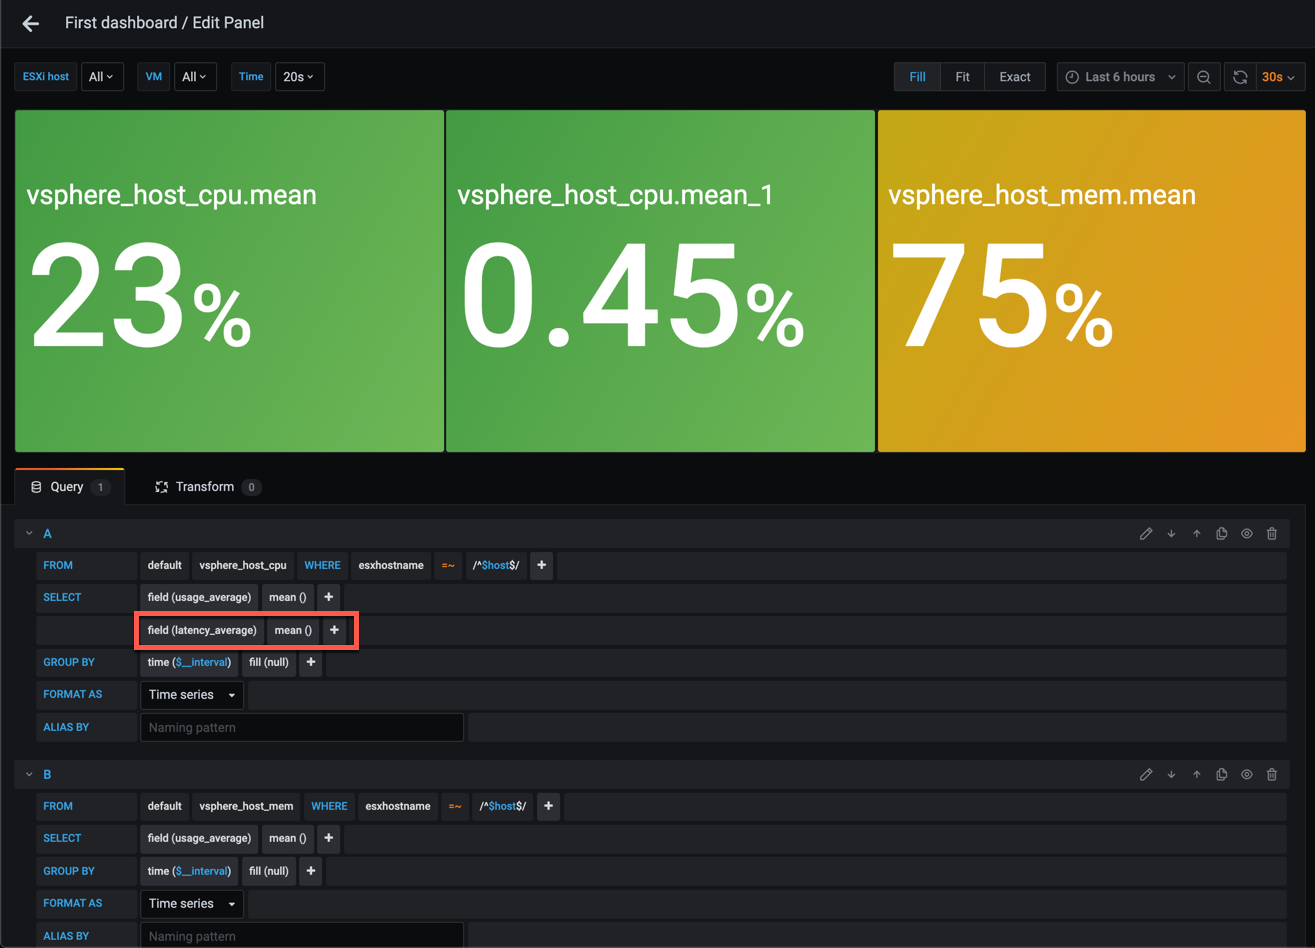
This introduces a couple of issues. First the name of the value now is misleading at best. Second we should be aware that the options set for the panel and fields are shared for all of the values. Meaning for instance that the thresholds are used for all three values. I suspect that the Latency average should have some different thresholds than the usage.
Aliasing
Let's fix the field names first. One thing to note is that Grafana will try to display the field name, but as we have used a grouping in our queries we have to have a aggregation (or selection), hence we get that mean name selected. Let's see what happens if we remove the grouping
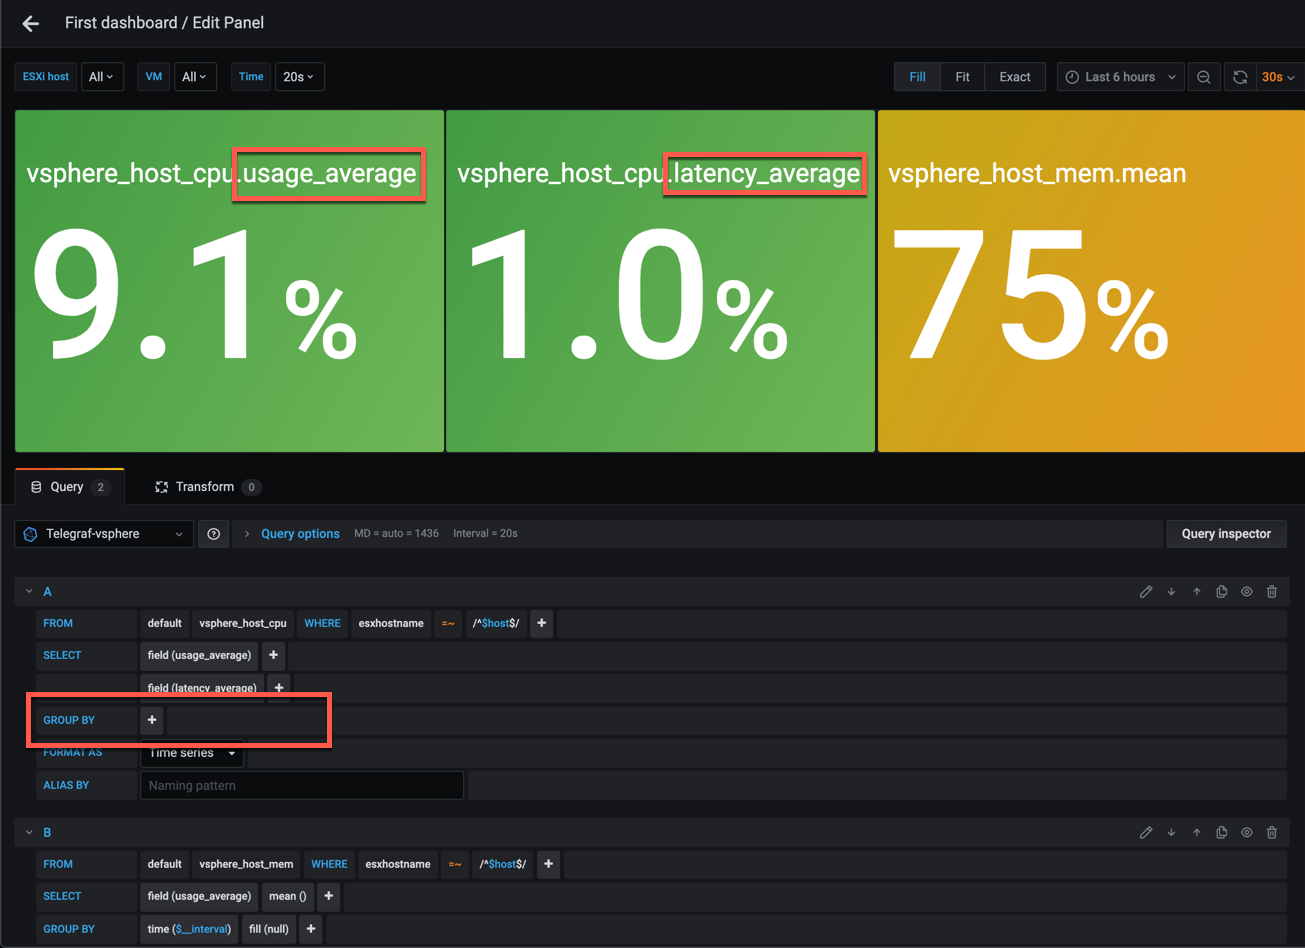
In the post where we looked at grouping we dicussed some of the issues we can run into with grouping if a query could possibly include multiple series so in many cases you need to keep the grouping.
Let's get the grouping back and check out what we can do with the alias feature of a field
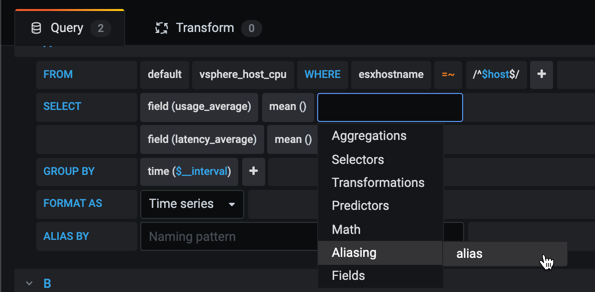
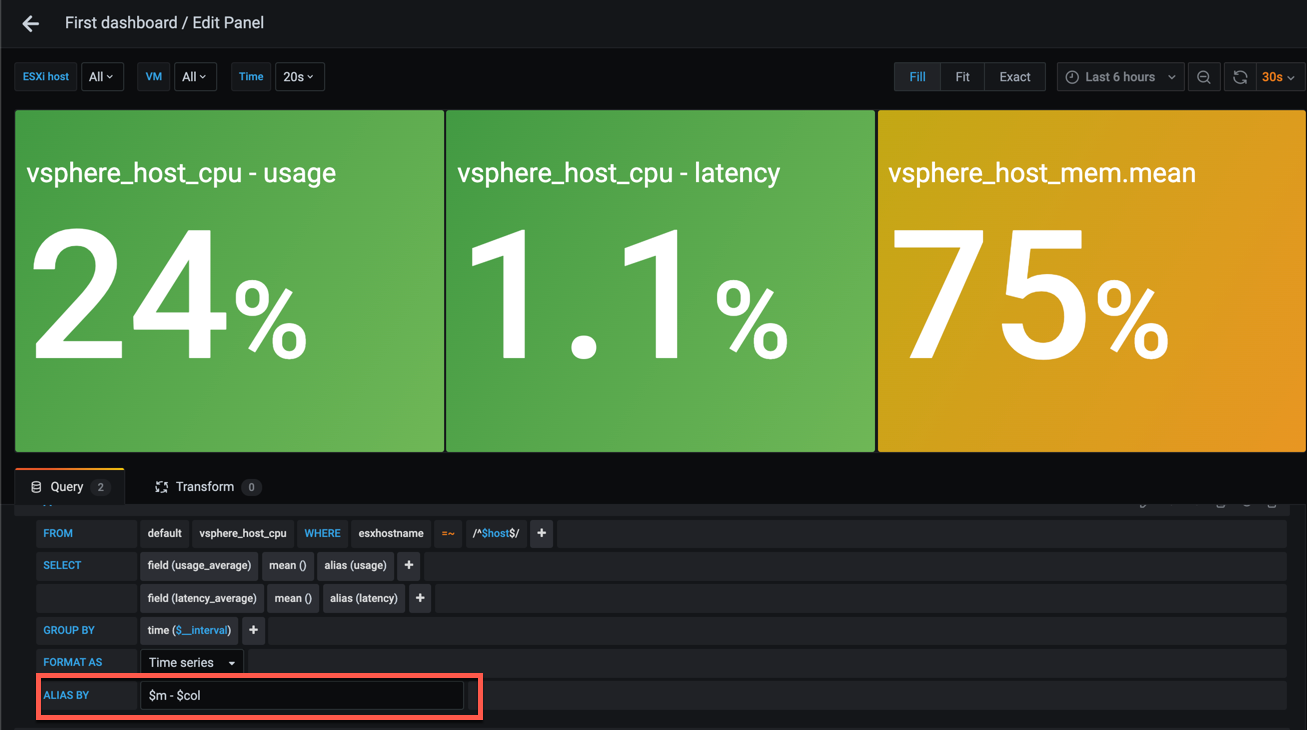
With aliased added to the fields the names makes more sense
To bring some confusion to the aliasing we also have the ability to alias the whole query. This feature have some variable patterns, like $m for the measurement and $col for the column (or field) which can be used, or you can write whatever you want (we'll see an example on that shortly)
Overrides
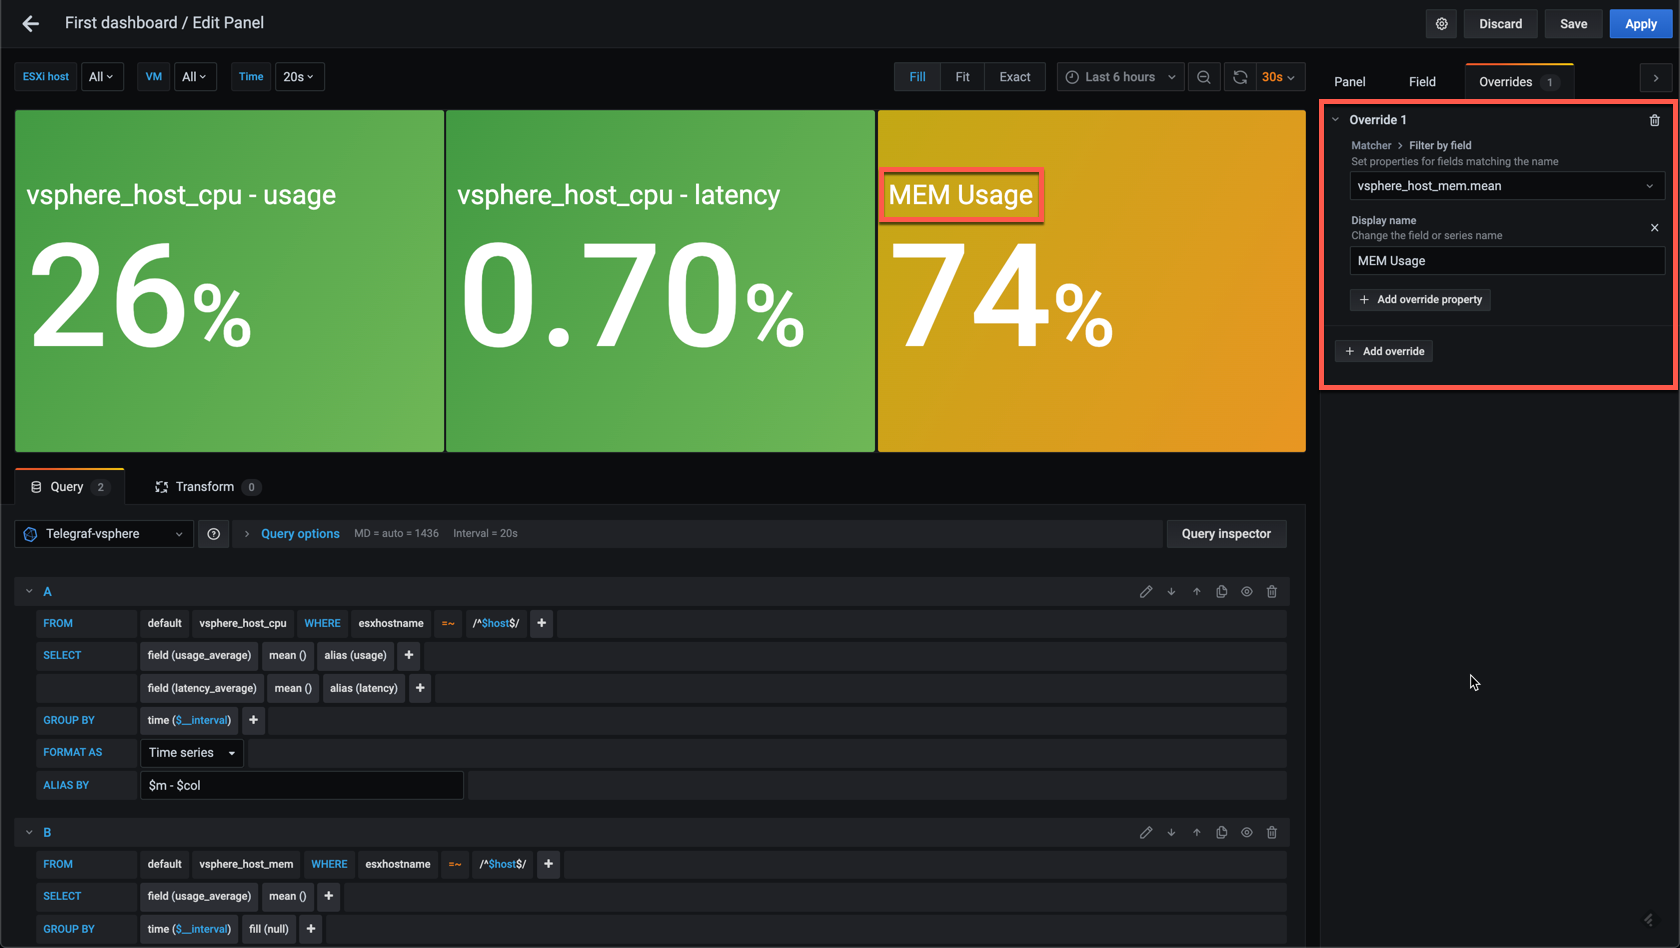
To fix the name of the Memory value we'll look at a Beta feature in the Stat panel, Overrides, which also can be used to fix the display name
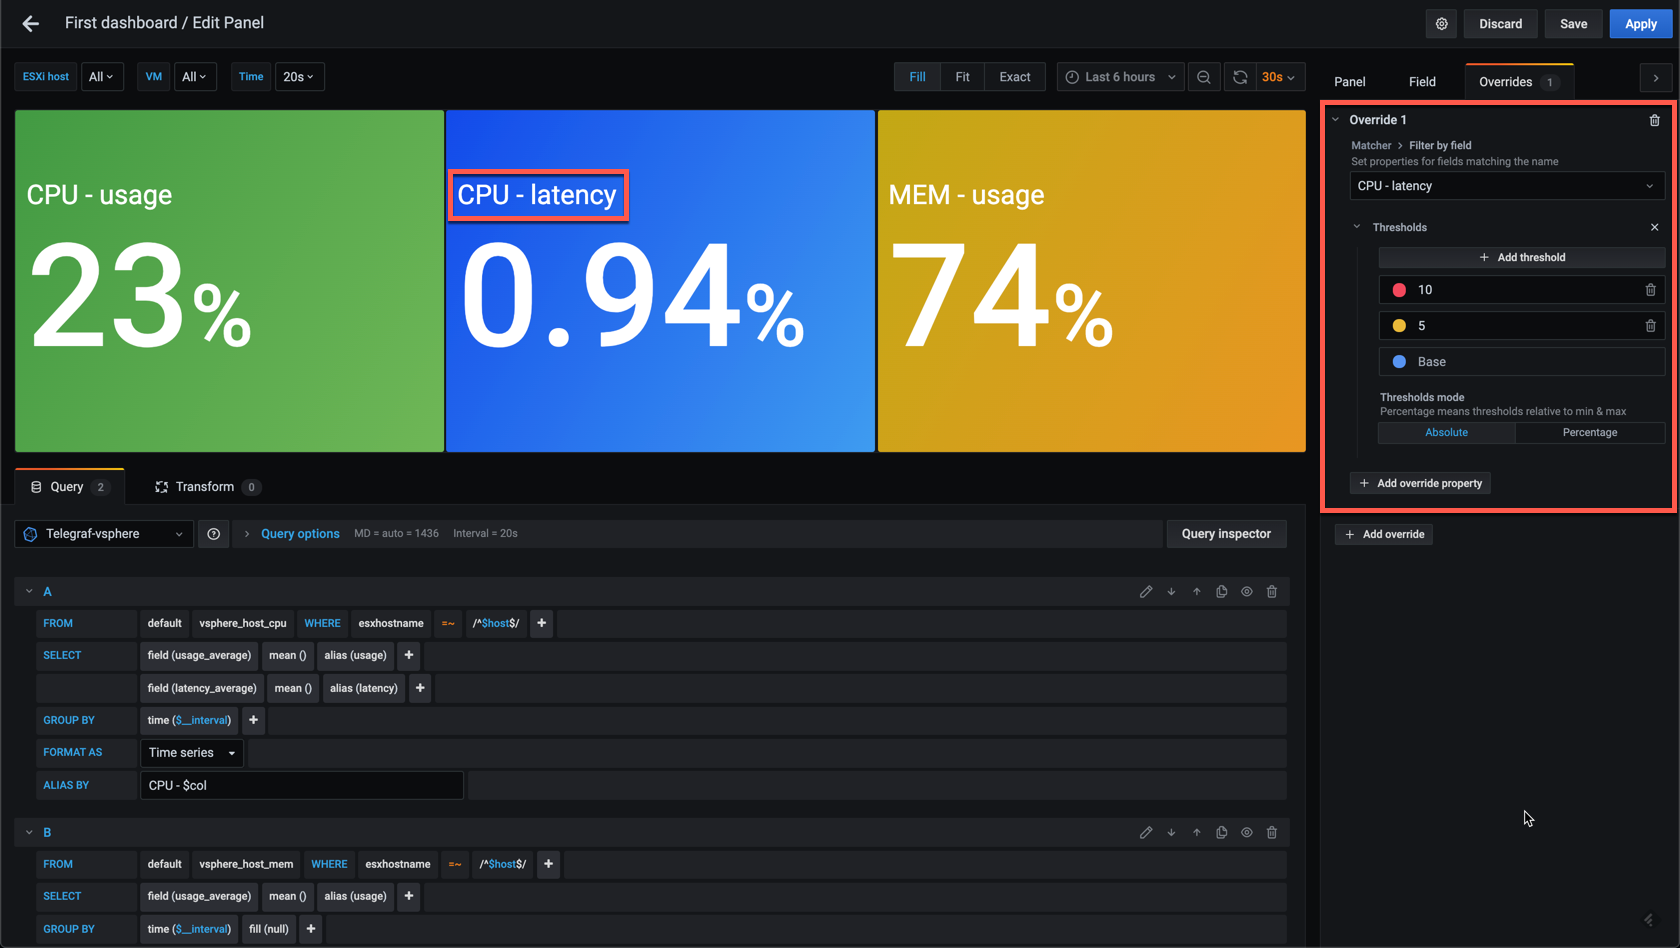
Overrides are very powerful, but the naming is maybe something that's better handled by the alias feature of the query. Let's put that back and check out another way of using overrides, to fix the thresholds for the latency value
I'll change the threshold values for the Latency metric to 5 and 10, and I'll also change the Base ("green") color to blue so we can see that it actually works. Note that I've changed the Alias By to prefix CPU and MEM instead of using the measurement name.
Let's go back to our dashboard and see how things look (Note that I've changed the blue color back to green for the latency base)
As we can see this is two different ways of using the Stat panel. You can have single queries, or you can have multiple. There's endless possibilities here, especially if you master the overrides available. So why won't you just put all of your queries in a single stat panel?
A single stat panel for all your queries?
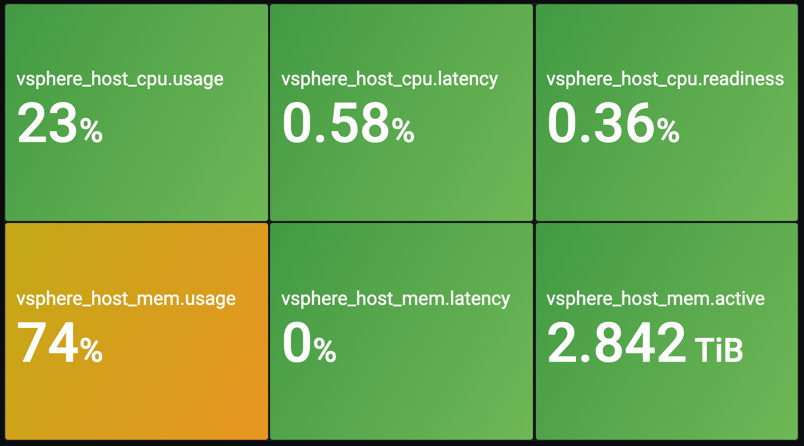
Well you could. I.e. for CPU and Memory I would have two stat panels. I could combine them, like this next example
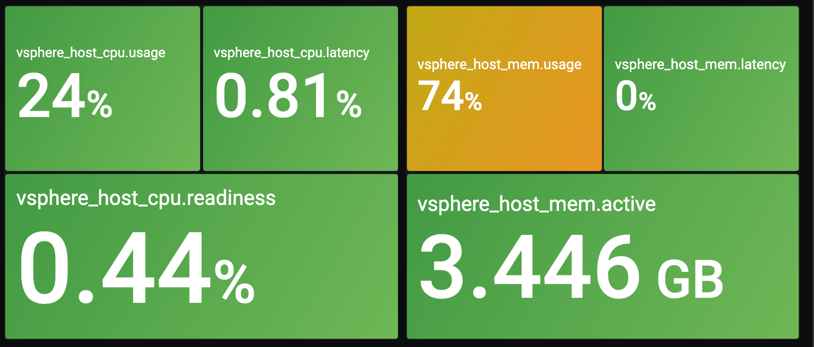
Or I could split it in two different panels which, depending on the whole dashboard layout, might suit you better
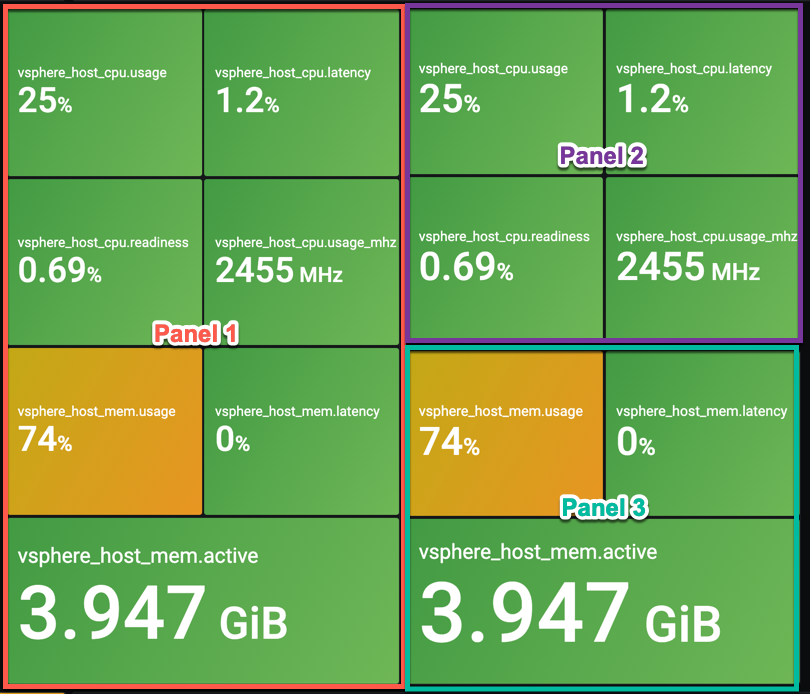
Grafana does a great job of fixing the layout for you if you're adding all in one, so make sure you experiment and select the right method for your use case. The following screenshot shows two ways of showing the same panels, one with all queries in a single panel (Panel 1), and one where we've split in two panels (Panels 2 & 3)
Summary
This post has been all about the Grafana Stat panel that was officially released in version 7. Just before publishing of this post Grafana 7.1 was released with some exiting new features built in to the stat panel. I haven't been able to play around with it so I might revert back and do a follow up on that later on.
The stat panel has a lot more to it, so be sure to experiment on your own to get the perfect fit for your usecases.
In the next post in this series we'll take a quick look at a few of the other available panels. Stay tuned!
Thanks for reading, and as always, feel free to reach out if you have any questions or comments