vSphere Performance - Telegraf, InfluxDB and Grafana 7 - Dashboard Variables
Overview
Intro
This is the fifth part of a blog series about Telegraf, InfluxDB and Grafana where we use vSphere performance data as our metric data.
These posts build on each other, but you should hopefully be able to use them as reference if you're just jumping in to a specific post.
In the last post we discussed the Grouping and Filtering feature in Grafana. Now let's check out variables which we can use to filter our panels based on the selected value(s) which lets us create dynamic dashboards
Variables
Filtering becomes much more interesting when we add in variables to a dashboard. Let's use an example where we take a look at VM metrics and filter this on the hosts the VMs are running on.
Create new variable
For this we first add a variable for hosts. To do this we click the settings icon at the top right of the dashboard
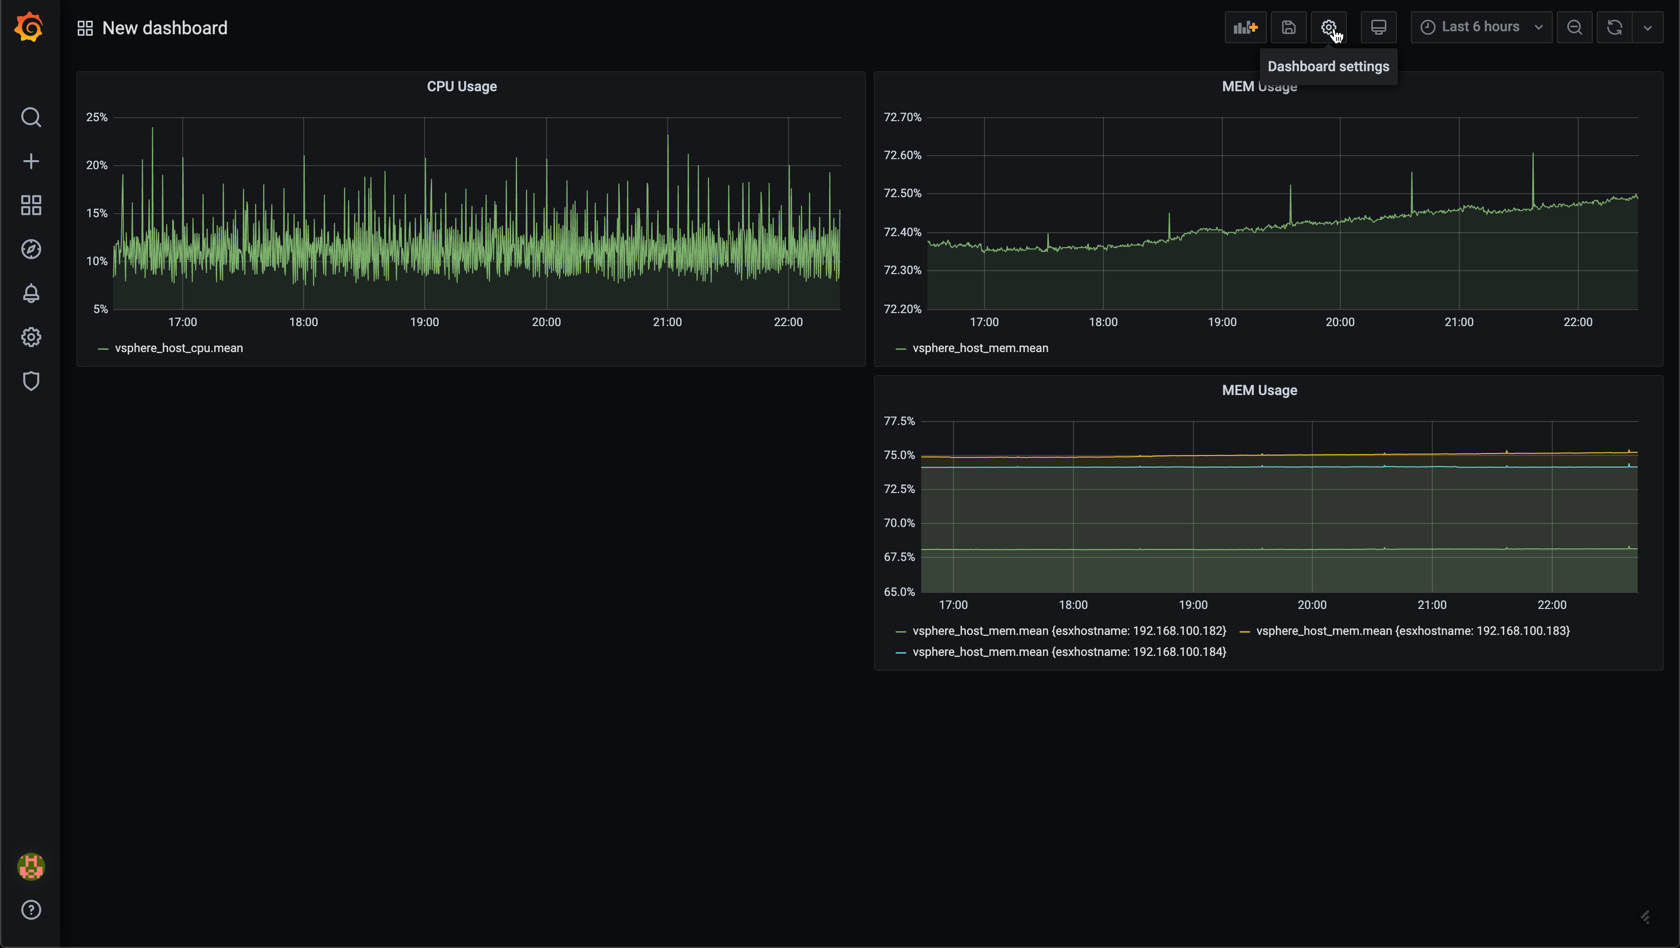
Now click Variables on the left, followed by Add variable. This will take us to the New variable page
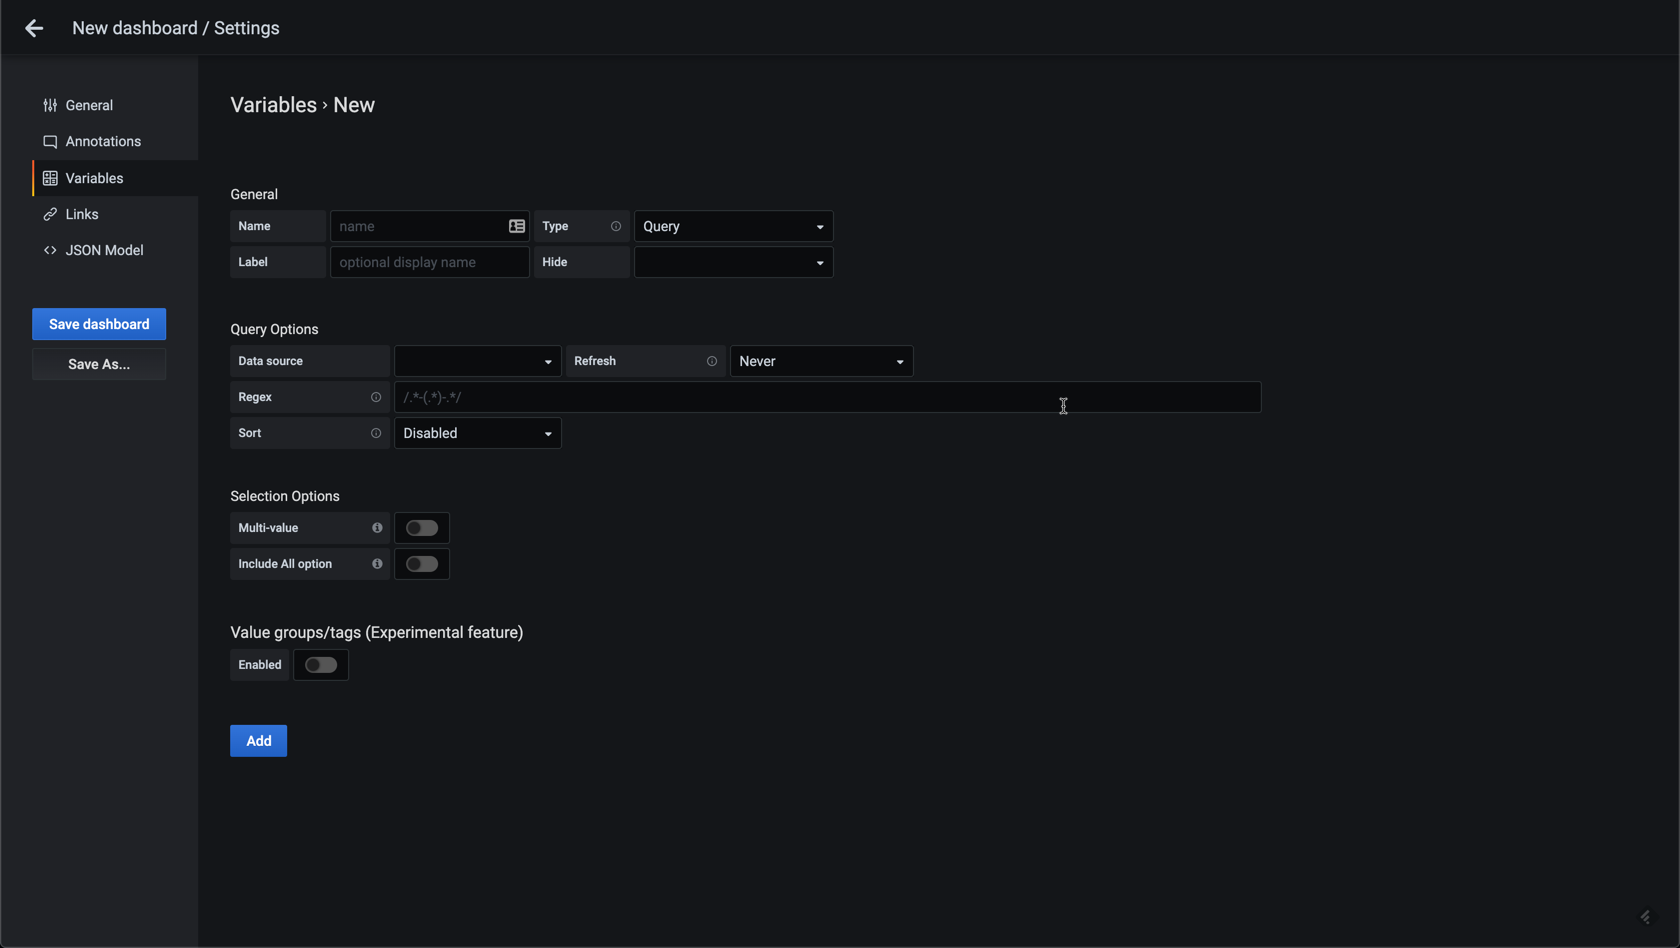
Variable options
First we give the variable a name (host), and optionally a label (ESXi host). Select the datasource (Telegraf-vsphere) and what refresh interval it will use. Normally you'll select either On Dashboard Load or On Time Range Change. The latter will update more frequent.
In the query field you'll add the query that selects the options for our variable. For Influx we use tags, and as we want to list the hosts we write a query for displaying the tag values for esxhostname.
Note that there's something to be aware of when it comes to how tags are handled by the InfluxDB database and how this can affect the tags returned by this query. We'll discuss this towards the end of this post
If you're not using InfluxDB please note that the variable queries is specific for the different data sources so be sure to check the Grafana documentation for the correct syntax.
Note that if the query returns values it will display a preview of them so you'll know if your query is good.
Depending on the type of variable and the panels/dashboard you might want to select the option for Multi-value and/or the All option
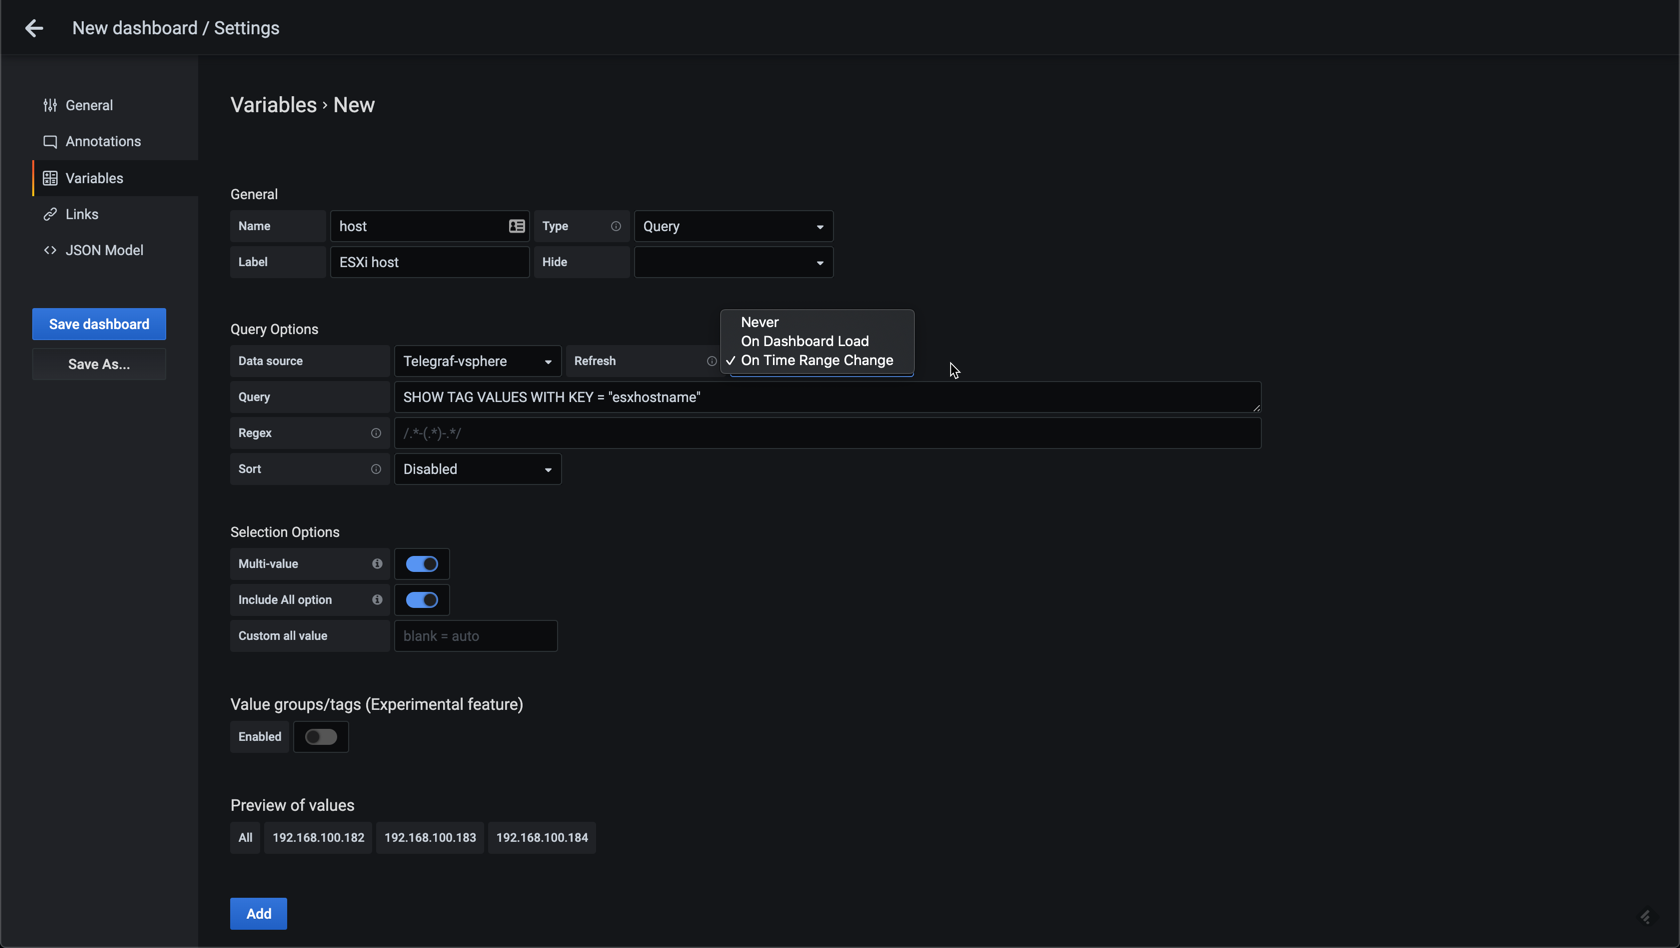
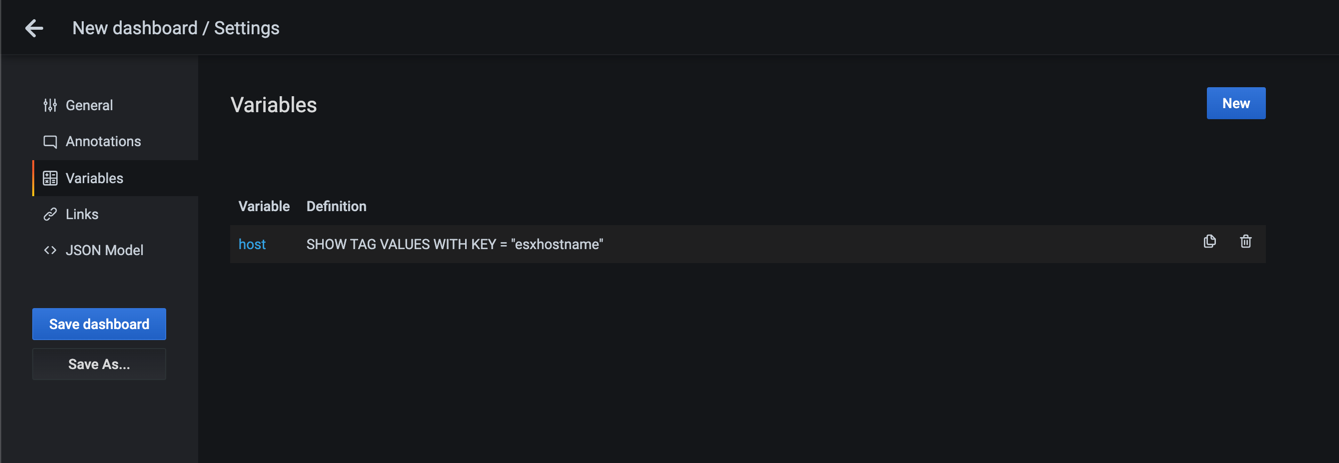
Be sure to click Add (or Update) when you're happy with the query and options. You should now get a list of the variables configured
Use the variable in queries
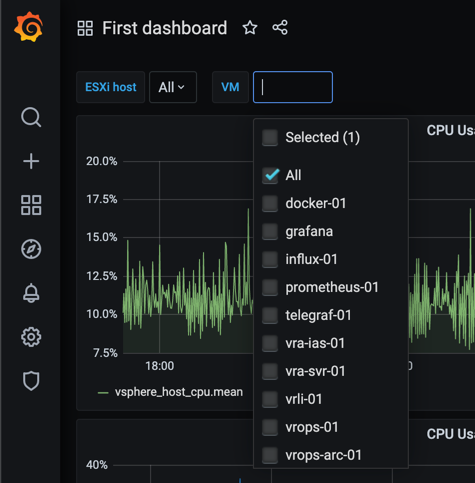
Back in the dashboard we'll now have a variable dropdown present with our hosts. The next step is to make use of this in our panels.
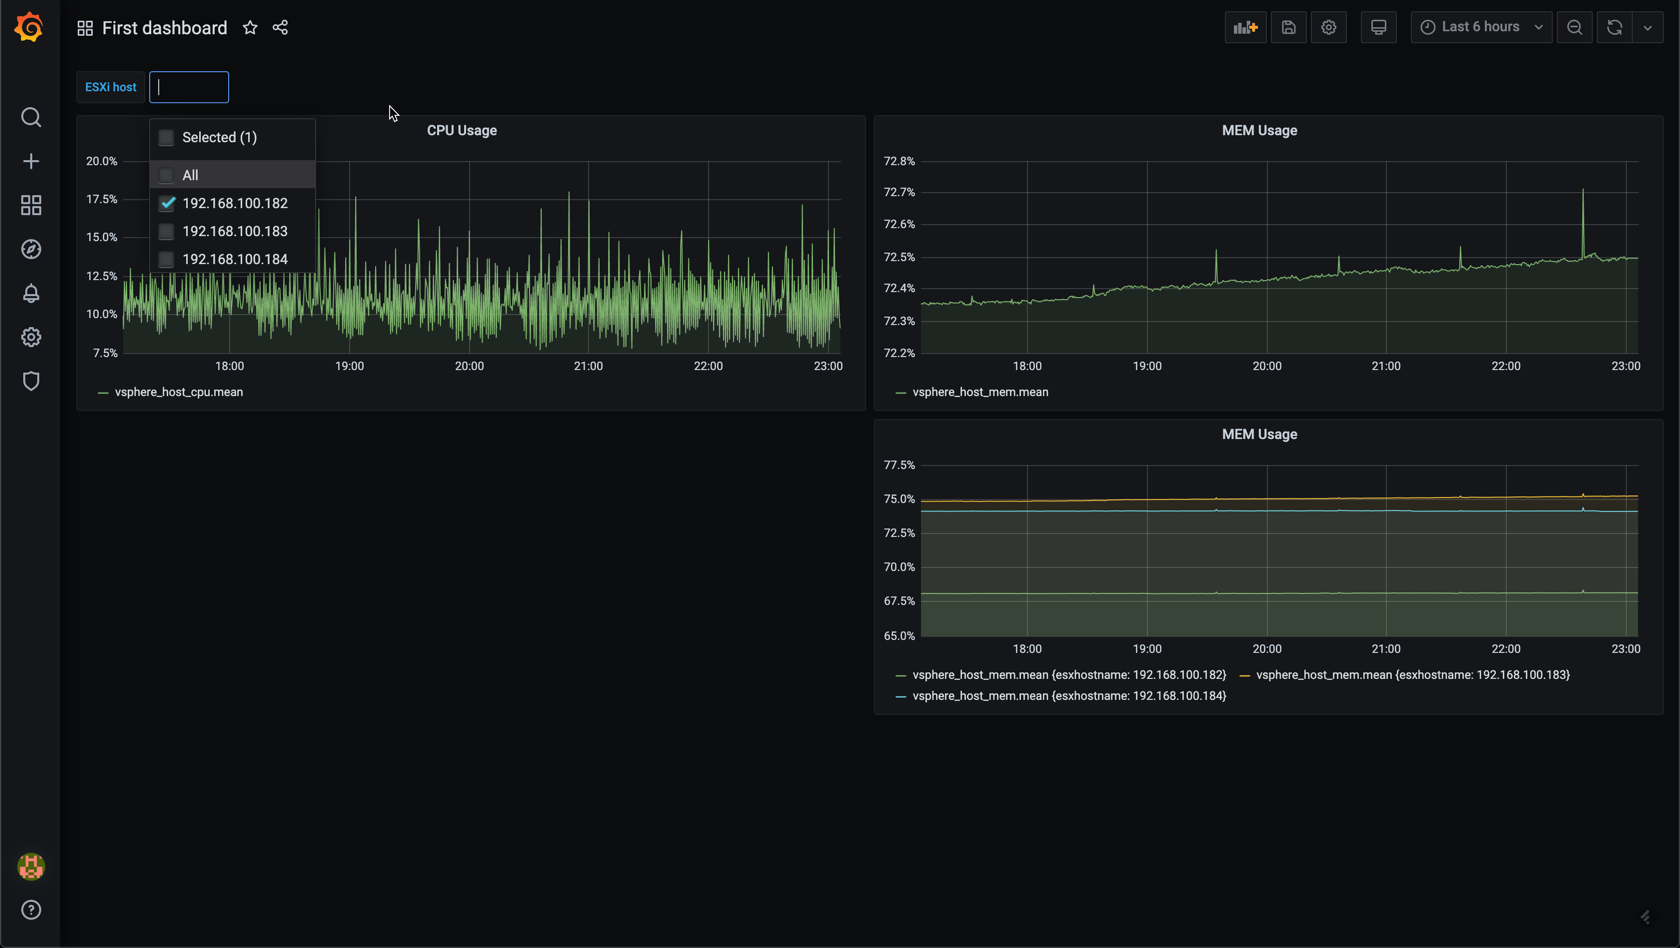
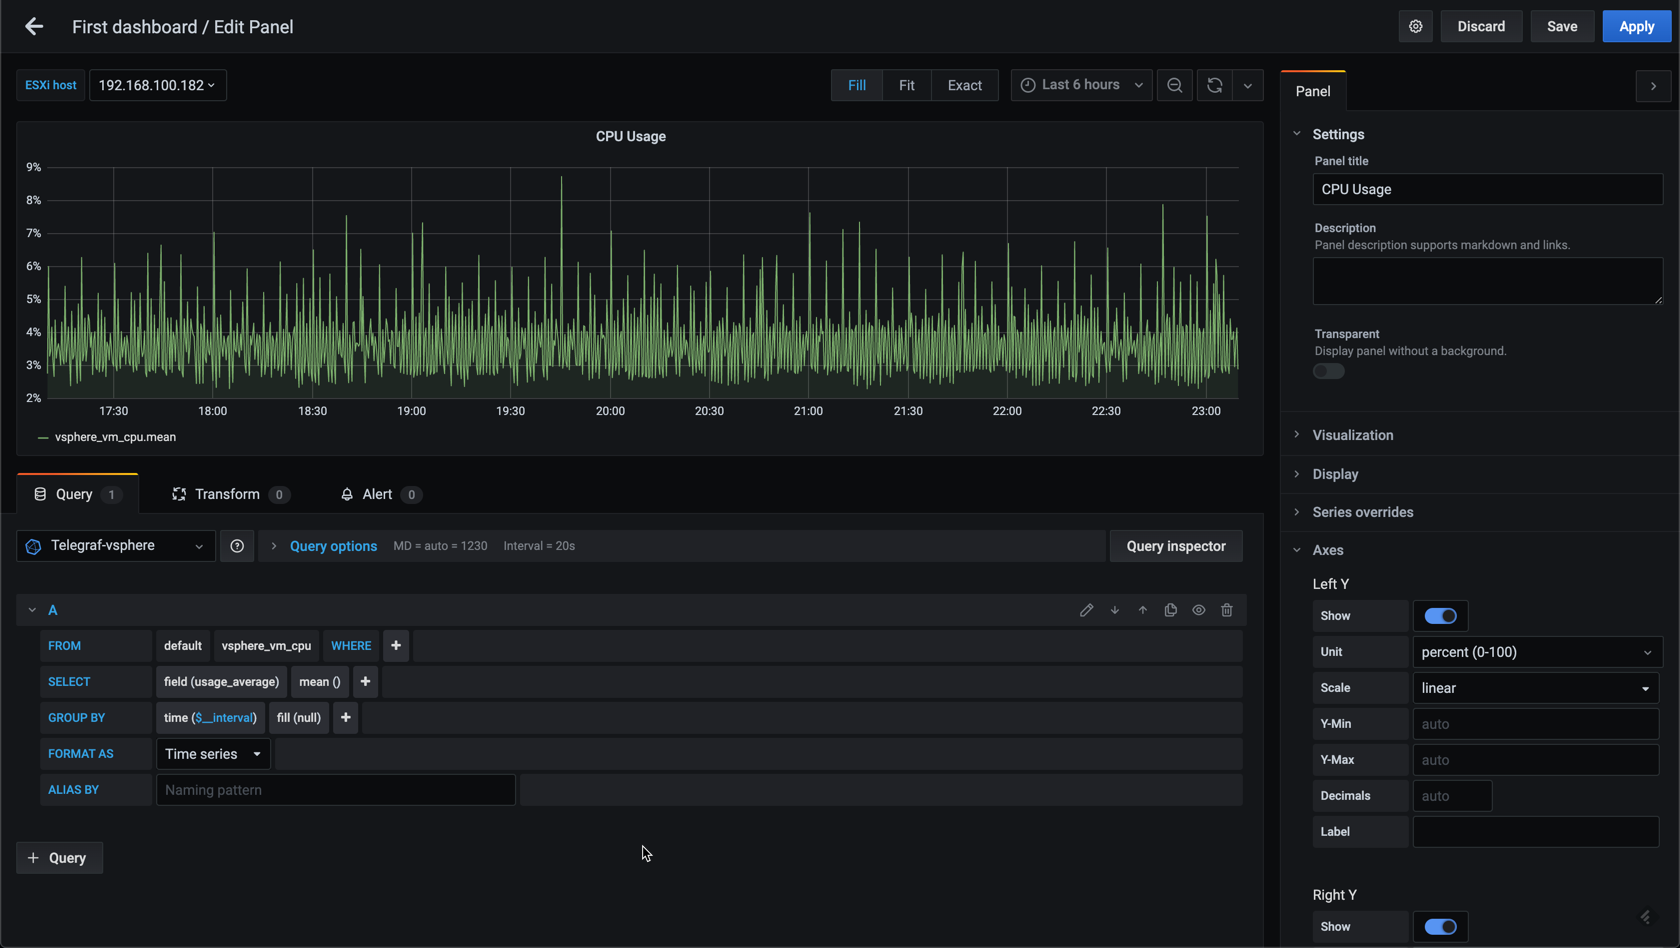
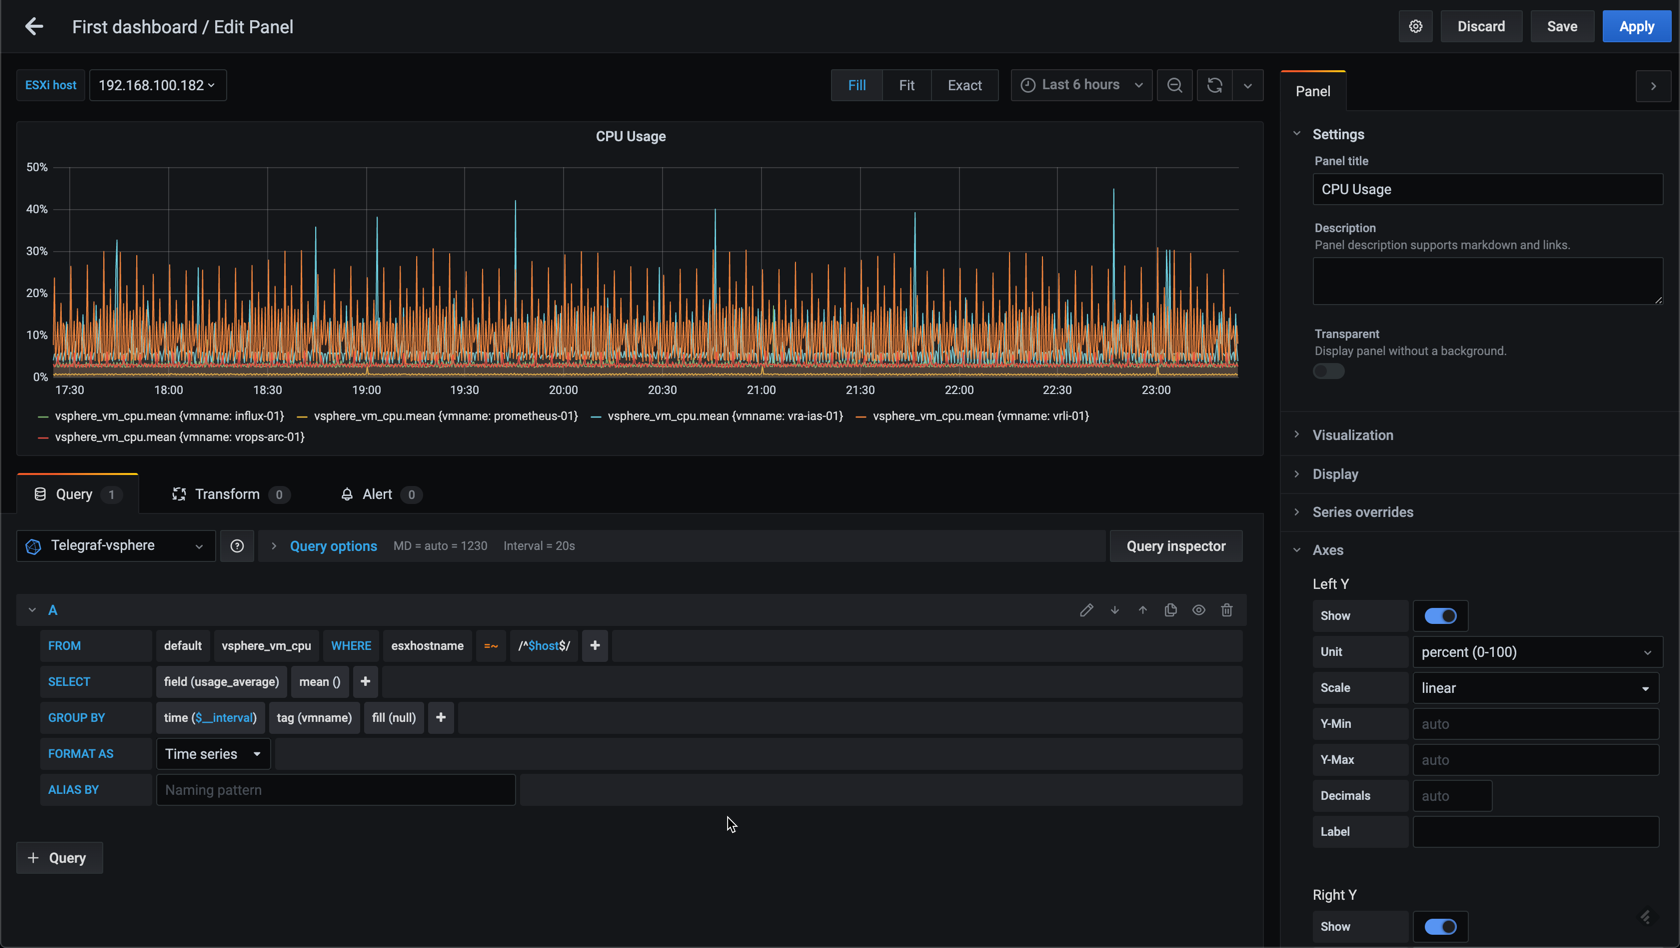
Let's first add a panel with CPU usage for VMs with no grouping or filtering. This will display the average CPU usage for all VMs.
Note that this might be slow to load if you have a large environment, especially if you haven't changed the default dashboard time range which is set to 6 hours by default.
Let's add a filter which uses our new variable to filter on the selected host(s). We'll select esxhostname as our where filter and notice that in the tag value dropdown we get access to our variable in addition to the list of hosts
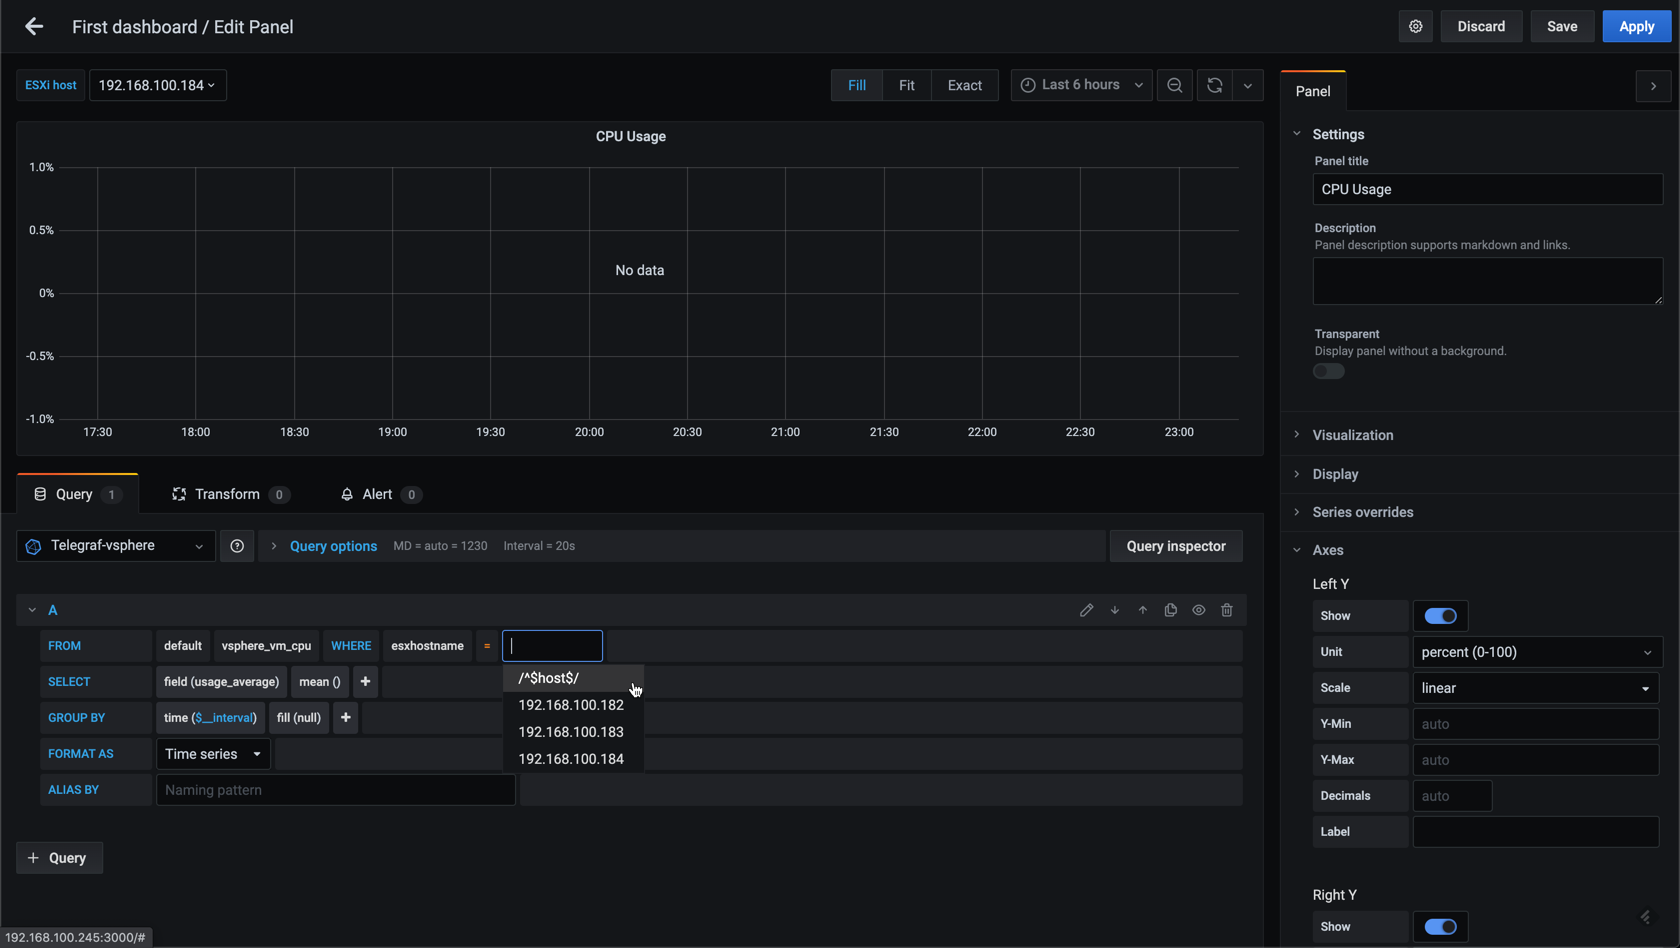
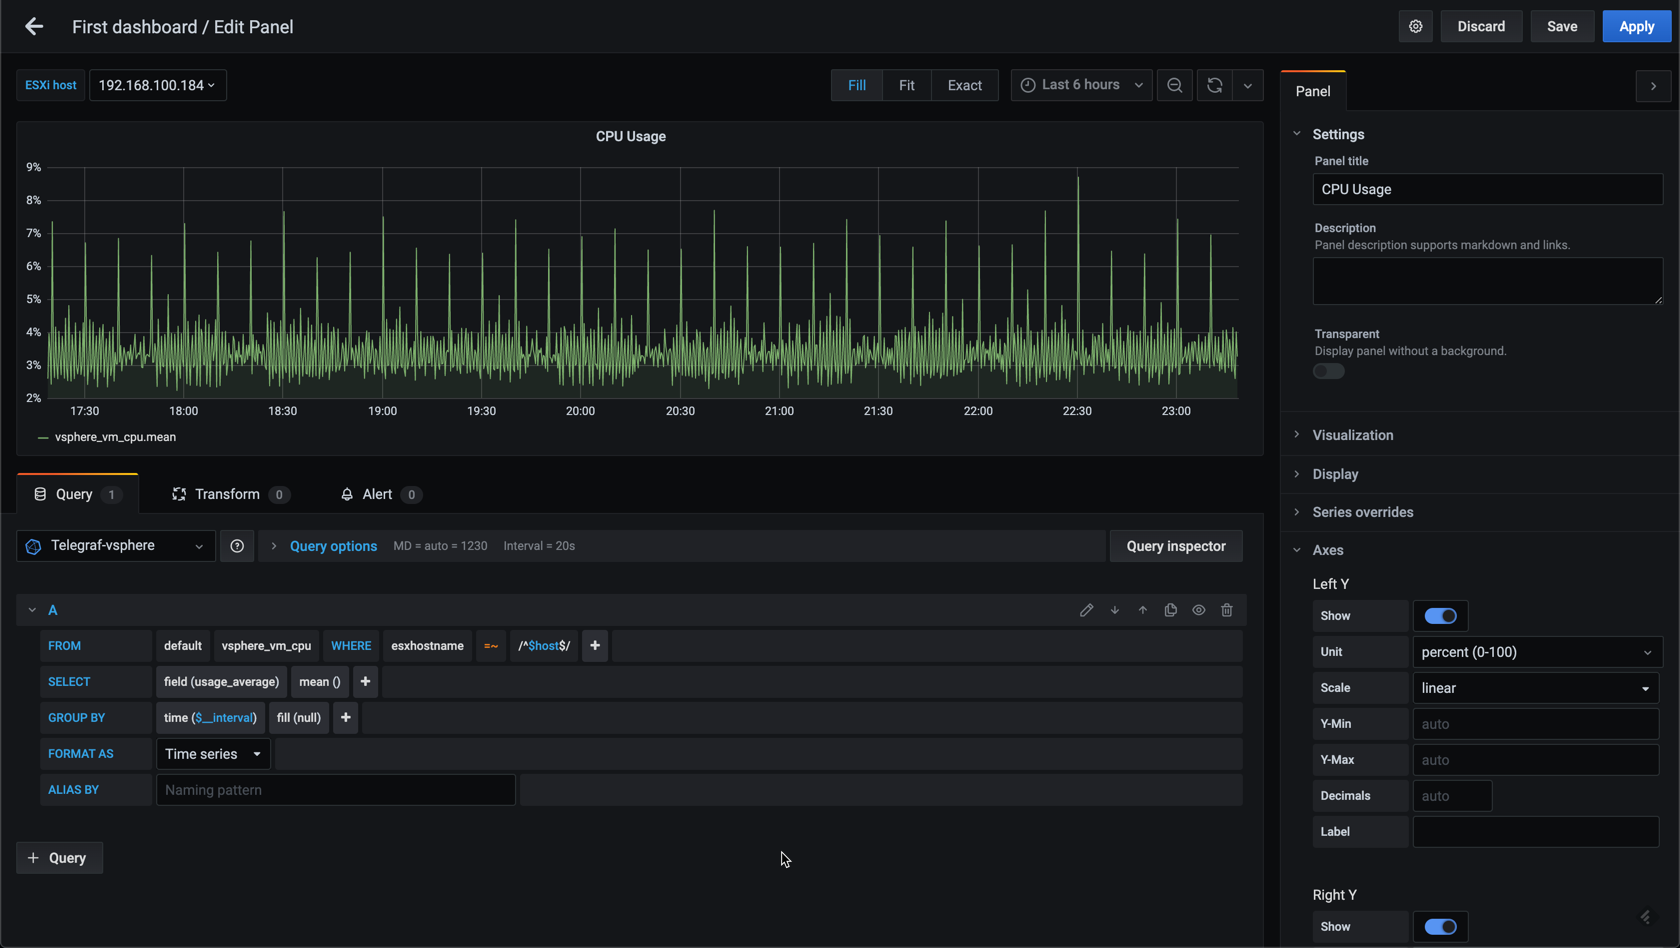
Now select /^$host$/ in the host list, and based on what's selected in the ESXi host variable the graph should update with data for that specific host.
Let's add grouping to the query so we get a graph per VM on the selected host, so we can change the selected host in our variable dropdown to see that the VMs in the graph change.
Please be aware if you have a lot of VMs in your environment and select All hosts then you'll get a line per VM in the graph. This might put a significant load on your browser, especially if you haven't changed the time range for the dashboard (which is 6 hours by default)
Nested variables
Another neat feature when it comes to variables is that they can be nested in a way so that a variable is filtered on a different variable.
Let's create a new variable, VM, which will be filtered on the selected ESXi host.
For this we add a where clause to the variable query. Note that you can use the regex syntax with the tilde (~) character after the equal sign and specify the variable that you want to filter on, e.g. where "esxhostname" =~ /$host/. As you probably have noticed, the tag name to filter on (esxhostname) comes from InfluxDB, while the value to filter on is your preconfigured variable ($host). Also be aware that the quotation on the tag name is important so if you're not getting your query to work try to change from single to double quotes or vice versa.
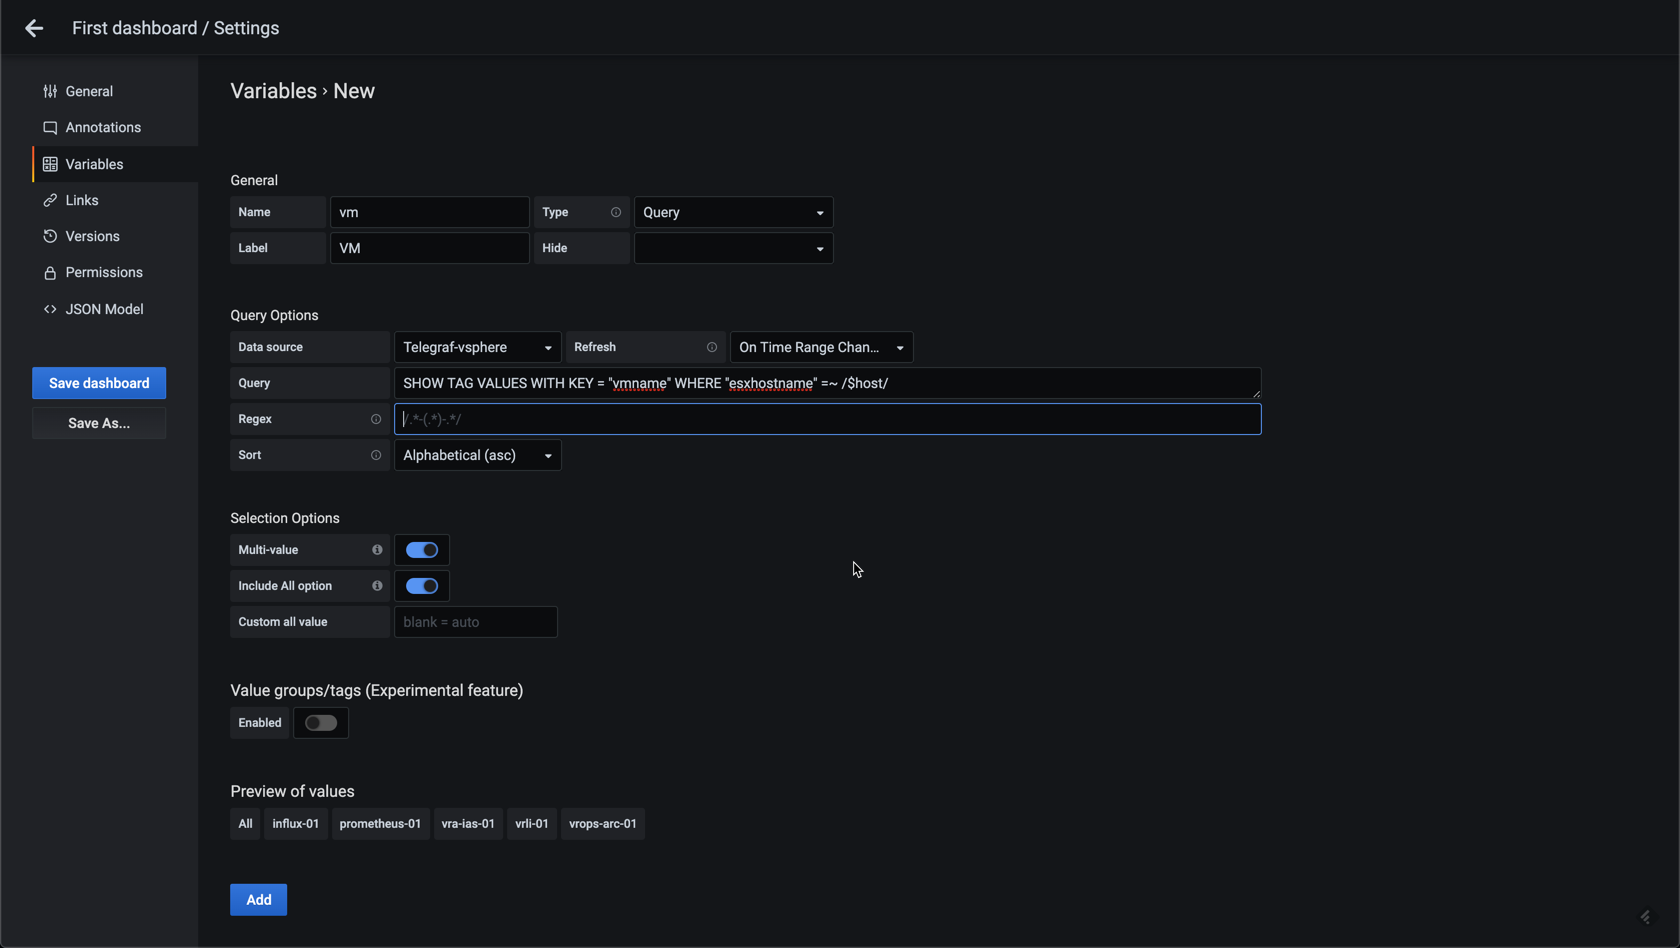
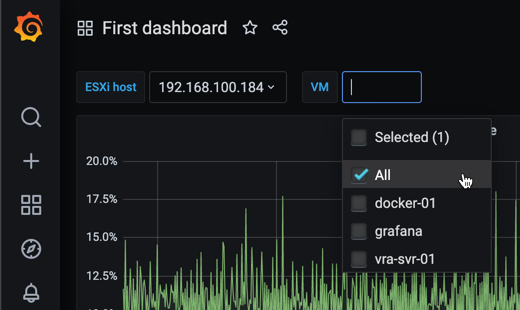
After adding this variable we can see we have two variables in the dashboard, and you should see the list of VMs change based on the selected host.
Time variables
In the last post we dicussed Time intervals for panels. I mentioned that you could create a variable for the Time interval so that the user can control the interval herself. Let's see how this can be done.
In the Add variables screen you set the type to interval. You can name the variable whatever you want. Notice that Grafana suggest some values by default.
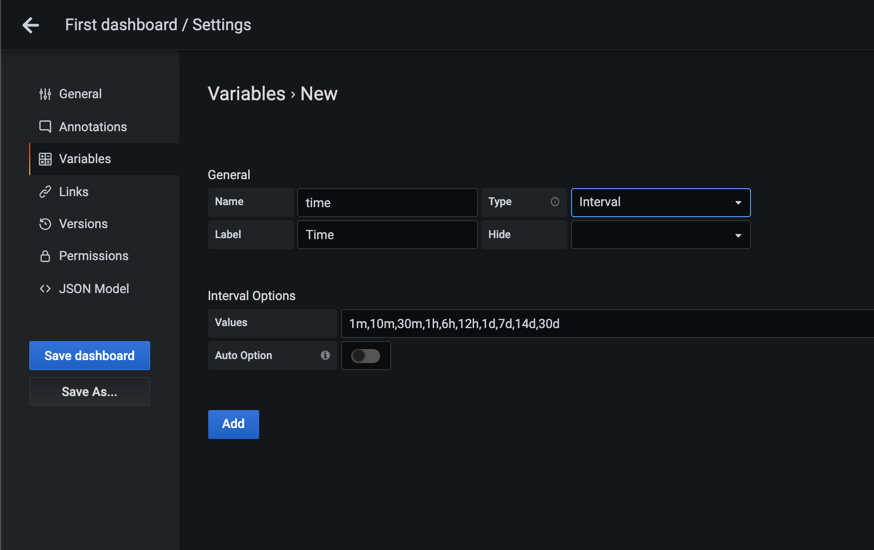
To make it fit our data I'll adjust the available intervals
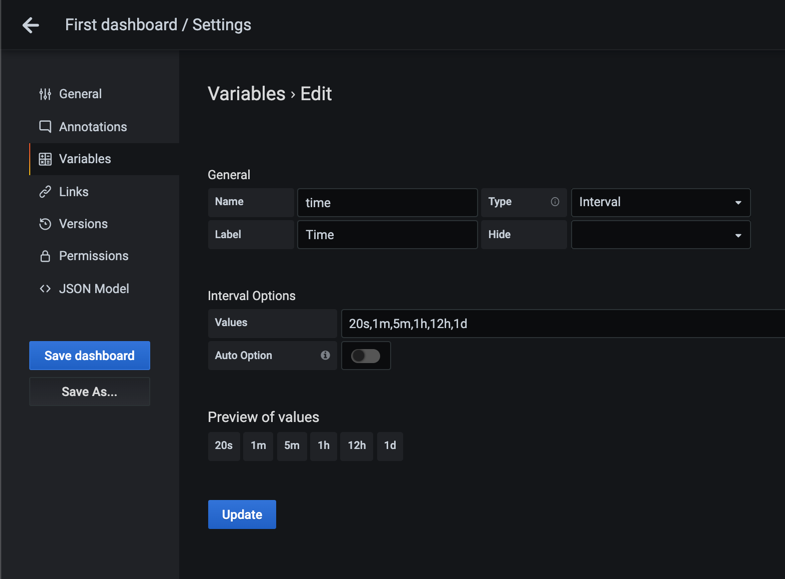
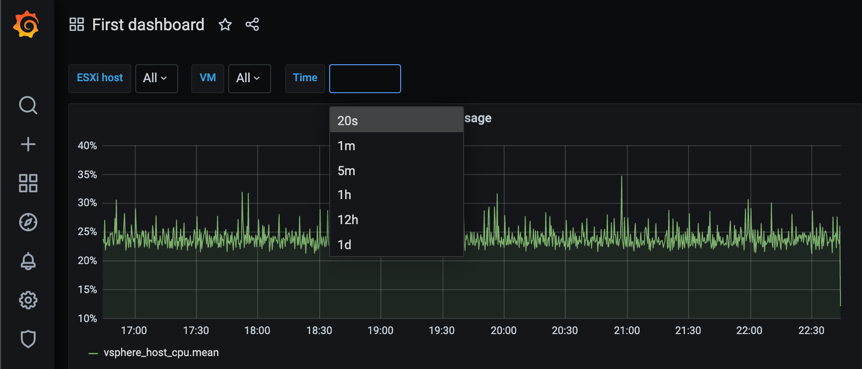
Remember to Add the variable, and you should see the new variable in your dashboard
Now, let's add this to our query editor.
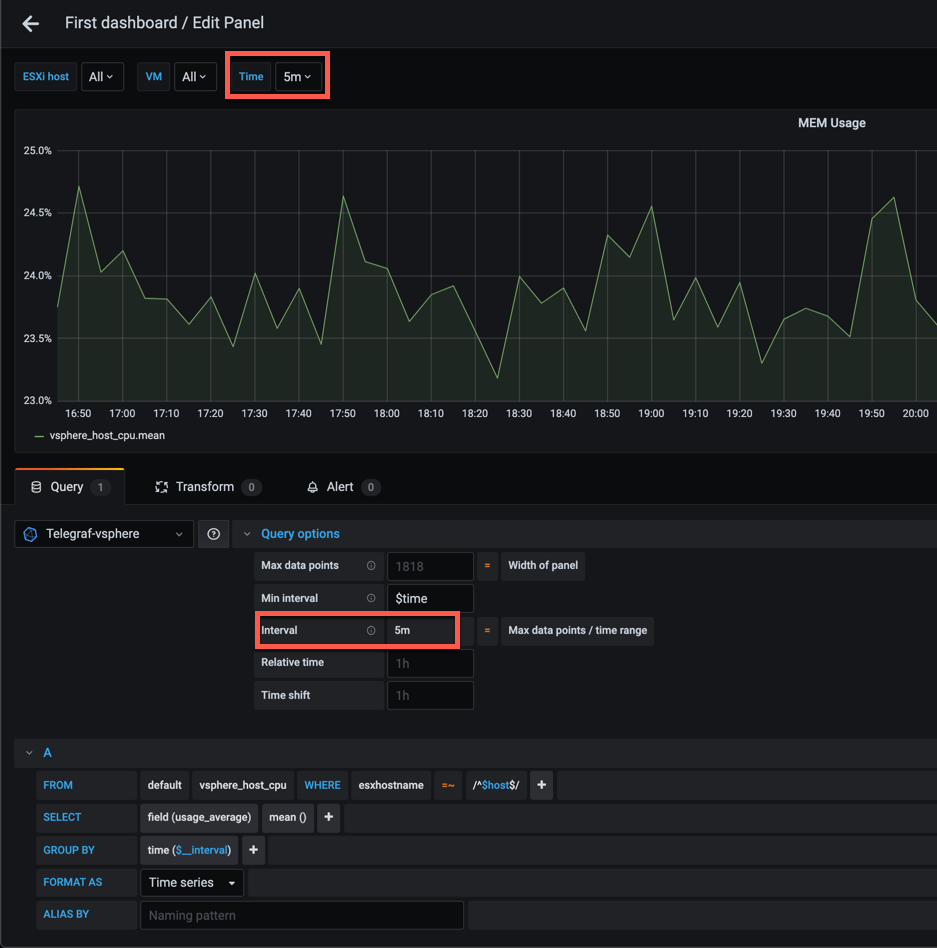
The variable should be used in the Min interval setting, and for the grouping we verify that $__interval is used
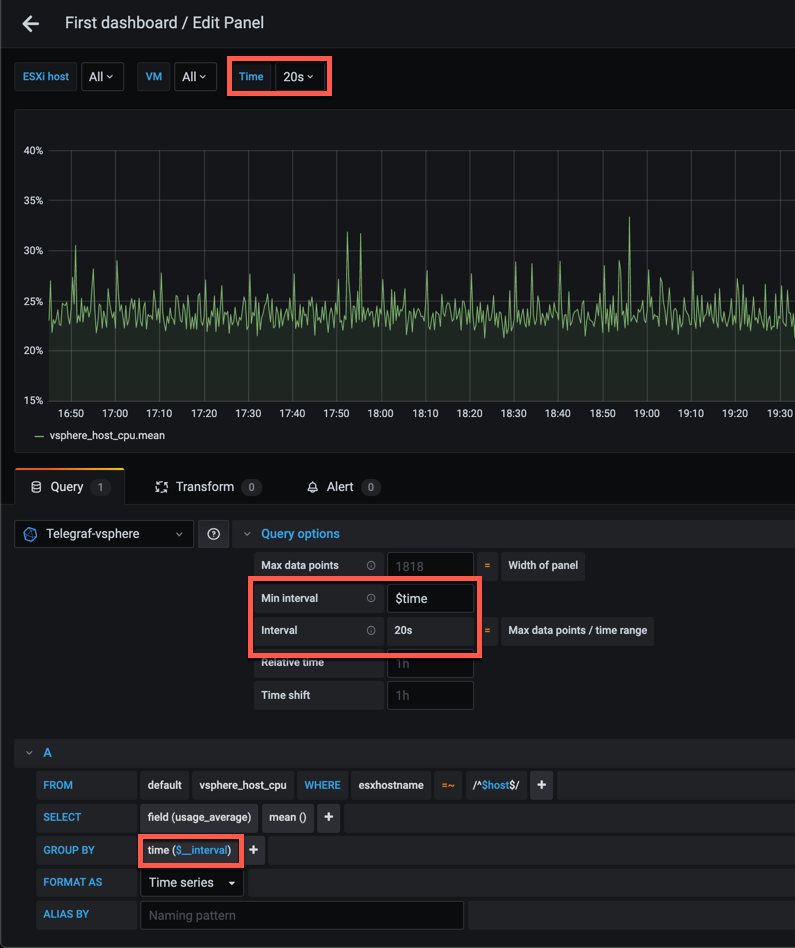
Let's set our variable to 5 minutes and verify that the graph changes
Regex'ed variables
Let's briefly look at how you can utilize the regex feature of the variable query to pull specific parts of the values if you want.
One use case for this could be to select a specific set of VMs based on a naming convention, another to remove the domain suffix of a machine name.
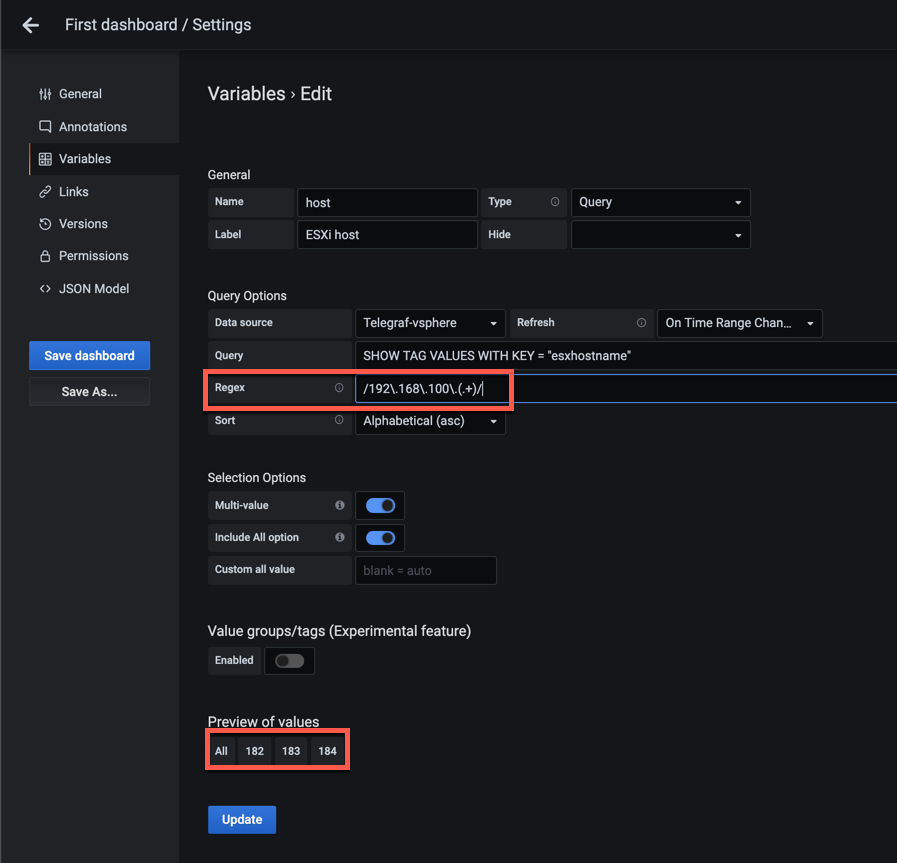
In my lab environment the hosts and VMs have no domain suffix so instead I'll show how we can remove the first three octets of the IP address that makes up my ESXi's hostnames. (A rather silly example, but hopefully you'll get the point...).
In the regex you use parentheses to specify the part you want to pull as values. For more information about Regex, check this Mozilla guide. If you want to test your regex there's plenty of online services available. I tend to use regex101.com
A note on Influx tags
While the tags on metrics is a great feature that helps us group and filter our data there is a very important thing to be aware of.
Tags are indexed in InfluxDB and they'll be a part of a series of points. A series is a set of records (or points as they're called in Influx) with a specific combination of tag sets (tag key and value) inside a time range (shard). If we take an ESXi host as an example this will normally have the same set of tags, i.e. clustername, datacenter, vcenter, which will have the same values. After all, how often does an ESXi host change vCenter or even Cluster?
When it comes to VMs however things can be a bit more difficult. A VM will not change vCenter or even cluster that often, but it has ESXi hostname as a tag, and with vMotion this is something that can change from time to time. This can in turn result in a VM having tag values for multiple ESXi hosts.
In addition to this, based on the object_discovery_interval configured in the vSphere input plugin for Telegraf, it might be that a VM will have an incorrect tag value for some time after a vMotion operation.
Let's check out a few examples that describes what happens.
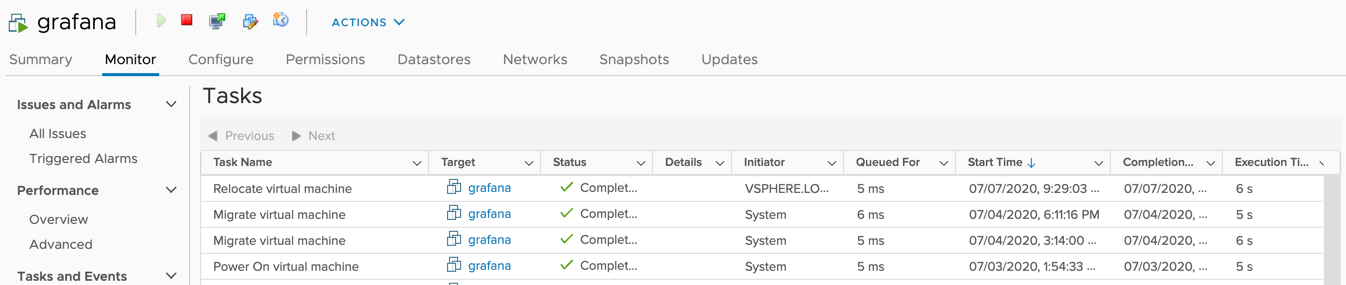
In my environment I have a VM that is running on one of my three hosts which I am purposely moving to a different host. Note from the Task list in vCenter that this host has not moved around the last couple of days
Let's now check a table view in Grafana where we are pulling the cpu metric for this VM, grouped by the esxhostname tag. I'm also adding a order on time descending so we'll get the latest records first, and even a limit on only 20 records
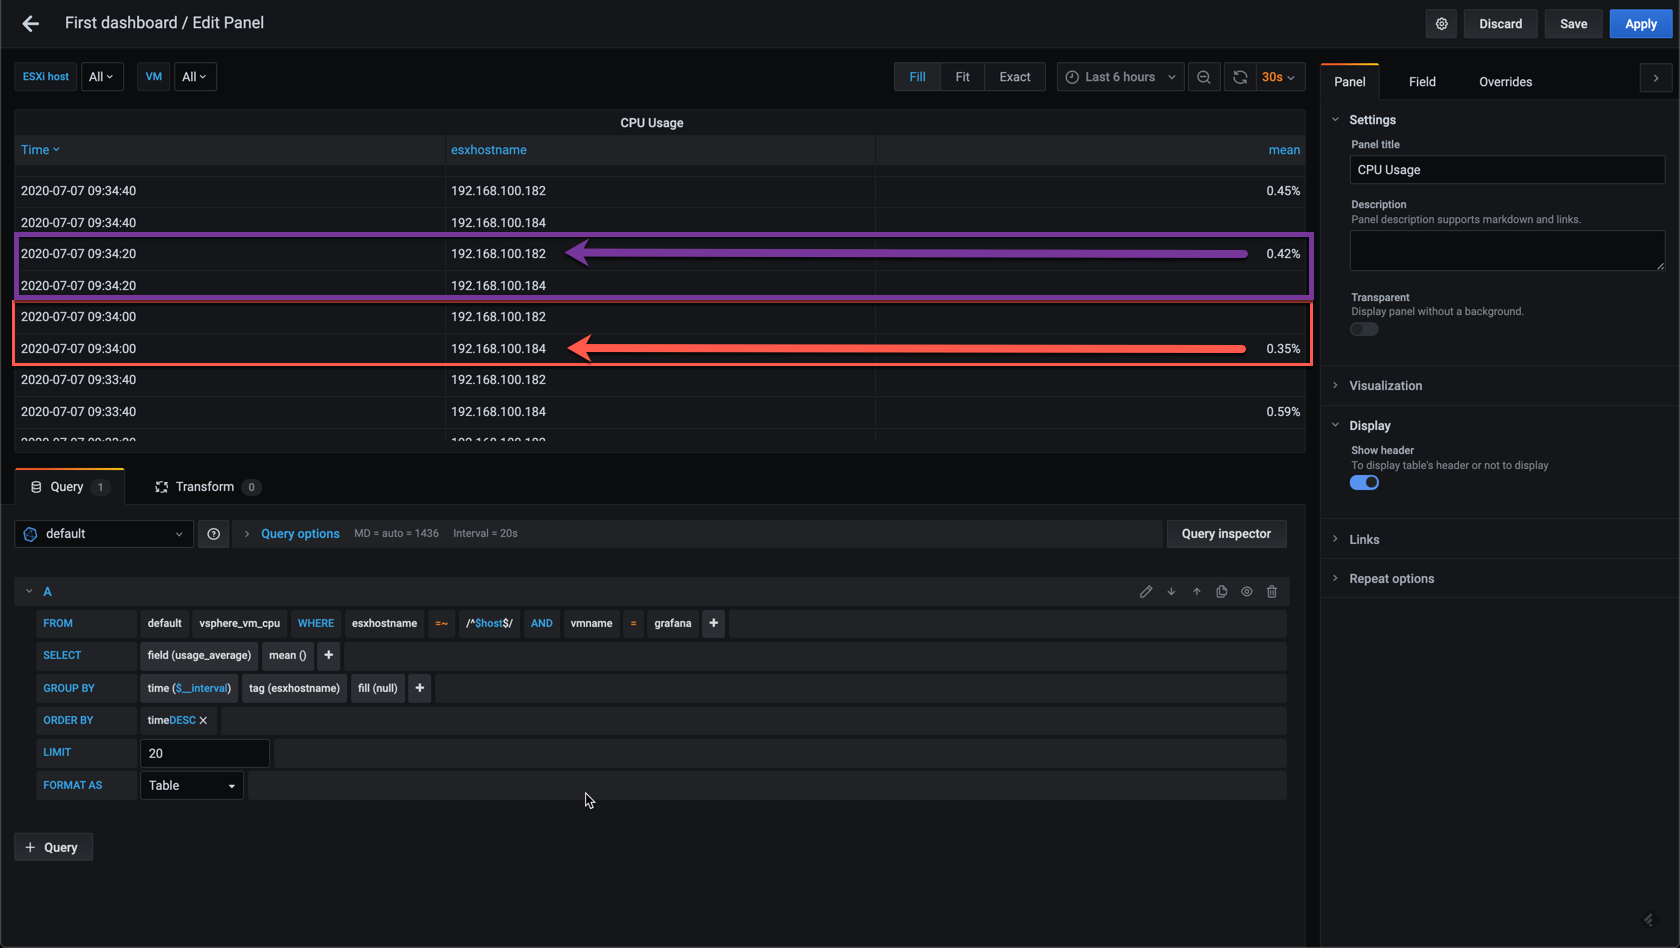
There's a few interesting things to note here. First there's two rows for each timestamp, one for each of the hosts, but only one has an actual value. The other thing to note is the timestamps. If we refer to the task list in vCenter we note that the VM moved at 09:29:03, whereas the change in Influx is first reflected at 09:34:20.
This happens because of the object_discovery_interval configured for the plugin. By default it discovers and rediscovers objects every 5 minutes, hence it took 5 minutes before the performance metrics reflects the change.
Let's look at this from with a database query where we notice two sets of results, these are called series, where we see the same results. The series for the host the VM was moved from returns rows (points) with no value, whereas the series from the host the VM was moved to shows values.
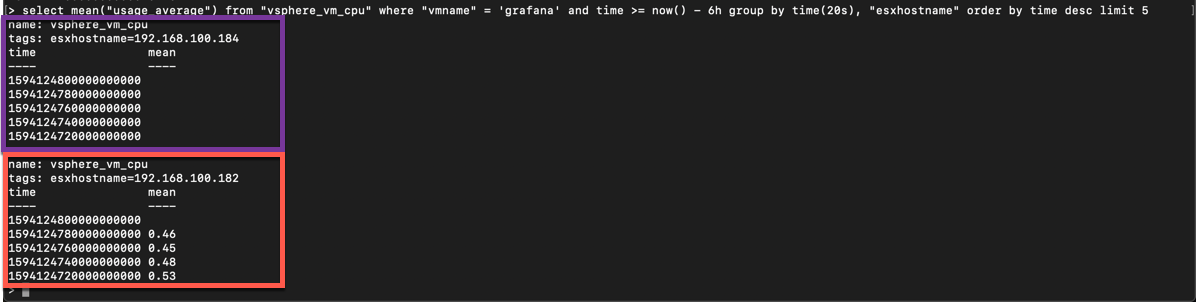
If we run the same query on a smaller time interval, which NOT includes records from where the VM switched hosts we get results from only one host (a single series).
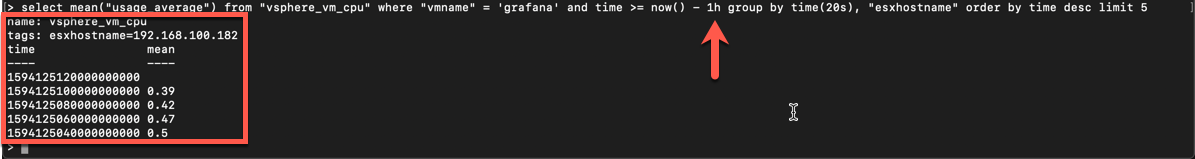
This shows that filtering on time can prevent erroneous results, however be aware that the time filter does not work with the show tag values query we use when creating variables in Grafana
Summary
This post has tried to explain the Variable feature in Grafana, and how you can use it to get more out of your graphs and your dashboards for instance to create reusable panels and dashboards.
There's more you can do with variables, like hiding, create constants etc, be sure to check the documentation for more info.
In the next post we will take a look at the Stat panel.
Thanks for reading and reach out if you have any questions or comments.