vSphere Performance - Telegraf, InfluxDB and Grafana 7 - Configuring Telegraf and InfluxDB
Overview
Intro
In this second part of a "series-in-series" of blogs about vSphere performance monitoring we'll take a new and closer look at the Telegraf agent from InfluxData and the vSphere plugin that's available.
I wrote a blog post about the plugin when it was released, so I will refer you back to this for things like installing and startup, it as that haven't changed since that. The vSphere plugin was released with version 1.8.0 of Telegraf, at the time of this writing Telegraf is shipping in version 1.15
We will cover the initial configuration of Telegraf and the vSphere plugin in this post, the database used will be InfluxDB 1.8.0. I will use a CentOS server, but both Telegraf and InfluxDB supports most Linux distros, containers and even Windows server, check the documentation for more info.
I've covered installation and configuration of Influx before so please reference that if needed. This post will be quite lengthy, but I wanted to cover all of the Telegraf configuration in one post for completeness
Installation
I'll leave a short reference of the steps needed for installing Telegraf and Influx on a CentOS server. Again, please reference my previous blog posts on this or check the InfluxData documentation
- Configure the InfluxData yum repository or download the rpm files
- Install Telegraf and InfluxDB,
yum install telegraf influxdb -y - Start InfluxDB,
systemctl start influxdb - Start Telegraf,
systemctl start telegraf
So, if we have both InfluxDB and Telegraf installed let's go ahead and take a look at the Telegraf configuration.
A note on security
In this post we'll not set up any authentication for InfluxDB and we will also configure vCenter credentials directly in the Telegraf configuration. In a production environment you will probably want to have some level of security present. I will do a follow up blog post where we take care of this later in this series
Telegraf configuration
For this series we'll make use of two Telegraf plugins. The vSphere input plugin will take care of pulling data from vCenter, while the InfluxDB output plugin will write the data from Telegraf to InfluxDB.
The complete configuration of Telegraf can be found in its configuration file /etc/telegraf/telegraf.conf. With time this file has grown quite big because of all the plugins. Luckily you can fan out specific parts in it's own config files which Telegraf will merge in with the telegraf.conf file. There is also the option to use commandline arguments to Telegraf, but we'll concentrate on the configuration files.
Multiple configuration files
As mentioned, like many other services, Telegraf supports splitting the configuration in multiple files. For Telegraf you can specify the directory where these files are found through the --config-directory parameter, if not Telegraf will check the /etc/telegraf/telegraf.d directory by default. All .conf files in this directory will be merged with the telegraf.conf main config file.
InfluxDB Output config
We're using InfluxDB as the recipient of the Telegraf data so we will need to configure the InfluxDB output plugin to point to the correct InfluxDB instance. For this demo we're using an instance installed on the same server as the Telegraf plugin so we can just leave the default configuration alone and Telegraf will write to Influx. In a later post I will add authentication to Influx and then we'll need to look closer at the Influx configuration.
Note, if you want to split Telegraf from InfluxDB, or you have Telegraf running on multiple servers, you'll need to configure the the correct address to your InfluxDB instance in the urls parameter of the [outputs.influx] section
So just by starting InfluxDB and Telegraf without touching the configuration you should start getting data from the server (provided Telegraf runs on the same server as Influx) in a database called telegraf in Influx. If you want to have a different name for the database you'll need to configure this in the InfluxDB out plugin section.
A note on data retention
By default InfluxDB will not delete any data written to it's database. Sooner or later this might be an issue. In a later post we will check out Retention Policies in InfluxDB that will take care of deleting old data
vSphere input config
Now let's configure the vSphere plugin so we can pull data from our vCenter as well. To make it easier to maintain and troubleshoot we'll put the configuration in a separate .conf file in the /etc/telegraf/telegraf.d directory.
The default configuration of the plugin will probably work fine for a lot of environments and the only thing to add is the address and the credentials for your vCenter(s).
However we will discuss in short a few points the different possibilities which can help in larger environments.
Collection intervals and Realtime vs Historic metrics
First to lay some grounds, Telegraf pulls metrics from the Host, VM, Datacenter, Cluster and Datastore domains.
Realtime data from vCenter is recorded on 20 second intervals, however this is just for Host and VM metrics. The vSphere plugin also pulls Datacenter, Cluster and Datastore metrics. These metrics are recorded on 5 minute intervals (rollups) in vCenter.
The plugin also has a specific interval for discovery and rediscovery of objects, by default this is set to 5 minutes. This means that if a new VM is created in vCenter it might take 5 minutes before Telegraf will discover it, and it will also mean that if a VM is vMotioned to a different host it can take 5 minutes before it is tagged with the correct hostname in Influx. This interval is configurable in the object_discovery_interval parameter
By default Telegraf will pull all metrics from vCenter on the same interval, including both Host and VM metrics as well as the three "5-minute" domains. For any one plugin you can only specify one interval for pulling data. You can however have multiple instances of a plugin.
Telegraf will use the global collection interval for the vSphere plugin if nothing else is specified. By default this is 10 seconds. Telegraf will handle this and per it's documentation it will skip the cycles that falls outside of the metric interval. However the plugin still needs to use resources for checking for metrics on the configured interval and this might introduce a problem where the plugin won't finish inside it's collection interval.
If that happens you start to get events like this from your plugin
[agent] input "inputs.vsphere" did not complete within its interval
If you get these messages you are losing data as Telegraf won't be able to pull all data it wants. And even if you manage to fetch things inside the global 10 second interval it's a waste of resources on both the Telegraf server and vCenter as you'll get 20 second data at best.
Split in multiple instances
Because of this the best practice is to create two instances of the vSphere plugin. One where you specify a collection interval suitable for Host and VM metrics where you exclude everything but the Host and VM metrics you want, and one where you exclude Host and VM metrics and include the metrics you want from the Datacenter, Cluster and Datastore domains. For this instance you specify a higher collection interval.
So what collection intervals should I use?
Well, it depends... If you're environment is quite small you can probably use 20 seconds for the Host/VM metrics and 300 seconds (5 minutes) for the rest to correlate with vCenters collection intervals. If you have a somewhat larger environment it probably won't fit all host and VM metrics inside a 20 second interval so here you need to experiment a bit.
Perhaps 60 seconds will work, making a compromise between getting the data as close to realtime as possible and not losing any data on the way. Again, even if you would fit all data inside a 20 second collection interval it's wise to ask yourself if it's really needed? I'm pretty sure your vCenter would be more happy with you if you raise the interval a bit.
If you still can't fit data inside the interval you should try with a higher interval, or start looking at excluding some metrics. Do you really need the Datacenter or Cluster metrics? Do you need all of the Host and/or VM metrics? You can also look at restricting what parts of your environment you collect, but that's out of scope of this series at the moment.
There is also a few other configuration settings to experiment with. Both can affect vCenter performance so pay close attention to your environment when playing around with these.
- max_query_metrics: This setting should correspond with the
config.vpxd.stats.maxQueryMetricssetting in vCenter and controls how many metrics that will be pulled in each query. More metrics per query means faster query, but it might affect vCenter performance - collect_concurrency and discovery_concurrency: You can control how many simultaneous queries Telegraf will be allowed per resource type. A higher number will result in faster queries, but it could impact vCenter performance and it requires more resources on the Telegraf server
Example configuration
So my configuration file for vSphere data will look something like this (as the example from the Telegraf documentation)
 1## Realtime instance
 2[[inputs.vsphere]]
 3  interval = "60s"
 4
 5  vcenters = [ "https://someaddress/sdk" ]
 6  username = "someuser@vsphere.local"
 7  password = "secret"
 8
 9  insecure_skip_verify = true
10  force_discover_on_init = true
11
12  # Exclude all historical metrics
13  datastore_metric_exclude = ["*"]
14  cluster_metric_exclude = ["*"]
15  datacenter_metric_exclude = ["*"]
16
17  collect_concurrency = 4
18  discover_concurrency = 4
19
20# Historical instance
21[[inputs.vsphere]]
22  interval = "300s"
23
24  vcenters = [ "https://someaddress/sdk" ]
25  username = "someuser@vsphere.local"
26  password = "secret"
27
28  insecure_skip_verify = true
29  force_discover_on_init = true
30
31  # Exclude all realtime metrics. Note that everything is included by default
32  host_metric_exclude = ["*"] # Exclude realtime metrics
33  vm_metric_exclude = ["*"] # Exclude realtime metrics
34
35  collect_concurrency = 4
36  discover_concurrency = 4
As mentioned I'll put this in a separate .conf file in the /etc/telegraf/telegraf.d directory and restart the Telegraf agent for it to pick up the changes. In an upcoming post I will cover how we can pull vCenter specifics out of the conf file so that we're not keeping credentials in clear text.
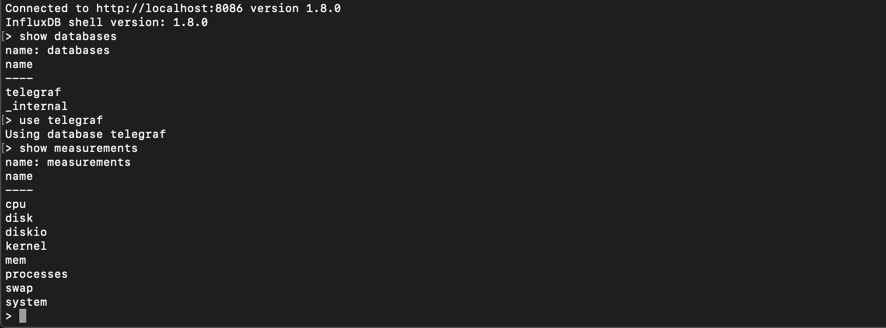
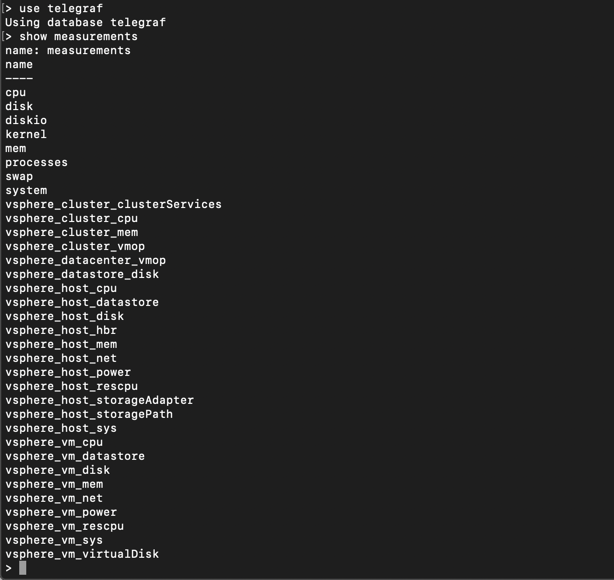
To verify, I can do a quick show measurements in Influx to see my new measurements
Telegraf agent configuration
Remember that the Telegraf agent pulls data from the server it runs on by default. Although this isn't that resource intense it still will require resources. Also note that the global collection interval is 10 seconds by default so this will run quite often.
If you're suspecting that collection of data from vSphere is having issues it might be worth looking at the agent configuration as well as the vSphere plugin config discussed previously.
A couple of settings for the Telegraf agent to take a look at (these are all in the [agent] section):
interval: This is the global collection interval. Telegraf will use this when pulling data from the server it runs on, and for any plugin that has no specific interval configured. If you don't need 10s updated data from your local Telegraf server you can raise this to save some loadmetric_buffer_limit: This setting controls how many metrics the agent will hold in memory per output before dropping it. If this is set too low, and Telegraf can't finish writing the metrics to the output plugin in time, it will drop the remaining unwritten metrics. Note however that if you raise this setting it requires more memorymetric_batch_size: Controls how many metrics that are sent to an output plugin at a time. Use in conjunction with the memory_buffer_limit where the buffer_limit should be set in multiplies of the batch size (refer to the documentation for more info)
For the two latter you can verify/debug this in the debug log of Telegraf that outputs the status of the buffer and the batch size (note that you need the debug log level for this):

Other resources
As always there are other great minds that have done similar stuff which also could be worth checking out, like this from my fellow vExpert Jorge de la Cruz
Summary
This post has discussed a few of the options available for controlling the vSphere input plugin for the Telegraf agent. A great option for pulling data from a vSphere environment. In the next post we will finally make use of the data by building dashboards in Grafana.
Thanks for reading, and if you have any questions or comments please feel free to contact me