vSphere Performance - Revisiting VCSA Monitoring
It's been a while since my post on vCenter Server Appliance (VCSA) monitoring and after having gained a bit more experience around this and with the updates in Grafana since that post I thought I would revisit that work and see if we could make some improvements.
Starting point
The mentioned blog post is pretty detailed on how I pull things from the VCSA and push it to a InfluxDB database so I won't repeat that, check that previous post for that. (It's a bit lengthy, as this post also probably will be..)
Actually, if you haven't seen that post you might not have seen my other posts on vSphere performance monitoring either. All posts can be found at this summary page.
In this post we will add in some additional information and use a couple of additional endpoints which we will see. We'll also check out a couple of new things in Grafana since my previous post so let's get started!
So, to set the starting point let's see where I left off in the previous post
Current dashboard
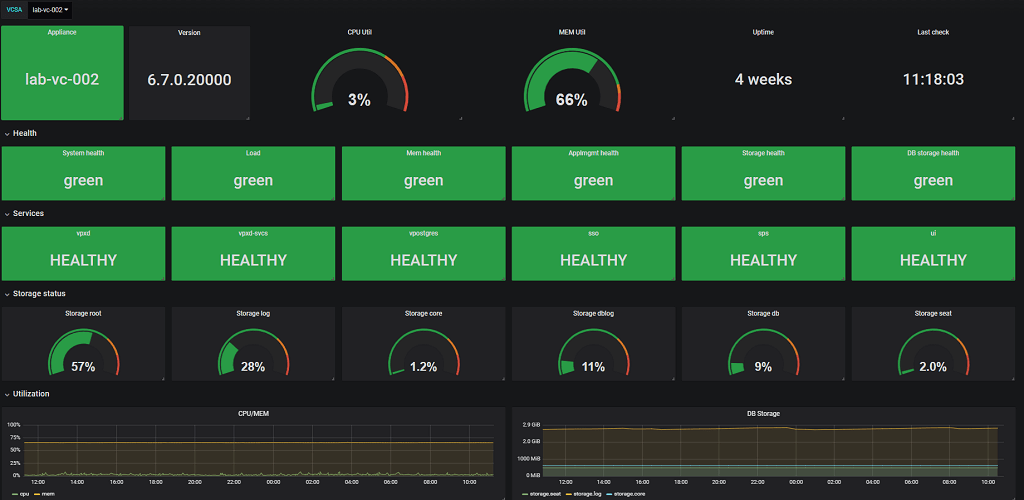
The dashboard gives us the version information and uptime of the appliance, the health boxes which we find on the VAMI front page, the status on a few services, storage utilization and trending graphs for cpu/mem utilization as well as storage.
Appliance update information
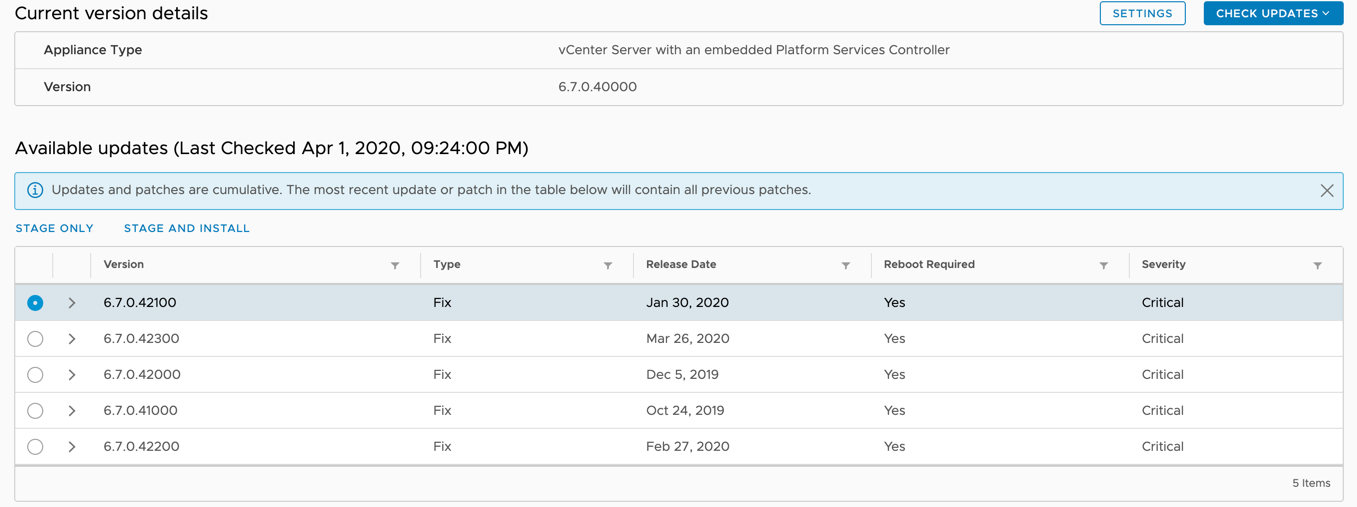
The first additional data I will pull from the VCSA will be the update info. In the VAMI we have the Updates section which lists the available updates.
VAMI update page
\
The corresponding API endpoint for available updates are under the /rest/appliance/update section. Check this post for more information about them, and a little heads up on a few querks that is nice to know of.
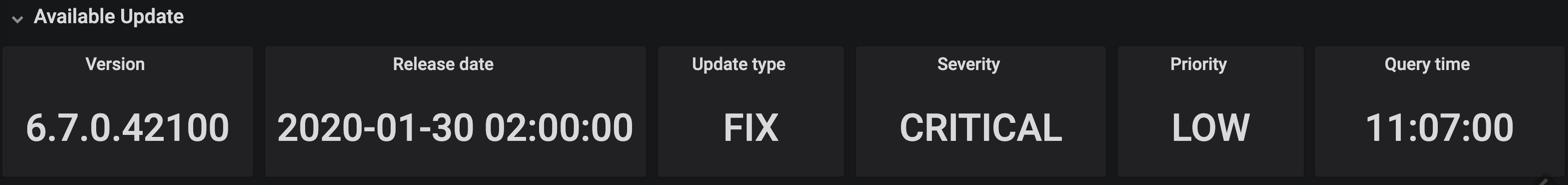
In my script I will pull the information about the current version status as well as the pending "last_check". I will make use of the latest_query_time to track when the latest check took place.
With that data I can add the following row to my dashboard to display my Update status
\
A script pulling this appliance update information can be found on GitHub
Appliance backup information
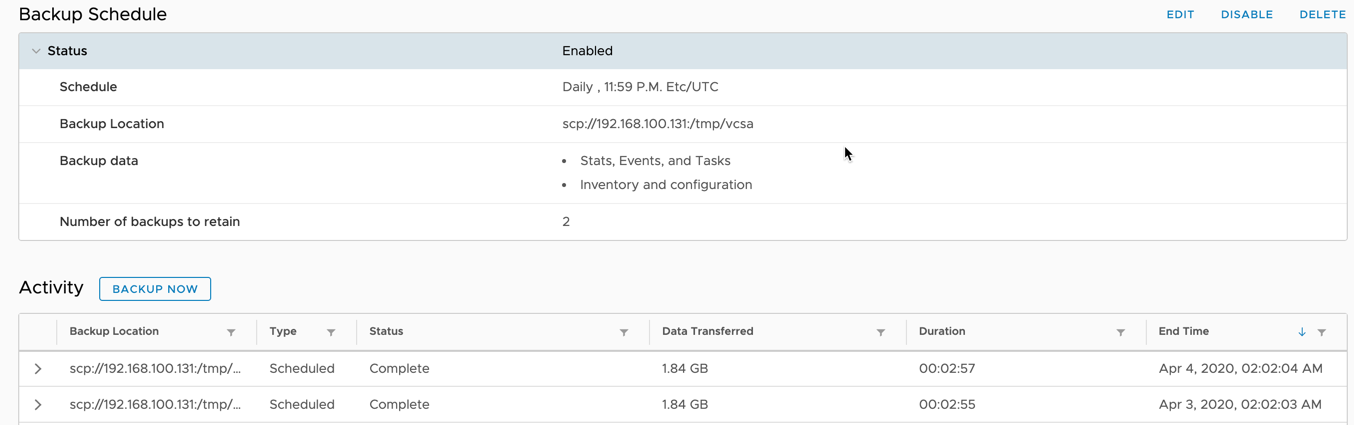
With the update information in place, let's take a look at the file-based backup. This is a critical part of the VCSA. Especially in vCenter 7 as the image-based backups no longer is supported.
Again, let's check the details in the VAMI.
VAMI Backup page
\
Check this post for more information on the corresponding API endpoints available. I'll make use of the latest Job details and the schedule in the dashboard. Here we could easily put in some color coding if the backup duration is above a certain threshold etc.
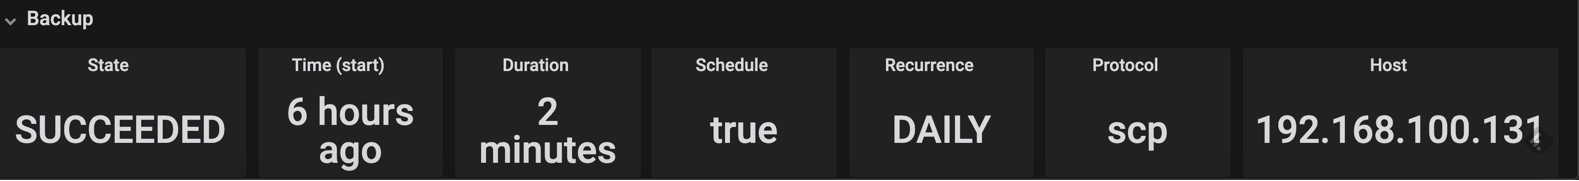
Backup info in Grafana
Changing the Grafana dashboards
With those two new pieces we have a Grafana dashboard looking something like this
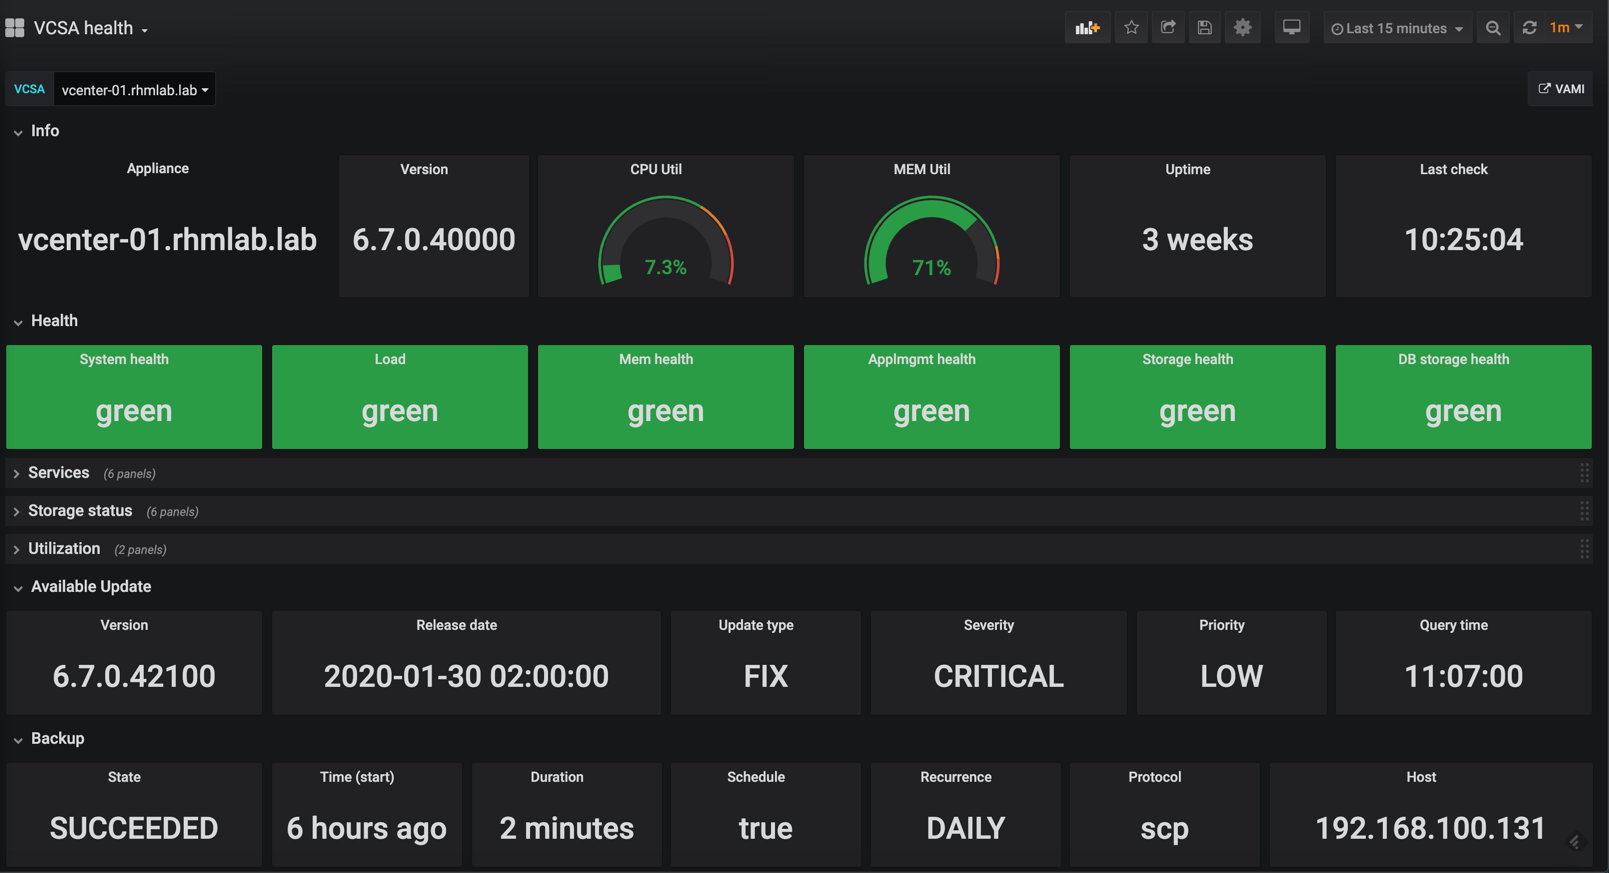
Updated Grafana dashboard
Notice I have collapsed some of the rows to fit it to my screen. A nice thing about that is that the data in a collapsed row is not collected or updated so it saves the dashboard from some loading time.
But as I mentioned in the start of this post (sorry about the yet again long post..) there has been some nice new features in Grafana and I've picked up some new skills since I started my journey in this exciting space so we'll see if we can improve the dashboards even further.
A note on the dashboard layouts
I will point out that in my opinion you should experiment with your data and find the layout that suits you and your environment best. I believe that you will get much more value from your data when you dig into it than just pulling some API and importing a pre-built dashboard. With that said I hope that the next few sections can give you some ideas on how to build the perfect dashboard for YOUR environment.
Switching the Grafana panels
In the current dashboard I've used the builtin Singlestat panel for the different "boxes" as well as the Gauge and Graph panels.
Besides utilization metrics I still think the "box" panel idea fits rather well for this dashboard so I'll stick to that. I would like to point out that since i started my Grafana projects a new Stat panel has been developed by Grafana. It's still in beta at the time of this writing so their might be some changes to the behavior later on, but I suspect this will replace the Singlestat eventually.
As long as I have only a single value in my boxes the Singlestat panel suits well, but the Stats panel has the ability to have multiple values so it might be worth checking out (I have an example of that later on). The switch between them are quite easy, and since both are built by Grafana and ships with the product I count on a smooth transition if one get replaced by the other.
In newer versions of Grafana you can easily switch the panel type as opposed to before when you had to recreate the panel. This is a very nice feature making it easy to experiment and finding the best visualization for a specific metric.
Switch panel type
Testing some dashboard layouts with multiple vCenters
So, up until now we have only seen information from one vCenter in the Grafana dashboard. I think the real value comes when we can correlate data from multiple VCSAs in one dashboard or dashboards.
I'm switching to my employer's lab environment now where I've set up the same dashboards. Here I'm also using the Stat panels instead of the Singlestat.
First off I've created an overview dashboard with only version information and backup status. This is admittedly not the most exiting dashboard, but again maybe it can give you some ideas. I'm using the repeat feature here to easily display the same panels for each of our vCenters.
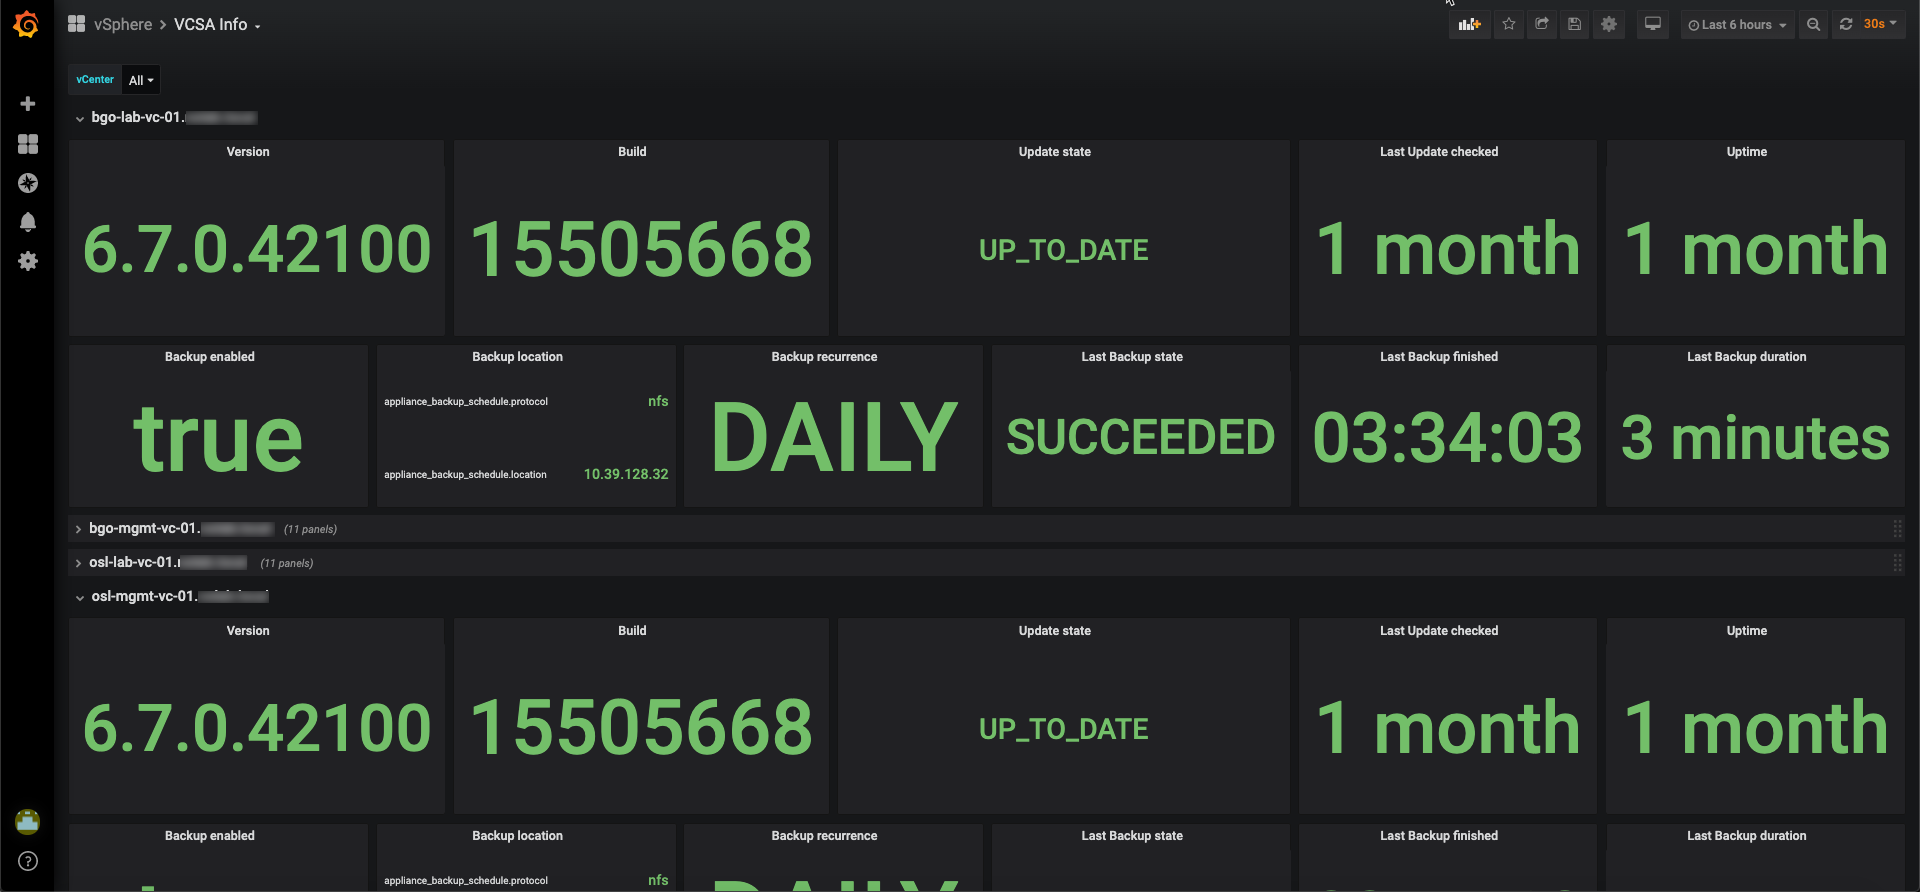
Multiple VCSAs
\
To use the repeating feature you first need to set up a variable with records to repeat from. In this case I've set up a variable with all my vCenter servers
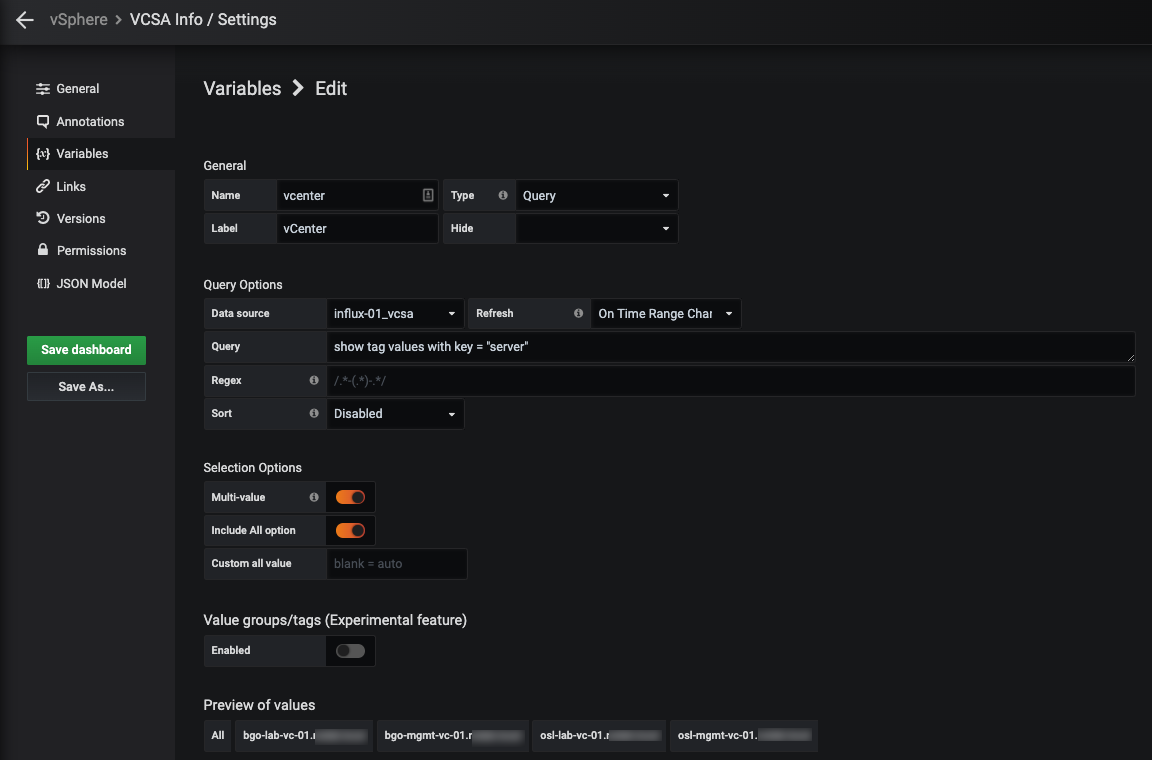
Grafana variable
\
I've put all of the panels for one vCenter into one row and used the repeat for feature on the row (it is also available on individual panels) to create one row with the same panels for each record in the vCenter variable.
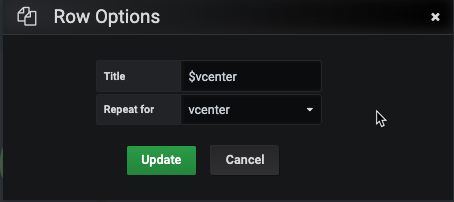
Row options
\
Finally you specify your query to use the vCenter variable in the where clause. Save your dashboard, reload and you should have one row for each of your vCenters.
Since I have the version and backup information in a separate dashboard (again, this might not fit your needs) I can leave those out of the Health dashboard
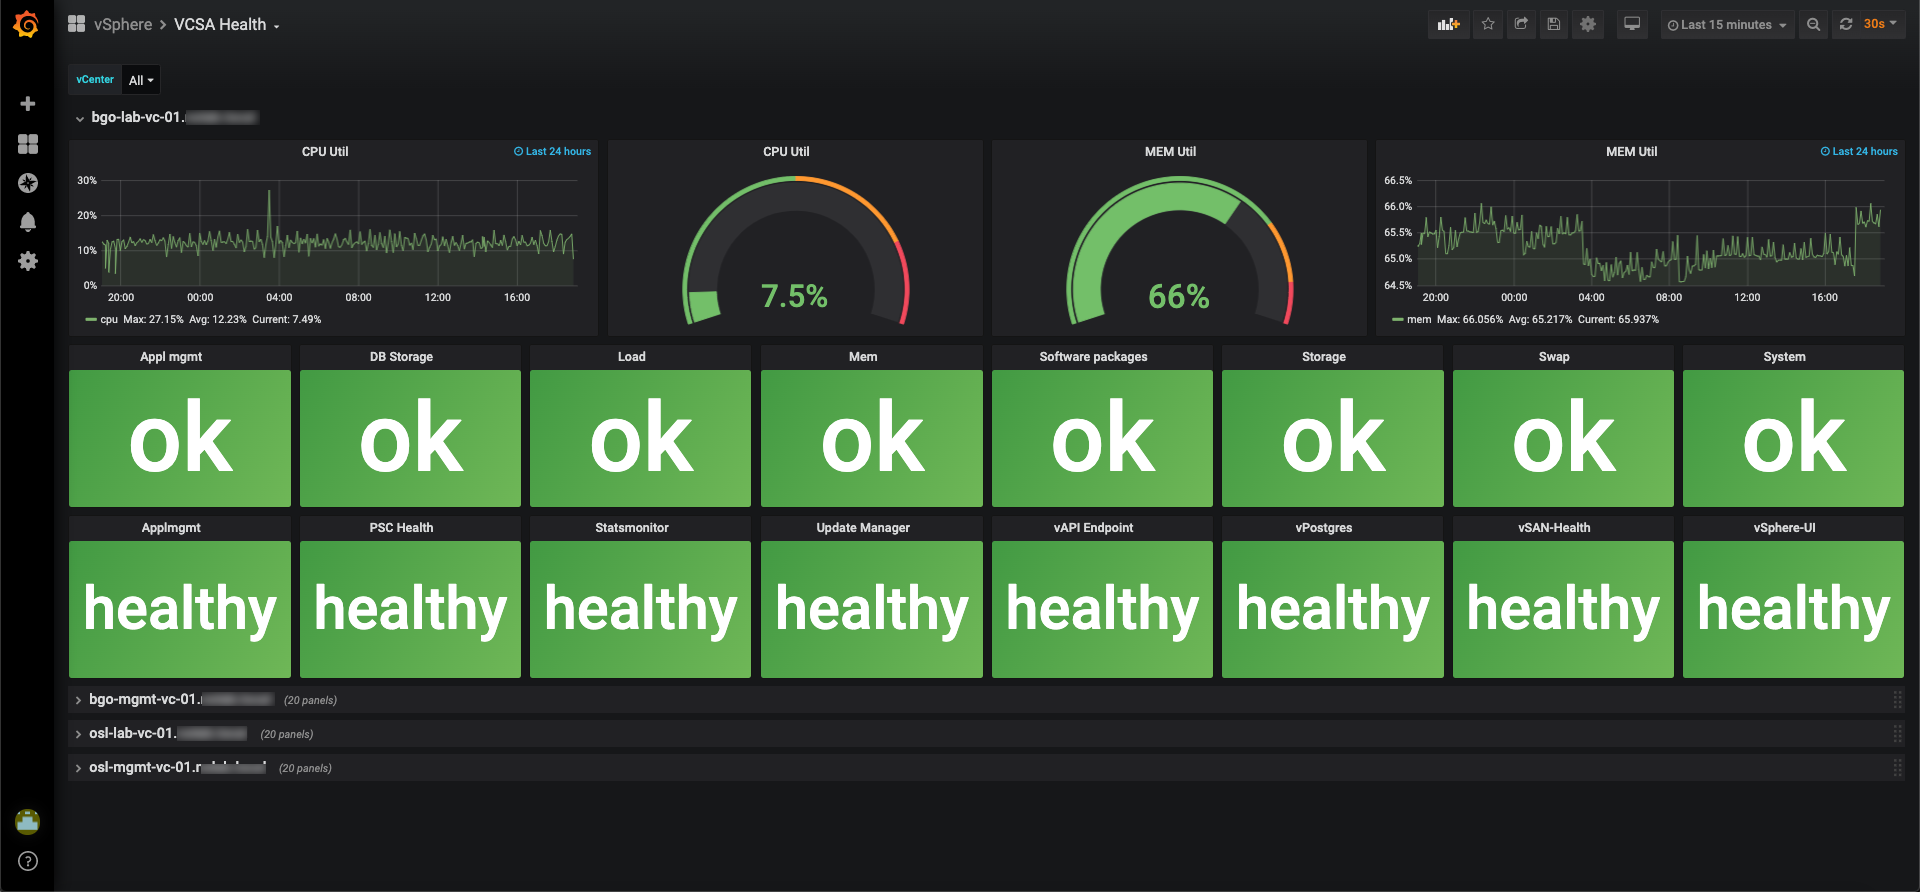
Dashboard with multiple VCSAs
\
Now, let's check out another way of utilizing the Stat panel when working with multiple vCenters. I think this one really gives a clear view of the health of the environment. You should easily be able to spot if any vCenter has an issue here
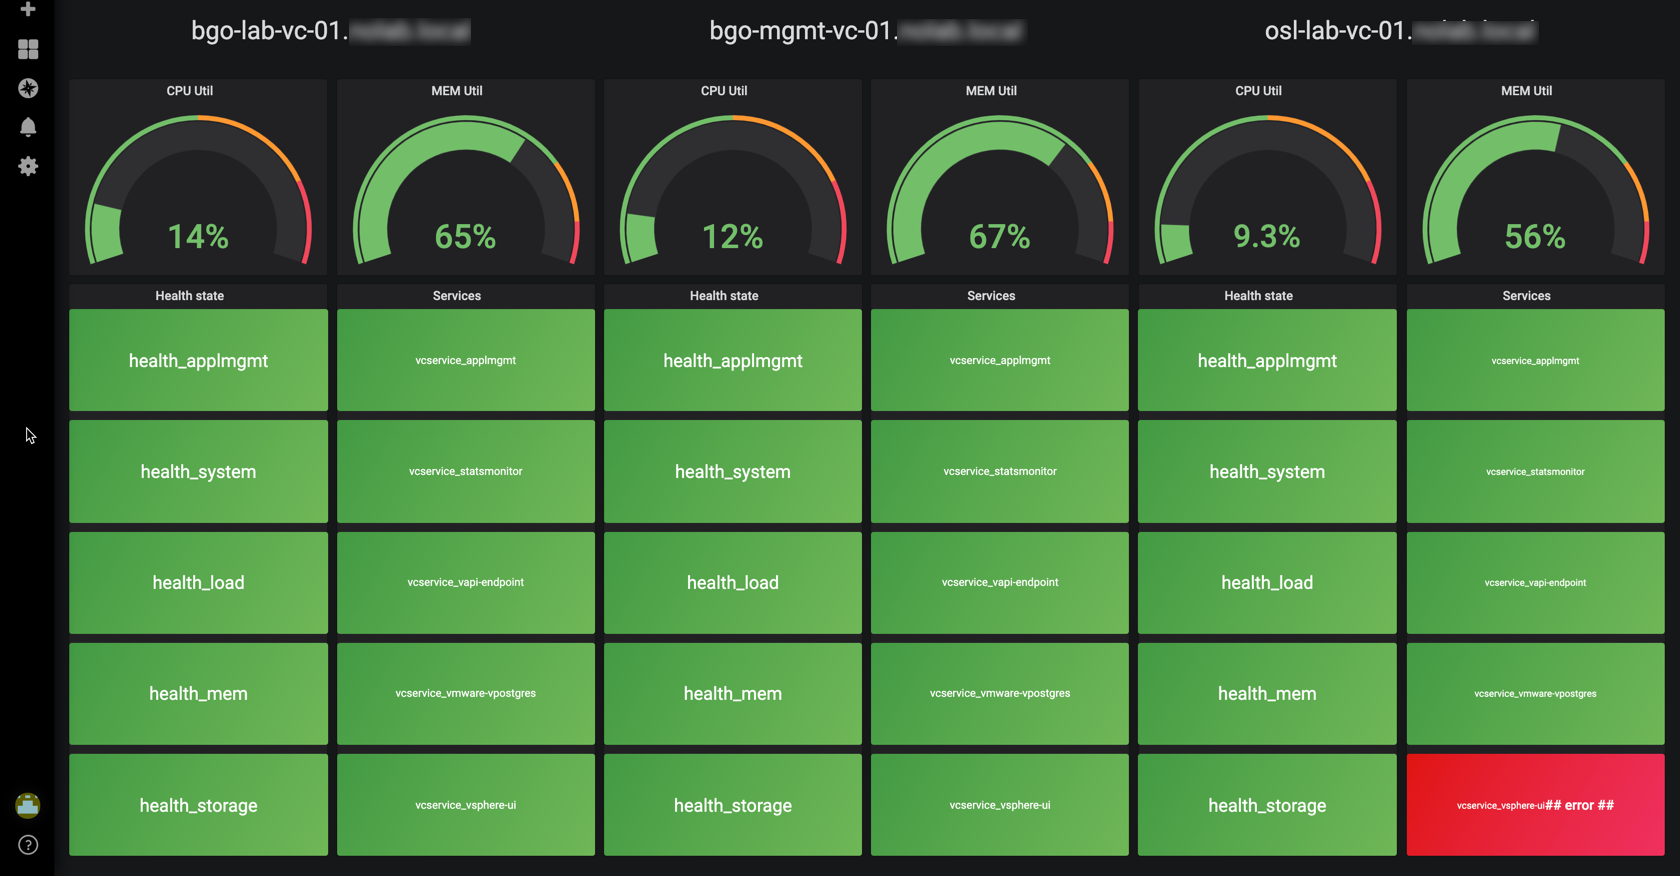
Another dashboard with multiple VCSAs
\
In this dashboard I've put multiple queries in the Stat panel so there's only two Stat panels per VCSA. I've also removed the OK text if there's no error. I'm displaying the name of the health / service instead.
Again, choose the layout that fits your environment and use-case best.
Script changes
Over on GitHub you can find the scripts with examples on how to pull information from VCSA and push it to InfluxDB. I have chosen to split it in multiple scripts, but you could easily combine all or some of them. One thing to think about is the polling interval you will use for the different endpoints and split the scripts based on that.
The CPU and Memory utilization, as well as the Health and Service status, is probably something you want to pull pretty often while the Update information and Backup details is something you can pull once a day.
In my scripts I've added in the possibility to pull more vCenters in one go, and I've also ported them to Powershell Core. The only real difference there is how you can skip certificate validation.
Summary
To summarize I hope this post has given you some inspiration on how you can build valuable dashboards for your vCenters, and of course other parts of your infrastructure.
I've uploaded all the scripts and the different dashboards to GitHub, please feel free to take a look at them and reach out if you have any questions or comments.
In an upcoming post I'll have a crack at the new vCenter 7 so stay tuned for that!
Thanks for reading, stay safe!