vSphere Performance - vCenter Server Appliance (VCSA) monitoring
This post is a (late) follow-up on a previous post I did about exploring the monitoring endpoints of the vCenter Server Appliance (VCSA), and an addition to the vSphere Performance blog series.
Now we will add performance metrics and health status of the VCSA to our monitoring solution. We'll utilize the REST APIs in vCenter and feed the data into our Influx database and visualize it in Grafana.
In vCenter we have the Appliance Management page also refered to as the VAMI. We will use this as a blueprint of what we want to visualize, but we'll try to fit the important parts into a single Grafana dashboard.
As mentioned we will use InfluxDB as the database for the data. I will use Powershell to query the API endpoints and write the data to a database named "vcsa" in Influx. Check out my previous post on how to get started with scripting against these APIs. There's also lots of documentation available online, code.vmware.com is a great starting point
So, first of we'll explore the parts of the VAMI we want to replicate and then the corresponding API endpoints.
Health
The VAMI home page has a section with some appliance info, different health status and the sso service. We will take some of these into our dashboard.
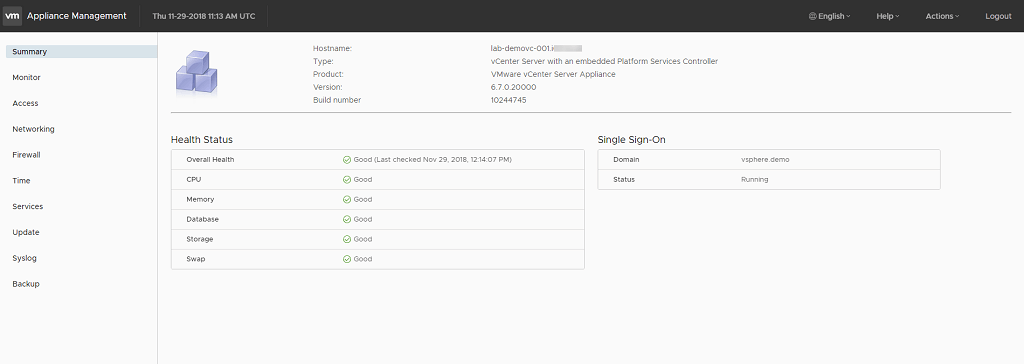
vCenter Appliance Management
The endpoints we need to use here includes:
/rest/appliance/health/metric - Outputs the status of the metric, i.e. applmgmt, system, load, mem, dbstorage, storage, swap
/rest/appliance/system/metric - Info about the appliance, i.e. version, uptime, type
The sso service will be included in the Services section.
I've split health and system in two different scripts, mostly because I want to be able to run these on a schedule and the system endpoints doesn't necessarily need to be queried as often as the health endpoints.
In the health script I've put the different endpoints in a string
$metrics = "applmgmt","database-storage","load","mem","software-packages","storage","swap","system","services"
Note that the services endpoint in this part is not the same as the vmon services later on. The appliance services is the actual OS services running, whereas the vmon service is the vCenter services.
Next I'll iterate through these and add the metric to the base /rest/appliance/health uri. Before I iterate I'll do a query against the lastcheck endpoint which will output the timestamp of the last health check. I'll use this timestamp on each of the statuses. The Get-DBTimestamp function is a custom function that converts a datetime to the needed influx format:
$lcresponse = Invoke-RestMethod -Method Get -Headers $sessionheader -Uri $lcuri
$timestamp = Get-DBTimestamp (get-date $lcresponse.value)
foreach($met in $metrics){

    $uri = $BaseUri + "appliance/health/$met"
    if($met -eq "services"){
        $uri = $BaseUri + "appliance/$met"
    }

    $response = Invoke-RestMethod -Method Get -Headers $sessionheader -Uri $uri -ErrorVariable metErr
Note that I am prefixing the metric name with "health_" to create my measurement names in Influx.
Another thing to note with these endpoints is that they output the status as text. In Grafana I would like to color code the statuses based on the text, but this is not supported. To work around this I've added my own numeric value based on the text state and I'm using both the text and the numeric value in the Influx point protocol syntax which is added to the $tbl array:
      switch($met){
            "database-storage" {$measurement="health_databasestorage"}
            "software-packages" {$measurement="health_softwarepackages"}
            default {$measurement = "health_$met"}
        }
      if($met -eq "services"){
            foreach($val in $response.value){
                $name = $val.key
                $value = $val.value.state
                switch($value){
                    "STARTED" {$val = 0}
                    "STOPPED" {$val = 1}
                    default {$val = 9}
                }
                $tbl += "services,server=$vcenter $name=""$value"",value=$val $timestamp"
            }
        }
        else{
            $value = $response.value
            switch($value){
                "green" {$val = 0}
                "orange" {$val = 1}
                "red"  {$val = 2}
                "gray"  {$val = 9}
                "unknown" {$val = 9}
                default {$val = 9}
            }

            $tbl += "$measurement,server=$vcenter text=""$value"",value=$val $timestamp"
        }
}
After building my array we'll post the data to the vcsa database in Influx:
$database = "vcsa"
$postUri = "http://$influxServer" + ":$influxPort/write?db=$database"
Invoke-RestMethod -Method Post -Uri $postUri -Body ($tbl -join "`n")
The version info and uptime is somewhat easier. We're doing two queries and combining this information to a "appliance_info" measurement:
$verUri = $BaseUri + "appliance/system/version"
$upUri = $BaseUri + "appliance/system/uptime"

$verResponse = Invoke-RestMethod -Method Get -Headers $sessionheader -Uri $verUri
$upResponse = Invoke-RestMethod -Method Get -Headers $sessionheader -Uri $upUri

$version = $verResponse.value.version
$build = $verResponse.value.build

$uptime = $upResponse.value
$tbl += "appliance_info,server=$vcenter version=""$version"",build=$build,uptime=$uptime $timestamp"
Note that I'm skipping the appliance type etc. If you want to add this please be aware that the Influx point protocol doesn't support whitespaces in values or tags so you need to make sure you handle this before adding.
I've skipped the "post to influx" part of this script as it is the same procedure as above.
In Grafana we can now start to build out our dashboard.
To utilize the numeric value in the health boxes I'll use the value in the Grafana/influx query, add a value mapping and finally enabling coloring based on the value.
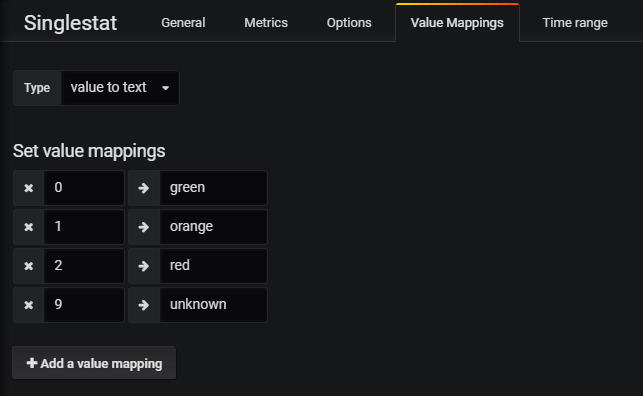
Grafana value mapping
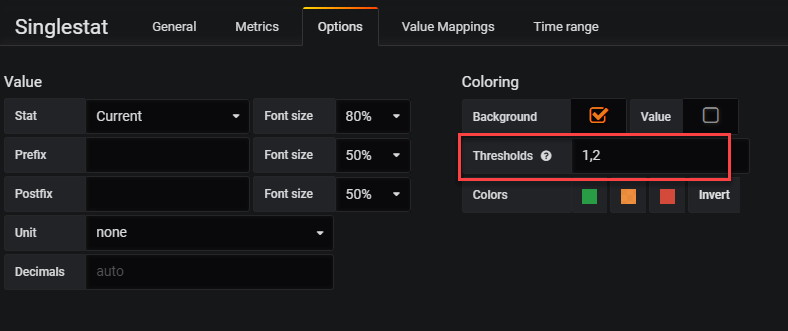
Grafana coloring enabled
After adding the health statuses we want together with the appliance info we can create a dashboard like this
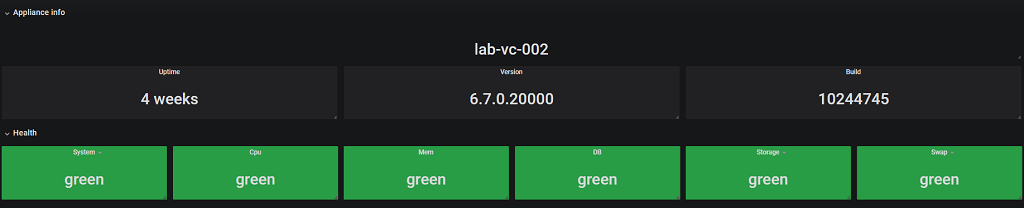
Health and info dashboard
Services
Next we'll add in the vmon services.
In vCenter 6.7 we've got a services view in VAMI which is nice. Here we can stop and start the different services and see the status of them. We will grab these and use some of them in our dashboard.
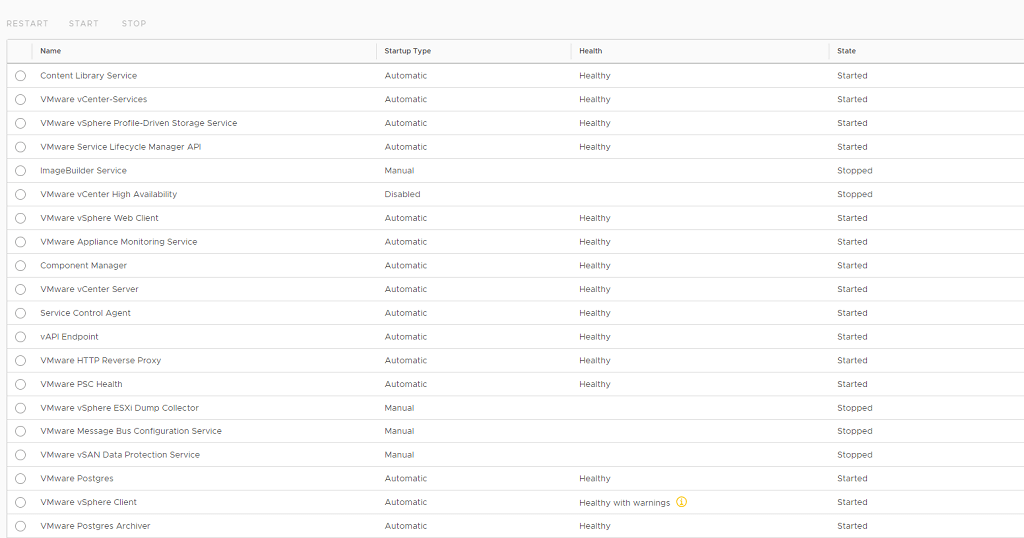
VAMI service page
The endpoint in play here is the /rest/appliance/vmon/service . This will grab all of the vmon services and give the health and state of the services.
On my 6.7 U1 demo appliance I have 30 vmon services available
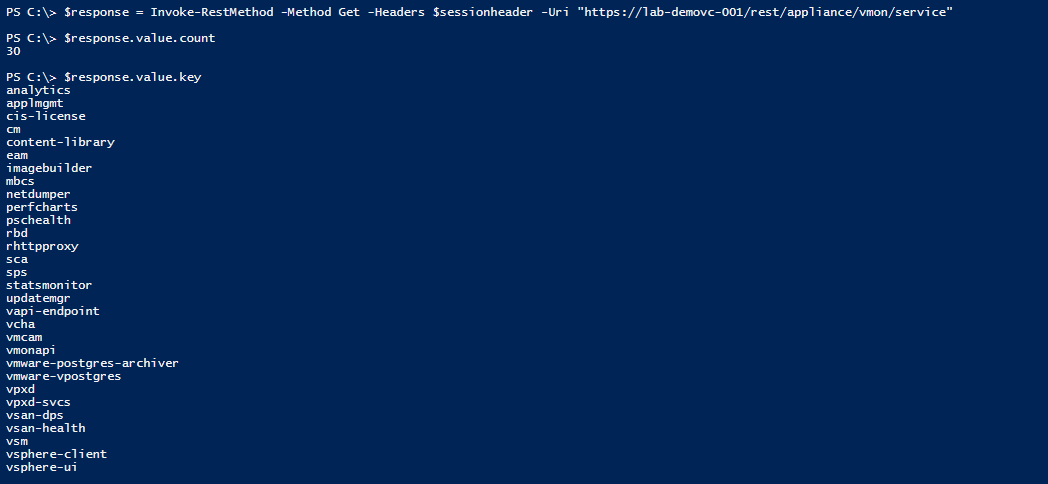
Services
The API outputs health and state in text as with the health endpoints.
For state we'll accept the text status, but for health we'll do a numeric mapping as we did previously. I've also experienced that services that are not started is missing the health value. There might be a good reason for this, but in this case I want to set an unhealthy status of a stopped service that should be started. As measurement names I'm prefixing the service name with "vcservice_"
foreach($stat in $response.value){

    $name = $stat.key
    $state = $stat.value.state

    if($stat.value.health){
        $health = $stat.value.health
    }
    elseif($stat.value.startup_type -eq "AUTOMATIC" -and $stat.value.state -ne "STARTED"){
        $health = "DEGRADED"
    }
    else{
        $health = "N/A"
    }

    switch($health){
        "HEALTHY" {$val = 0}
        "HEALTHY_WITH_WARNINGS" {$val = 1}
        "DEGRADED" {$val = 2}
        default {$val = 9}
    }
    $measurementName = "vcservice_" + $name
    $tbl += "$measurementName,server=$vcenter health=""$health"",state=""$state"",value=$val $timestamp"

}
Before pulling in our services to the dashboard we'll add in the utilization metrics.
Utilization
The VAMI monitor page is split into four parts, CPU/Memory, Disks, Network and Database. We will grab these stats (minus the network for now) and create some graphs on these
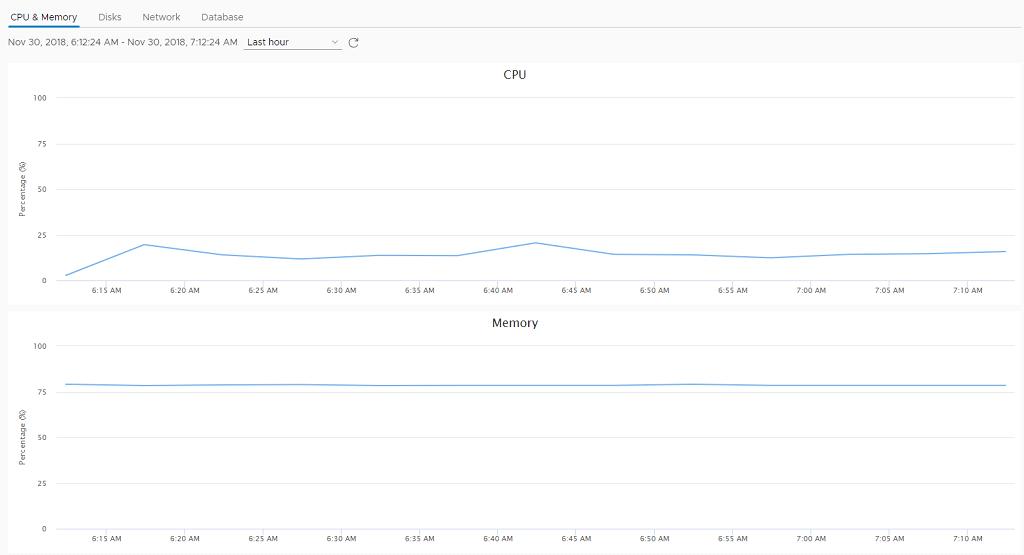
VAMI Utilization
I've split these queries into two parts. I have one script querying for cpu and memory utilization (I would put the networking in here as well), and one that queries storage. Storage stats are queried less frequently.
For both it will be the /rest/appliance/monitoring/query that we'll use.
Note that there are some differences between 6.5 and 6.7 when it comes to the available metrics, as well as the naming of these (especially storage names). I will focus on the 6.7 U1 ones here. To check which metrics are available in your environment you can do a query to /rest/appliance/monitoring without any parameters and you'll get information about all available metrics.
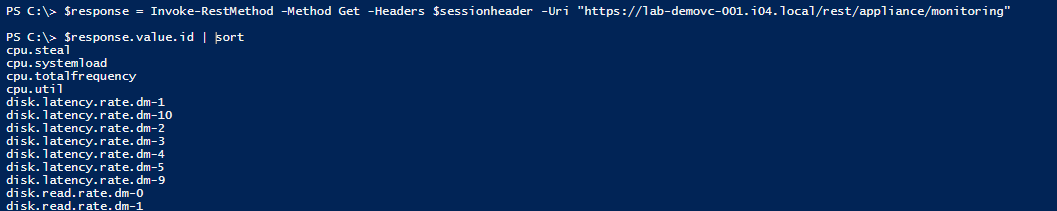
Available metrics
The monitoring query needs a few parameters, both start and endtime as well as the interval and the function. The function is either COUNT, MIN, MAX, AVG or SUM. Lastly you need to add in the metric(s) you want. You can give more metrics in the same query, the syntax is item.names.count=metric. For cpu and mem this would be, item.names.1=cpu.util&item.names.2=mem.util.
To add the metrics I will create a string with all the metrics wanted which later on will be added to the request uri:
$metrics = @(
    "cpu.util"
    "mem.usage"
)

$count = 1
$string = ""
foreach($met in $metrics){
    $string += "&item.names.$count=$met"
    $count++
}

$uri = $BaseUri + "appliance/monitoring/query?item.interval=MINUTES5&item.function=MAX&item.start_time=$startTime&item.end_time=$endTime$string"
The CPU/Mem script will grab the 5 minute interval and in my script it will output two values (this depends on how long period you request data from), we will grab both and write them to the database. Even if it would have been written before Influx will just overwrite the first one so you'll only end up with one record per timestamp. Again note that I'm using my own measurement names, you could also just use the metric names from the API:
foreach($stat in $response.value){

    switch($stat.name){
        "cpu.util" {$measurement = "cpu"  }
        "mem.usage" {$measurement = "mem" }
        default {$measurement = $null}
    }

    if($stat.data[-2]){
        $val1 = $stat.data[-2]
        $time1 = Get-DBTimestamp (get-date $stat.start_time)
        $tbl += "$measurement,server=$vcenter,interval=$($stat.interval),unit=perc value=$val1 $time1"
    }

    if($stat.data[-1]){
        $val2 = $stat.data[-1]
        $time2 = Get-DBTimestamp (get-date $stat.end_time)
        $tbl += "$measurement,server=$vcenter,interval=$($stat.interval),unit=perc value=$val2 $time2"
    }
}
Finally the storage metrics:
$metrics = @(
    "storage.totalsize.filesystem.db"
    "storage.used.filesystem.db"
    "storage.totalsize.filesystem.dblog"
    "storage.used.filesystem.dblog"
    "storage.totalsize.filesystem.log"
    "storage.used.filesystem.log"
    "storage.totalsize.filesystem.root"
    "storage.used.filesystem.root"
    "storage.totalsize.filesystem.seat"
    "storage.used.filesystem.seat"
    "storage.totalsize.filesystem.updatemgr"
    "storage.used.filesystem.updatemgr"
    "storage.totalsize.filesystem.core"
    "storage.used.filesystem.core"
)

...

foreach($stat in $response.value){

    $timestamp = Get-DBTimestamp (get-date $stat.end_time)

    $storageVal = ($stat.data[-1] / 1024)

    switch($stat.name){
        "storage.totalsize.filesystem.db" {$measurement = "storage.db"; $field = "totalsize"}
        "storage.used.filesystem.db" {$measurement = "storage.db"; $field = "used"}
        "storage.totalsize.filesystem.dblog" {$measurement = "storage.dblog"; $field = "totalsize"}
        "storage.used.filesystem.dblog" {$measurement = "storage.dblog"; $field = "used"}
        "storage.totalsize.filesystem.seat" {$measurement = "storage.seat"; $field = "totalsize"}
        "storage.used.filesystem.seat" {$measurement = "storage.seat"; $field = "used"}
        "storage.totalsize.filesystem.core" {$measurement = "storage.core"; $field = "totalsize"}
        "storage.used.filesystem.core" {$measurement = "storage.core"; $field = "used"}
        "storage.totalsize.filesystem.log" {$measurement = "storage.log"; $field = "totalsize"}
        "storage.used.filesystem.log" {$measurement = "storage.log"; $field = "used"}
        "storage.totalsize.filesystem.root" {$measurement = "storage.root"; $field = "totalsize"}
        "storage.used.filesystem.root" {$measurement = "storage.root"; $field = "used"}
        "storage.totalsize.filesystem.updatemgr" {$measurement = "storage.updatemgr"; $field = "totalsize"}
        "storage.used.filesystem.updatemgr" {$measurement = "storage.updatemgr"; $field = "used"}
    }

    $tbl += "$measurement,server=$vcenter,interval=$($stat.interval),unit=MB $field=$storageVal $timestamp"

}
Now we should have a lot of data to create some graphs with
Dashboard
The final dashboard adds in some of the services as well as cpu/mem and storage utilization. I've also thrown in trending utilization on cpu/mem and some of the db storage where I have a longer time period than the other graphs.
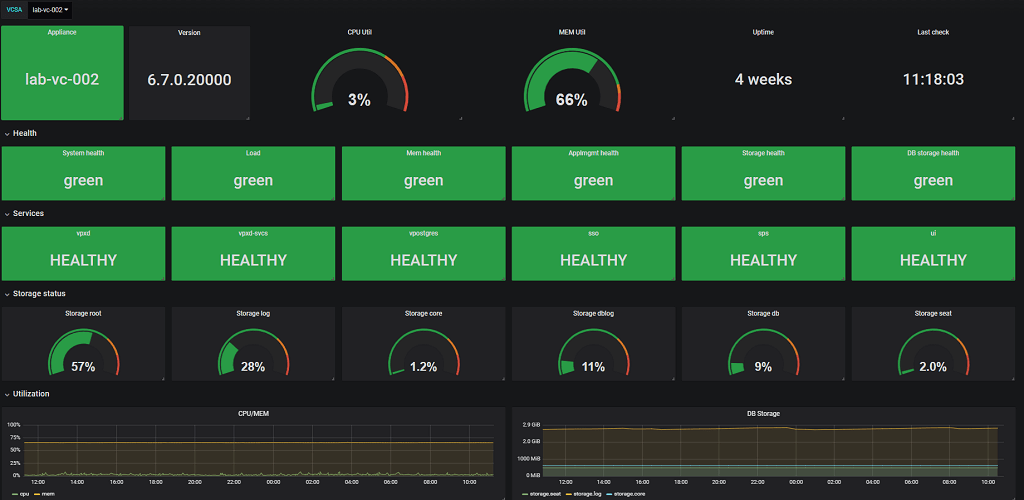
Final dashboard
To verify the status boxes let's stop the vSphere UI service and see if the dashboard picks this up

Stopped service
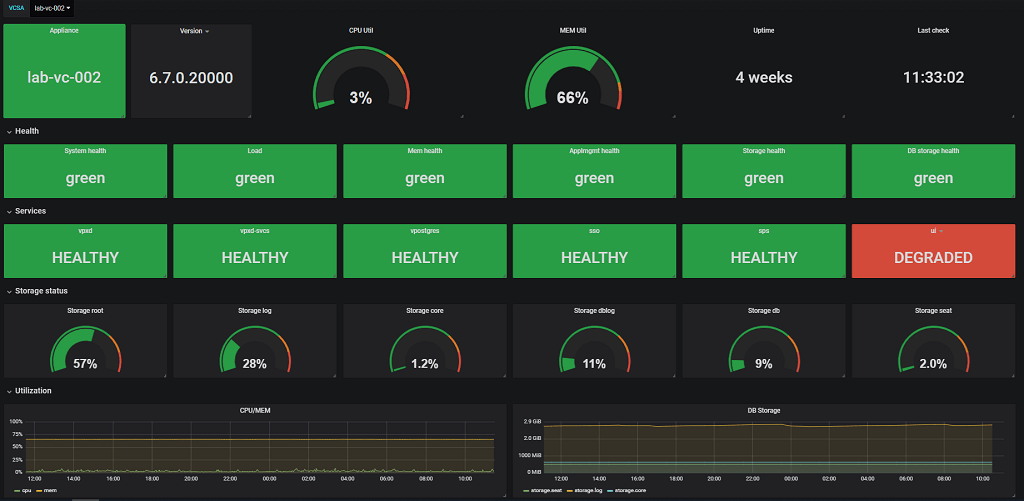
Service degraded
Summary
This (lengthy) post have shown how we can retrieve status and stats from the vCenter Server REST APIs and visualize them. I have not set up any push notifications etc with this data, but there is some functionality for that in Grafana. The various statuses could also easily be sent to other tools as well for alerting purposes.
Even though I have split my queries up in multiple scripts you can easily combine them into fewer, I've done it partly because I want to have different schedules on them and partly as a natural split on types of stats/metrics.
The scripts and the final dashboard is available for download on GitHub. To get this running in your environment you need a InfluxDb instance and a Grafana server, check my blog series for information on how I've set up our environment. You'll need to update the scripts with details corresponding to your environment, and in Grafana you need to create a datasource that is connected to the named database in Influx. When importing the dashboard in Grafana (version 5) you will get prompted on what data source the dashboard should use.
Hopefully this has been valuable, feel free to give feedback in the comments or reach out to me on Twitter.
Thanks for reading!