vSphere Performance data - Monitoring VMware vSAN performance
In my blog series on building a solution for monitoring vSphere Performance we have scripts for pulling VM and Host performance. I did some changes to those recently, mainly by adding some more metrics for instance for VDI hosts.
This post will be about how we included our VSAN environments to the performance monitoring. This has gotten a great deal easier after the Get-VSANStat cmdlet came along in recent versions of PowerCLI.
We will build with the same components as before, a PowerCLI script pulling data and pushing it to an InfluxDB time-series database and finally visualizing it in some Grafana dashboards.
This post won't discuss much details about the different VSAN metrics. There are lots of articles out there which does that.
When you explore VSAN metrics through PowerCLI you'll find that it doesn't neccessarily correspond to what you can get from the graphs in the vSphere client UI. William Lam has written a great blog post about it which I encourage you to read. There's also a GitHub repo with the mappings and sample scripts.
In short there are two cmdlets we will use, Get-VsanStat and Get-VsanSpaceUsage
The metrics
In VSAN there's a lot of metrics available on many levels. You'll have the Cluster, VirtualDisk, VMHost, VirtualMachine, VsanDisk, VsanDiskGroup, VsanIscsiLun and VsanIscsiTarget entities which all have their metrics. In our solution we decided to start out with only the Cluster and DiskGroup level.
What you'll also notice when dealing with these metrics is that there's also some different Metric Types. For instance the Cluster entity has both Backend and VM Consumption metric types. Again, for more details and reference head over to Mr Lam's article referenced above.
The metrics we found interesting and what we wanted to pull was:
Cluster
- VMConsumption.ReadThroughput
- VMConsumption.AverageReadLatency
- VMConsumption.WriteThroughput
- VMConsumption.AverageWriteLatency
- VMConsumption.Congestion
- VMConsumption.OutstandingIO
- VMConsumption.ReadIops
- VMConsumption.WriteIops
- Backend.ResyncReadLatency
- Backend.ReadThroughput
- Backend.AverageReadLatency
- Backend.WriteThroughput
- Backend.AverageWriteLatency
- Backend.Congestion
- Backend.OutstandingIO
- Backend.RecoveryWriteIops
- Backend.RecoveryWriteThroughput
- Backend.RecoveryWriteAverageLatency
Diskgroup
- Performance.ReadCacheWriteIops
- Performance.WriteBufferReadIops
- Performance.ReadCacheReadIops
- Performance.WriteBufferWriteIops
- Performance.ReadThroughput
- Performance.WriteThroughput
- Performance.AverageReadLatency
- Performance.AverageWriteLatency
- Performance.ReadCacheReadLatency
- Performance.ReadCacheHitRate
- Performance.WriteBufferFreePercentage
- Performance.WriteBufferWriteLatency
- Performance.Capacity
- Performance.UsedCapacity
For the Cluster we also pull capacity through the Get-VsanSpaceUsage cmdlet
So, off to building out the scripts.
The scripts
We'll build different scripts for Cluster and Diskgroup metrics respectively.
In the case of the Cluster script we decided to think of the VSAN cluster in the same way as one of our Storage Arrays where we are already pulling metrics. This means that we already have some measurements in the InfluxDB which we can reuse.
The scripts are built like the scripts pulling the normal metrics, we take some input parameters like the vCenter, Cluster etc. We've kept the concept of Targets as this is used for measuring the run time of the different scripts. The VSAN targets gets a "VSAN_" prefix to the targetname.
When exploring the retrieval of metrics through PowerCLI I found that if you specify the metric(s) you want to retrieve you won't always get results. And if you get results you might get an error together with the results
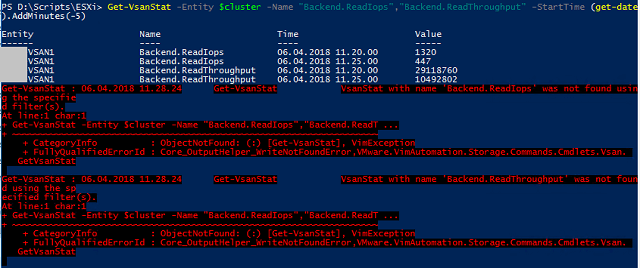
We decided to do the * wildcard and retrieve all metrics to get results and no errors. Of course we might get some metrics we don't need, but we can live with that.
The metrics will be retrieved based on the entity we are working with. For clusters we will work with the cluster entity directly. Notice that we also pull the Disk usage for the cluster.
The Get-VsanStat accepts both a -StartTime and a -EndTime parameter. We'll only use the -StartTime as the -EndTime by default will correspond to "now". Note that we pull only the last 5 minutes of metrics.
$stats = Get-VsanStat -Entity $cluster -Name $metricsVsan -StartTime $lapStart.AddMinutes(-5)
$space = Get-VsanSpaceUsage -Cluster $cluster
foreach($stat in $stats){
    ....
}
For the Diskgroups we will first pull the Diskgroups for the given cluster, before we'll traverse the Diskgroups and retrieve metrics for each Diskgroup. Notice that we'll replace whitespace with an underscore as the InfluxDB API won't allow blanks in tag values.
$diskGroups = Get-VsanDiskGroup -Cluster $cluster

foreach($dg in $diskGroups){
    $stats = Get-VsanStat -Entity $dg -Name * -StartTime $lapStart.AddMinutes(-5)
    #Replace whitespace in the name as the API won't allow it
    $name = $dg.Name.Replace(" ","_")

    ....

    foreach($stat in $stats){
        ....
    }
}
So, with lots of metrics to process we will use the same logic for processing the metrics and building the array that later will be posted to the InfluxDB API.
One thing to notice is that some of the VSAN metrics uses microseconds as a unit while vSphere normally uses milliseconds. We will do a conversion on this so the metrics uses the same unit in our database.
$unit = $stat.Unit
if($unit -eq "Microseconds"){
    $value = $stat.Value / 1000
    $unit = "ms"
}
else{
    $value = $stat.Value
}
For each of the metrics we will, as we do in the vSphere stat scripts, do a switch statement on the metric name to give it our own measurement name, and to specify a different unit if needed. As mentioned we will reuse some of the measurement names as we have for our other Storage arrays. For instance the Frontend (VMConsumption) Readthroughput will get the kB_read measurement name.
switch ($stat.Name) {
    "VMConsumption.ReadThroughput" { $measurement = "kB_read"; $value = ($value / 1024); $unit = "KBps" }
    .... lots of other metrics
}
Finally, after deciding the measurement name and potentially calculating a value and change the unit, we will add the metric in the correct format to the output array. For more information about this format and how it is used check out the blog series mentioned above.
if($measurement -ne $null){
    $newtbl += "$measurement,type=$type,san=$san,sanid=$sanid,platform=$vcenter,platformid=$vcid,location=$location,unit=$unit,statinterval=$statinterval value=$Value $stattimestamp"
}
For the cluster script we do also track the capacity/disk usage and add that to the array. Notice that in this case we have only one measurement, vsan_diskusage, and then we add the different values as fields.
if($space){
    $newtbl += "vsan_diskusage,type=$type,san=$san,sanid=$sanid,platform=$vcenter,platformid=$vcid,location=$location,unit=GB,statinterval=$statinterval freespace=$([int]$space.freespacegb),capacity=$([int]$space.CapacityGB),primaryvmdata=$([int]$space.PrimaryVMDataGB),vdiskusage=$([int]$space.VirtualDiskUsageGB),vsanoverhead=$([int]$space.VsanOverheadGB),vmhomeusage=$([int]$space.VMHomeUsageGB) $stattimestamp"
}
After processing all metrics and the disk usage (for the cluster) we will use Invoke-Restmethod and post the array to the InfluxDB API. Check out my post on doing this for the vSphere metrics for more details on that.
The scripts are run as scheduled tasks every 5 minutes. The full scripts are found over on GitHub.
The Dashboards
So, now we pull the VSAN metrics from vCenter and put it in our InfluxDB database. Now we will use Grafana to build some dashboards for VSAN. Check out my previous post on Grafana dashboards for details on how you build dashboards and the different components. Note that all dashboards have been built on Grafana v4 and the row based grid. In v5 you can get more creative with a more fluid design.
We have built four different dashboards for our VSAN environment. Three for the cluster entity and one for Diskgroups. The three cluster dashboards are split in an Overview dashboard and one for Backend metrics and one for VMConsumption/Frontend metrics.
First our Overview dashboard with some single stats on the top and than some graphs with combined Front- and Backend metrics. Notice that this (and the other Dashboards have links to the other VSAN dashboards for easy navigation).
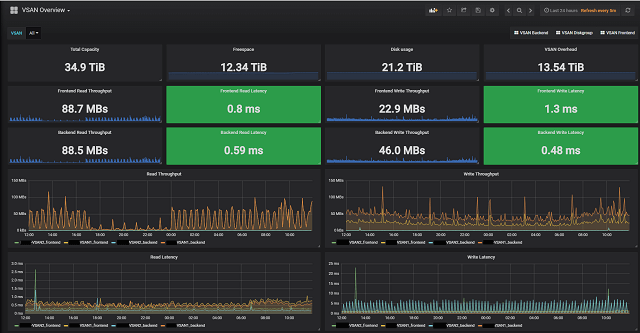
The Front- and Backend dashboards have some additional metrics respectively. Notice that all Cluster dashboards have a VSAN dropdown menu at the top where you can focus on specific clusters.
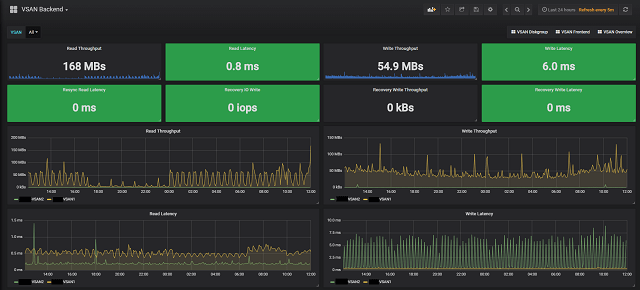
Cluster Backend
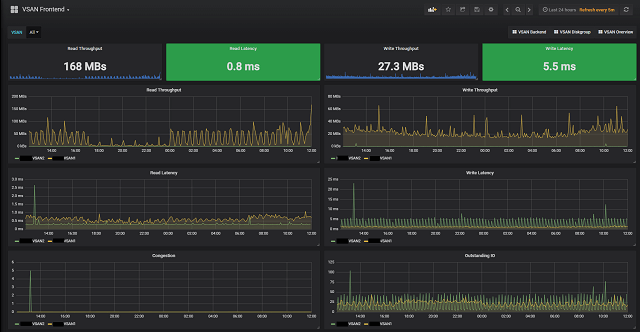
Cluster Frontend
The Diskgroup dashboard focuses obviously on Diskgroups and this dashboard has both Diskgroup and Host as available variables in addition to Vsan cluster. The two extra variables adjusts according to the chosen Cluster.
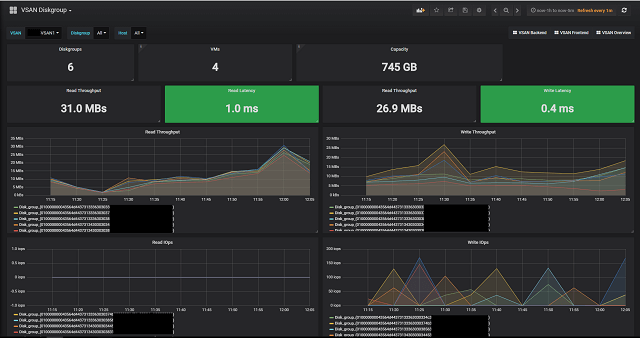
Diskgroup
The dashboards are also available on GitHub.
Summary
Hopefully this post has shown how you can easily build out an existing Influx/Grafana solution with additional metrics, or if you are new to Influx/Grafana it has shown how you can start out monitoring your VSAN environment with open-source tools.
Thanks for reading, Happy monitoring!