vSphere Performance data – Part 8 – Wrap-up and next steps
This is Part 8 and last part (I think...) of my series on vSphere Performance data.
Part 1 discusses the project, Part 2 is about exploring how to retrieve data, Part 3 is about using Get-Stat for the retrieval. Part 4 talked about the database used to store the retrieved data, InfluxDB. Part 5 showed how data is written to the database. Part 6 was about creating dashboards to show off the data. Part 7 added more data to the project. This part will try to wrap up and look at some future steps.
When I started my project I did it with a clear picture on how and what software I would use. Therefore I didn't look around much for if and how others had done it. After a while I did find that (of course) several others have done similar projects with vSphere performance data, InfluxDB and Grafana.
A couple of examples include:
These include a lot of the same stuff I've explained, but some of the examples from Influx and Grafana might not work as they have changed a bit since these posts have been published.
After a couple of months with polling and pushing performance data from vSphere to InfluxDB we are starting to see some real value, both in troubleshooting specific VMs and when looking at trends and patterns across many clusters, hosts and VMs. As I've mentioned before the data has been available to us earlier, but not with this granularity over time and it has not been this easy to see the "whole picture".
Next steps..
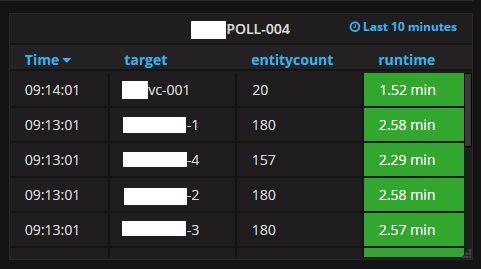
One thing I haven't done which I wanted too was to build a solution to administer the different components in this project. When we created a Grafana dashboard with stats from the different pollers I didn't see the big need for such a solution just yet. With that dashboard we can easily see if the pollers do their job and if we need to split into more jobs.

Polling graph

Polling graph
API
Going forward we will start to use the InfluxDB data in other projects, such as our in-house dashboards. For this we will build an API on top of the InfluxDB database. Influx has it's own API which we use when posting data, but this will also retrieve data from the database.
I've done some work on this already with an InfluxDB .NET client from AdysTech, https://github.com/AdysTech/InfluxDB.Client.Net This client makes it easy connecting to and querying data from the database. The plan is to build a webserver serving API requests to and from the database. We could go directly to InfluxDB but there might be others wanting to poll the same data and with an API in between we can control this.
Polling
We are also going to look into doing the polling differently. I've already begun thinking of using containers for this, that will bring the need for some kind of administration logic to control the pollers, but in the long run we need to have it a bit more intelligent and dynamic than with the current pollers.
Database
Last thing to note is that we haven't really done any tuning on the Influx and Grafana VMs other than giving them an extra CPU (both have 2 at the moment) and some more RAM. We haven't set any retention on the database either so all data are kept. I suspect we will set this at a point as the database is growing rapidly (after two months we are at nearly 30 GB) but at the moment it doesn't seem to be too much for the database.
Lastly I must say that this project has been great fun. It did get somewhat larger, and certainly the individual blog posts got a lot longer than I thought. Besides that it has shown us that with a little effort you can build pretty cool things and get the overview we only have dreamt of before. We could have bought some pricy product that might give us some of this (and maybe save some on the maintenance needed with going open-source), but the real strength here is the ability to combine lots of different sources regardless of what vendor or type of tech/hardware it is (as long as they have a way of pulling the data). Anyways, I hope my blog post series can show some of the capabilities of combining InfluxDB, Grafana and sources of performance data.