Integrating Proxmox VE with InfluxDB and Grafana for monitoring and visualizing metrics
In this post we'll take a look at how to integrate Proxmox VE's metric server with InfluxDB and visualize metrics from Proxmox in Grafana
In the environment used for this blog post we have already an InfluxDB server running. The InfluxDB database is running on version 2.7. Proxmox is upgraded to 8.3 which currently is the latest version.
First step is to prepare the InfluxDB for accepting metrics from Proxmox.
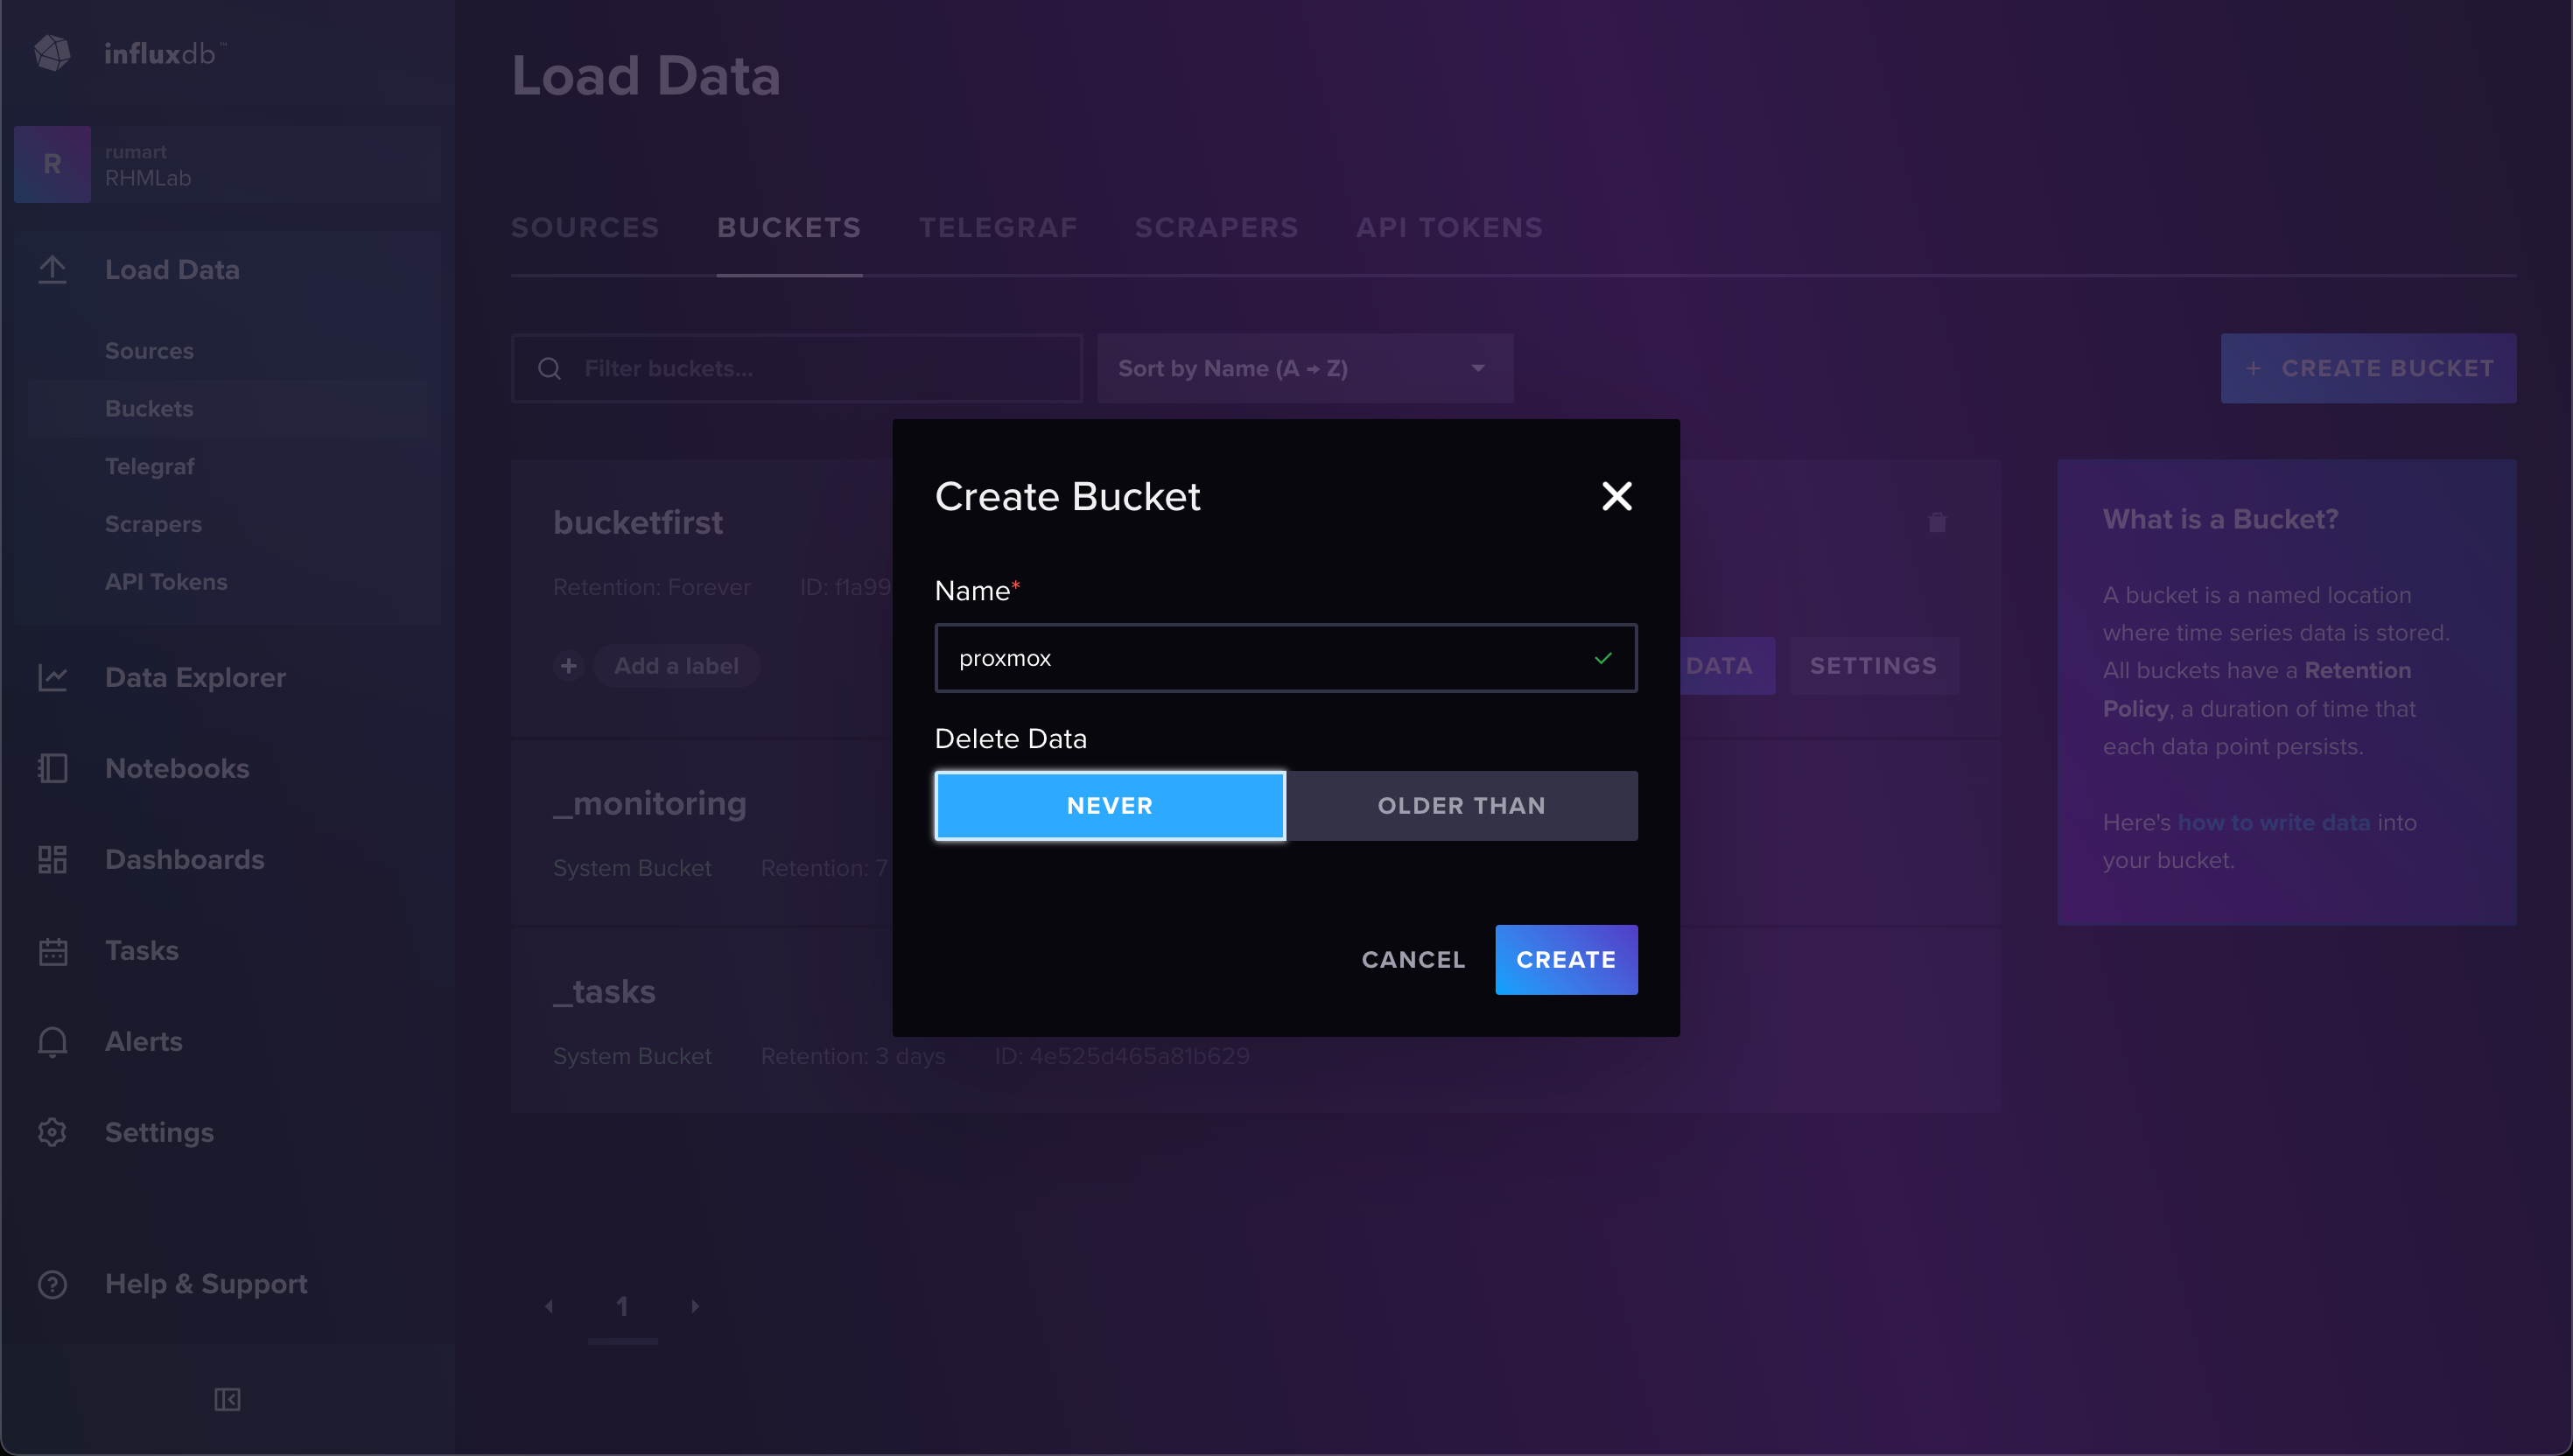
We'll configure a Bucket to store the metrics in. The Proxmox metrics server defaults to Proxmox as the bucket name, but you could override this in the metrics server config
Next we'll create a token with the permissions to write to the bucket
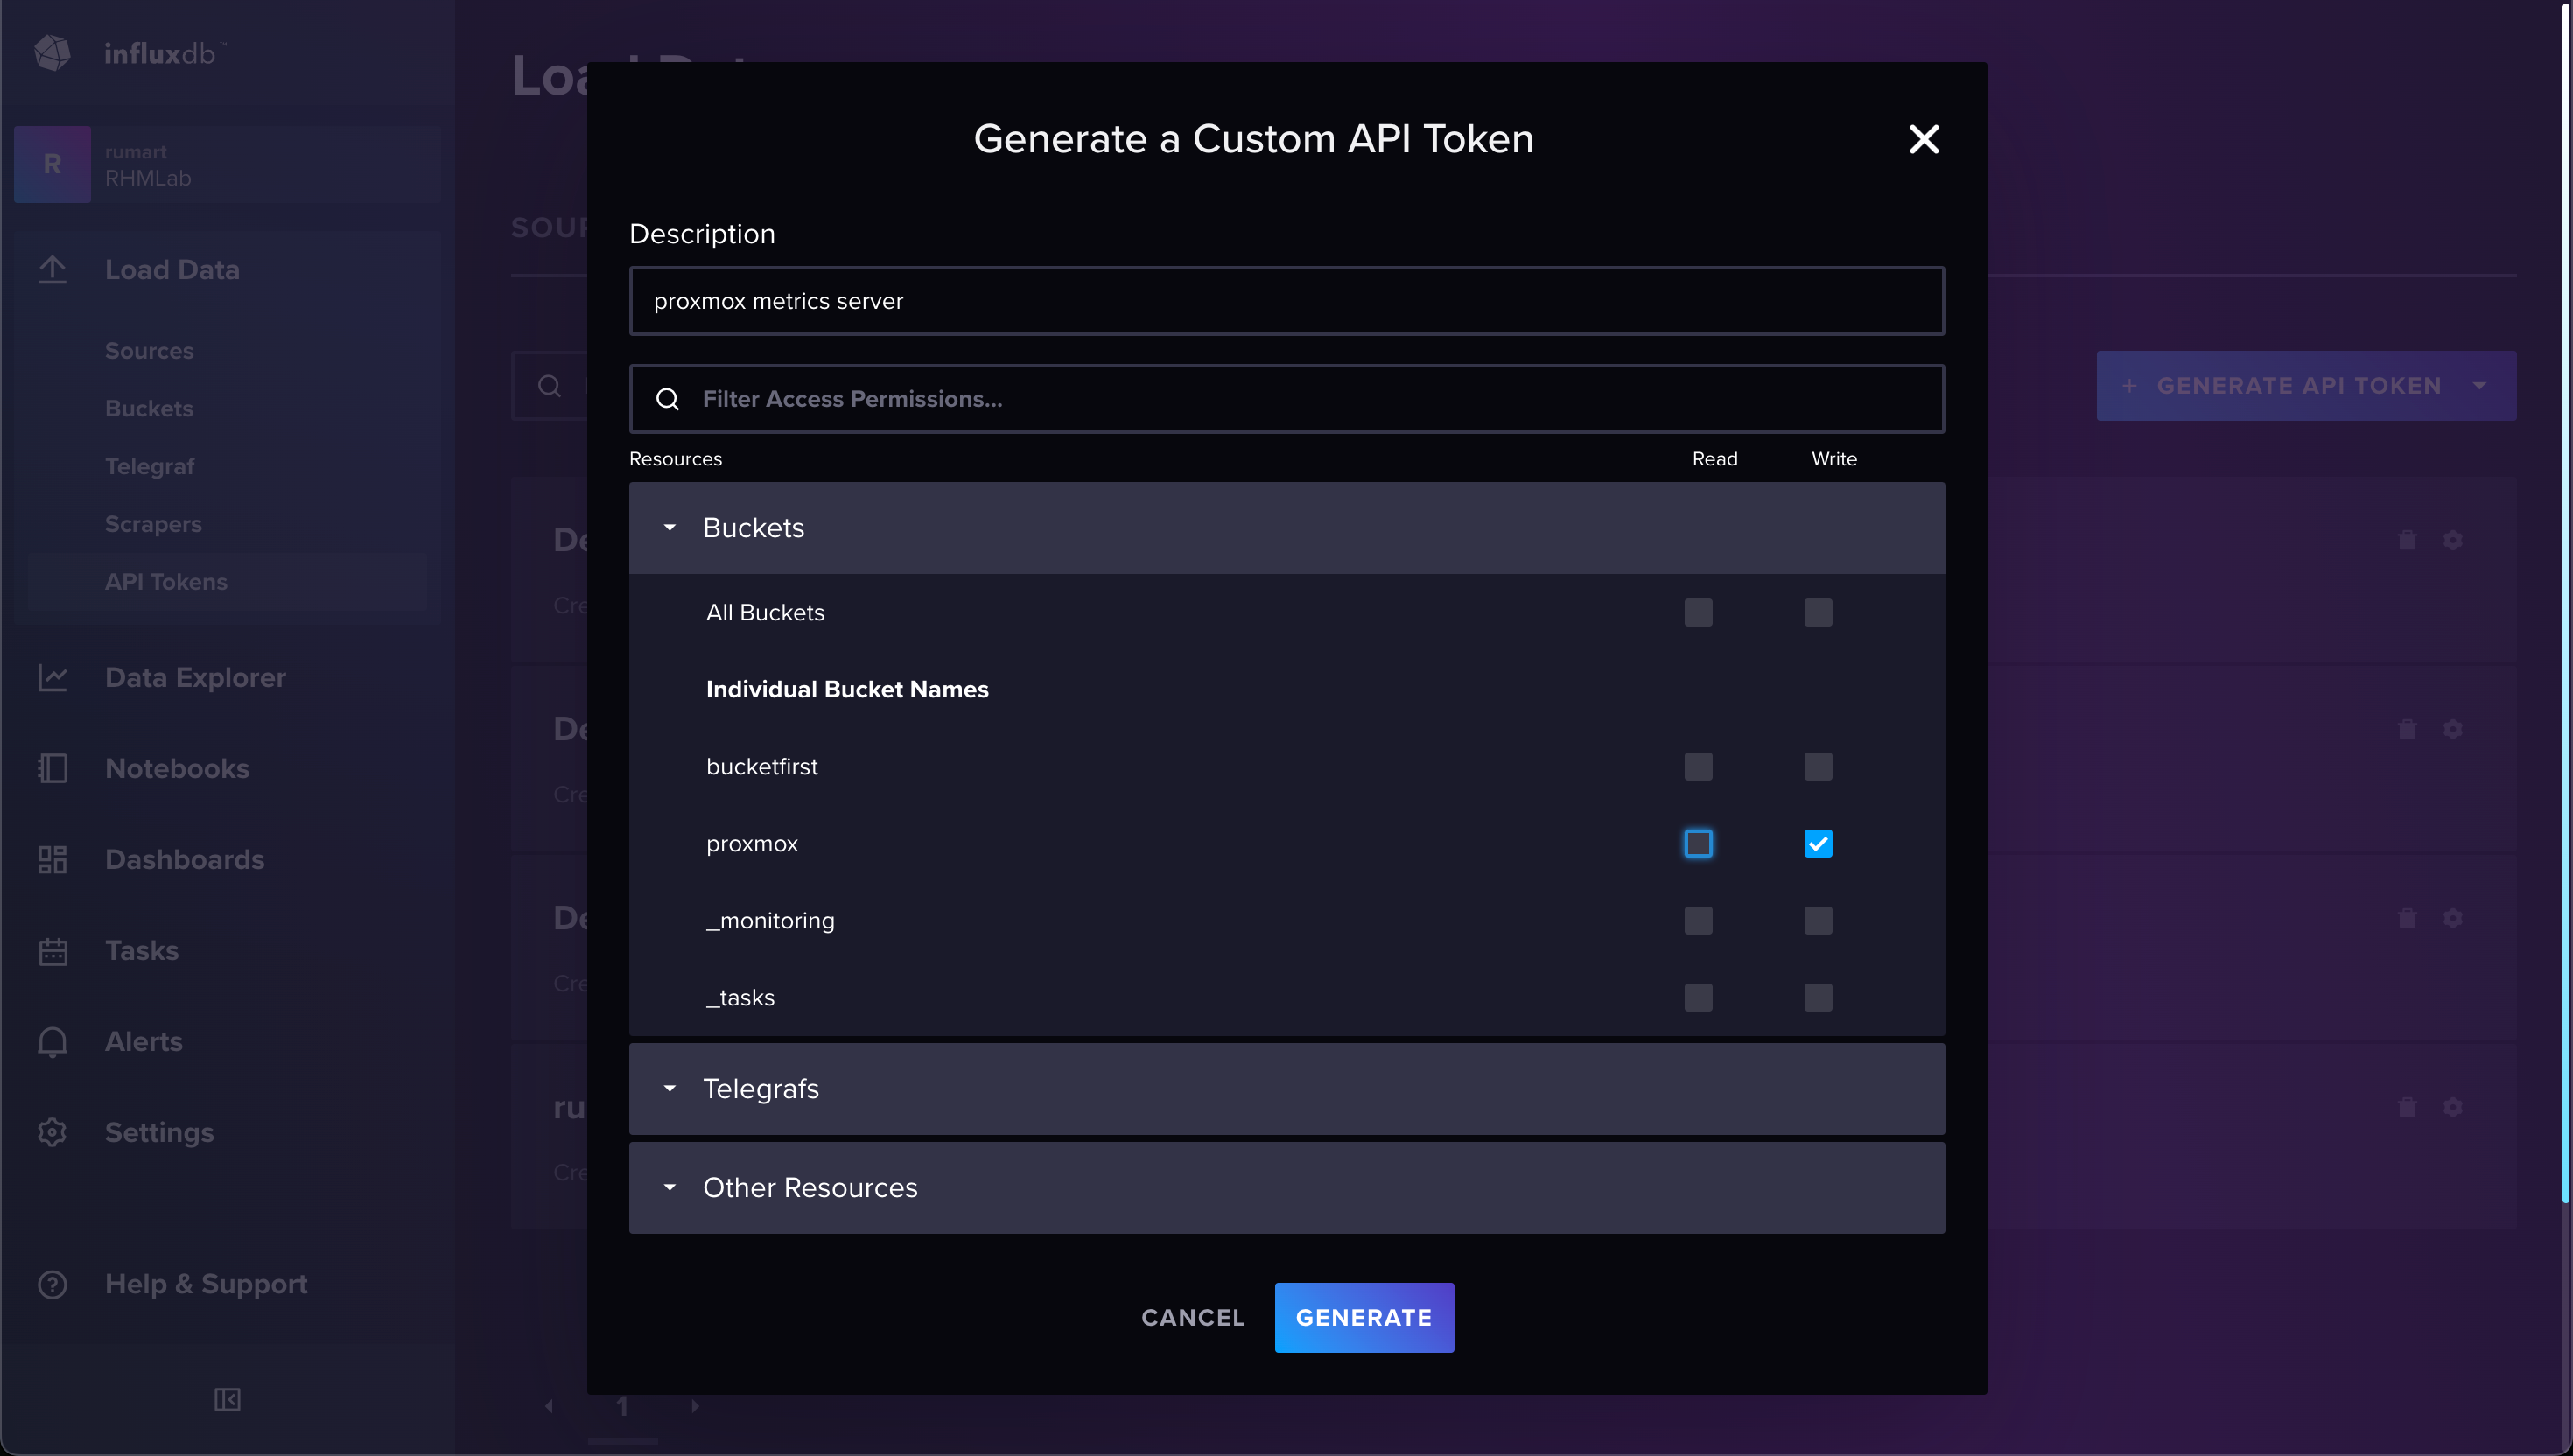
Be sure to copy the token as we'll not be able to retrieve it when closing the modal

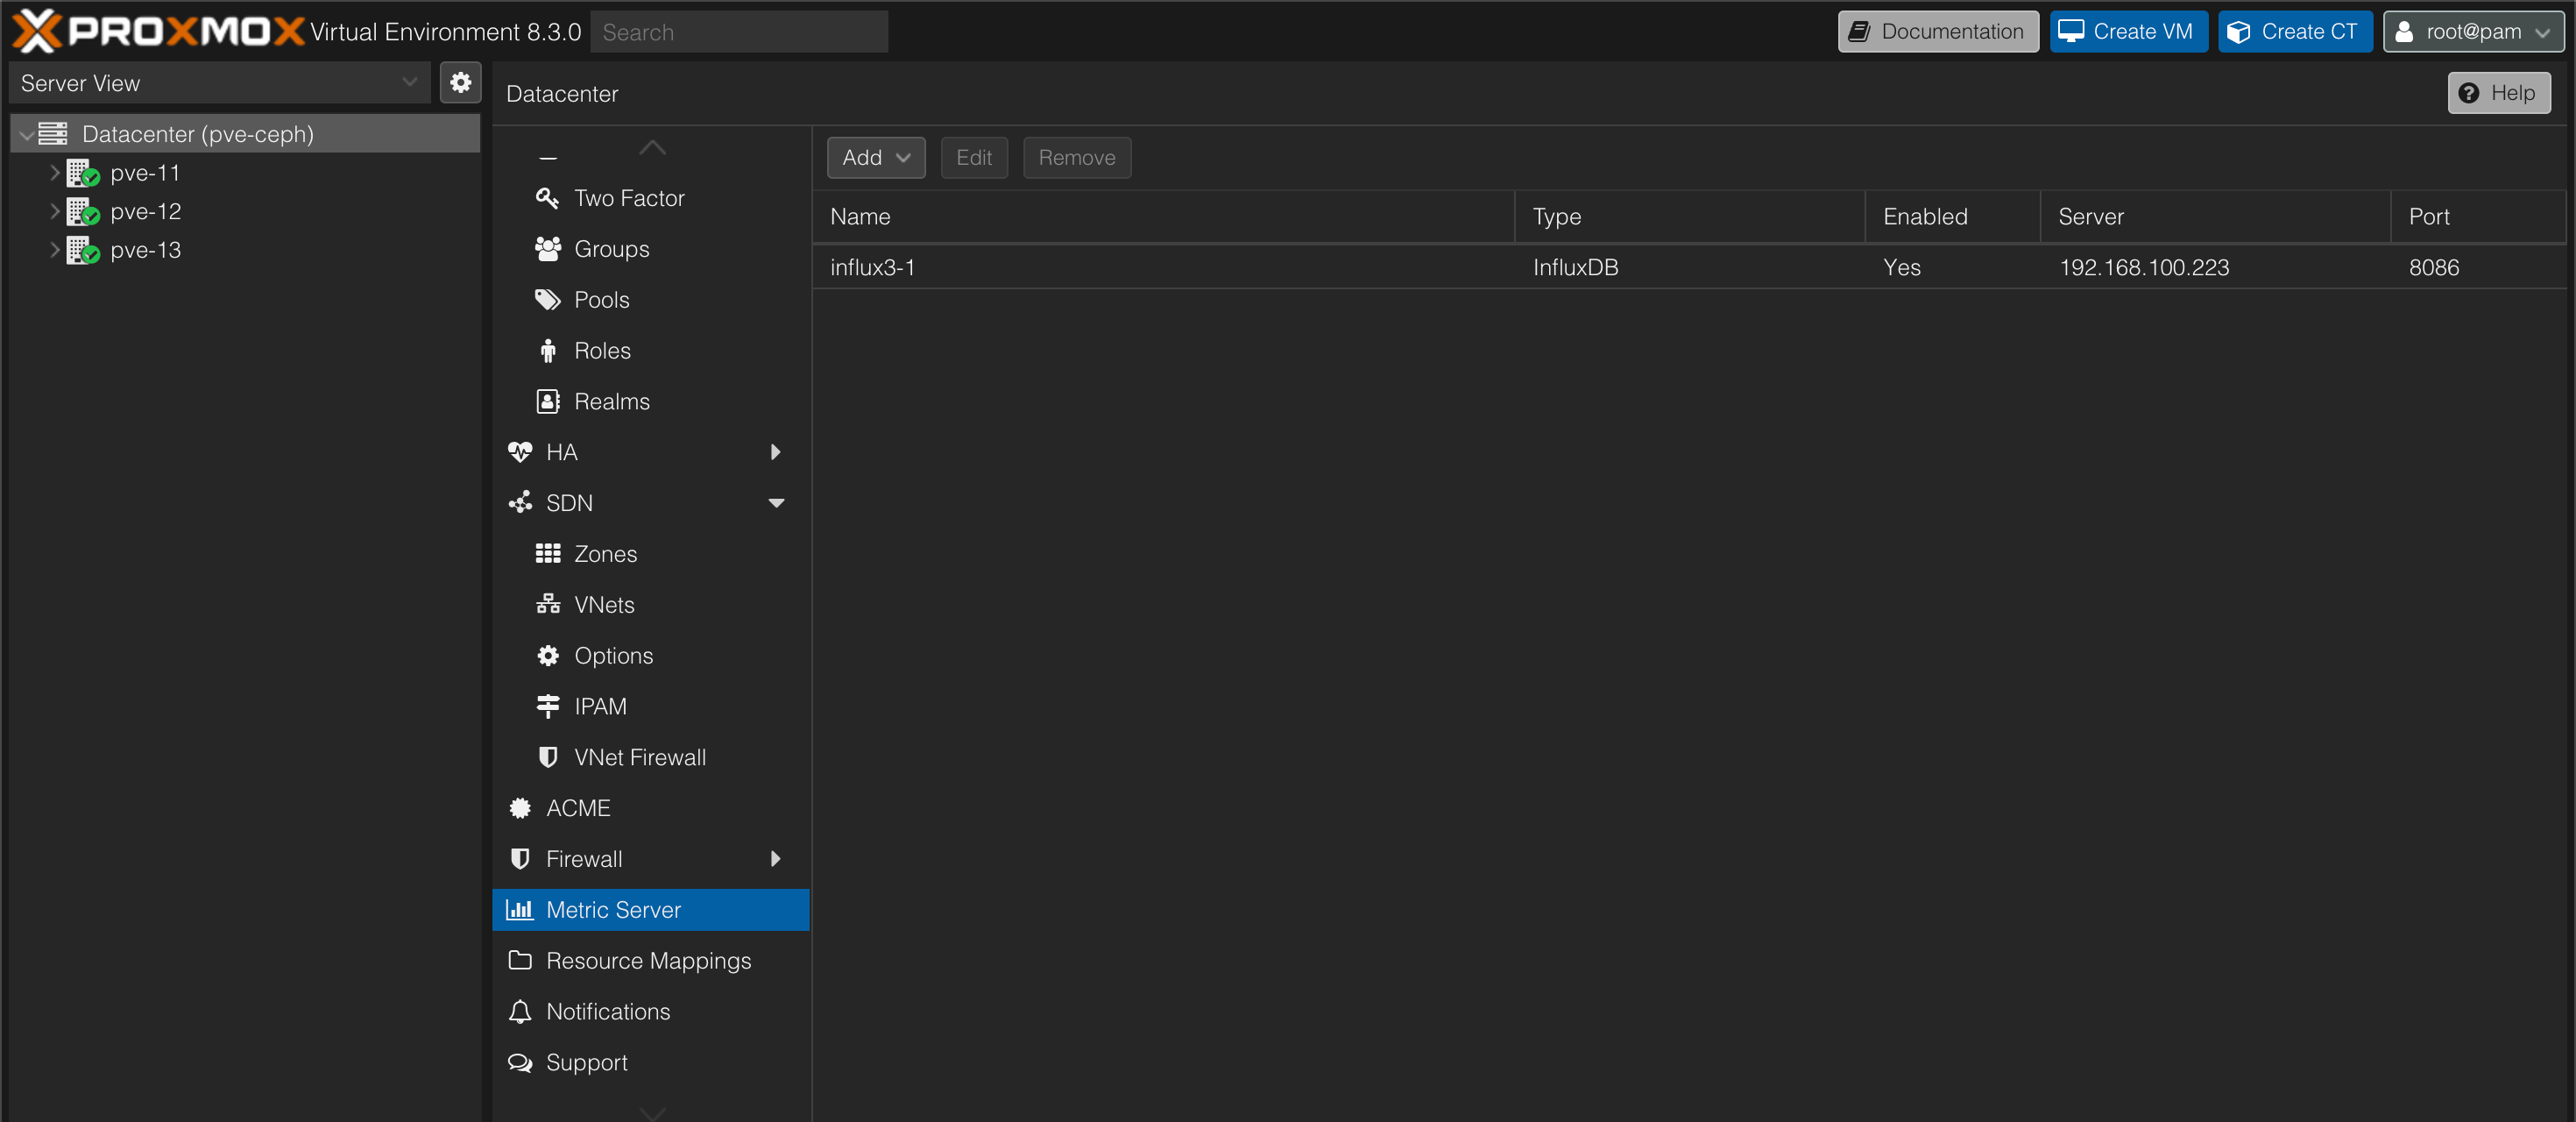
Over in the Proxmox UI we can go ahead and add the Metric Server integration from the Datacenter->Metric Server view
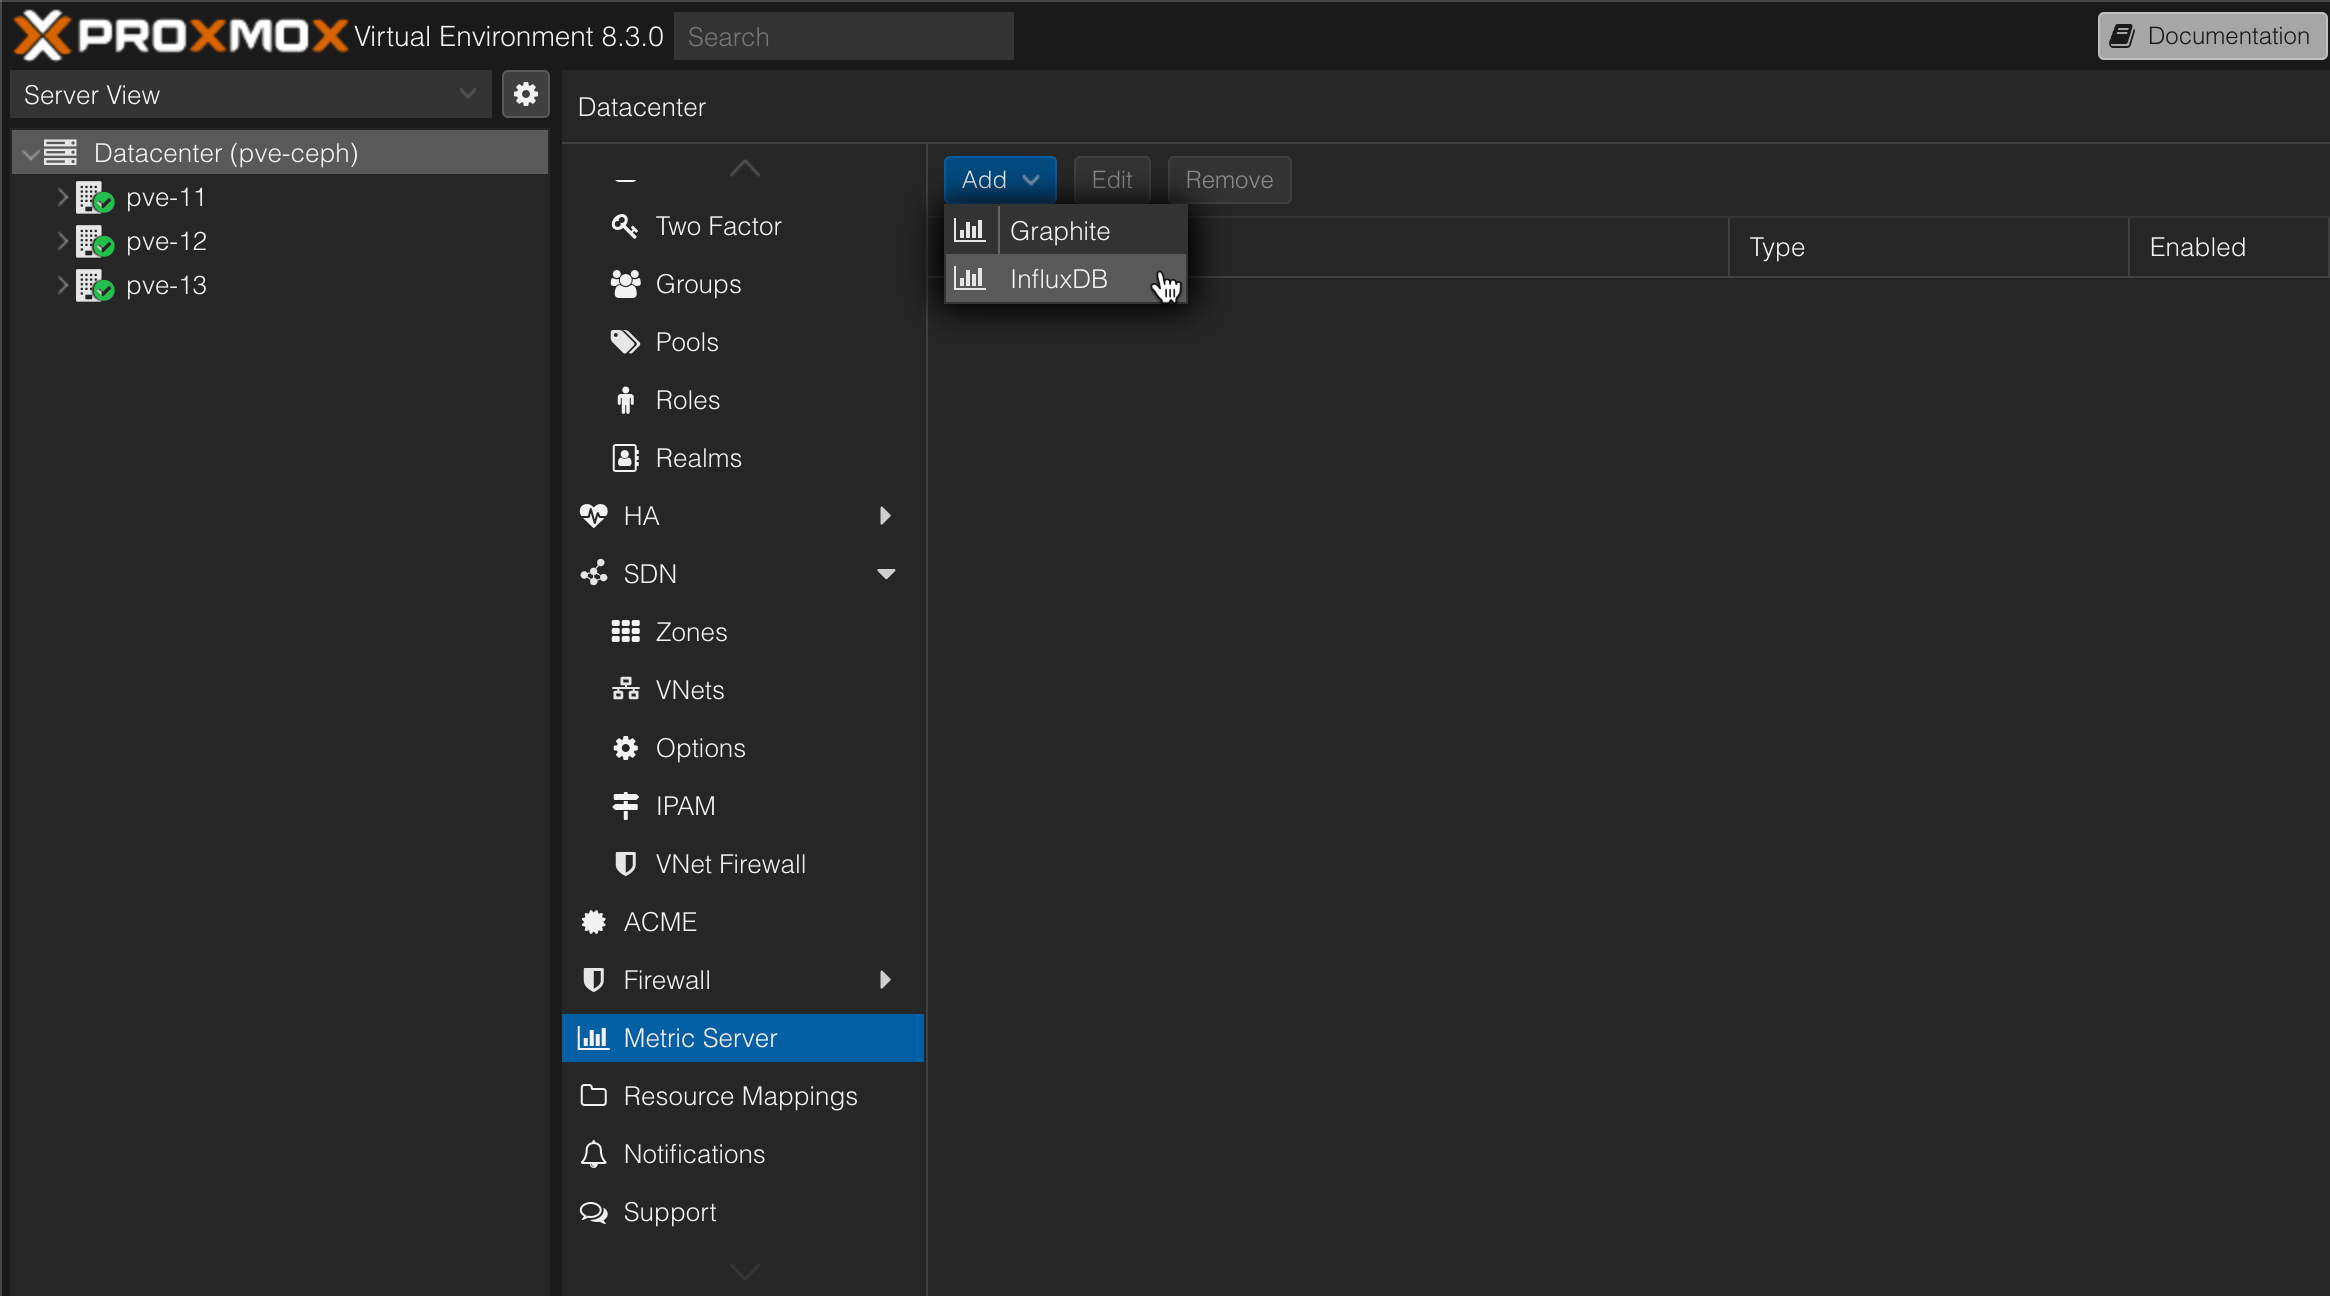
Note that if you select UDP as the protocol you'll not be able to override the defaults for Org and bucket.
We'll specify the details for the integration. Note that we're selecting http as the protocol which lets us override the Org and bucket name. We'll also provide the token generated previously
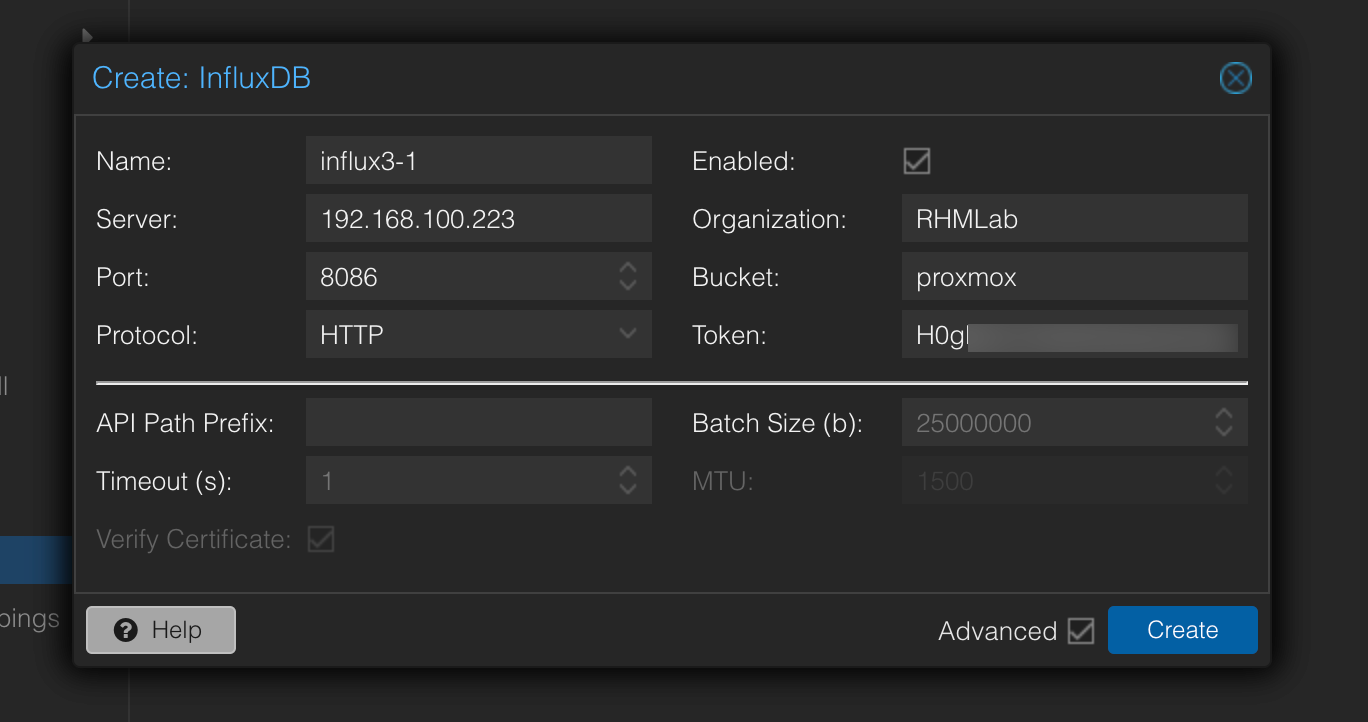
With that in place we should have the Metric server enabled
Let's head back to our Influx server to check out the data. We'll utilize the Data explorer UI
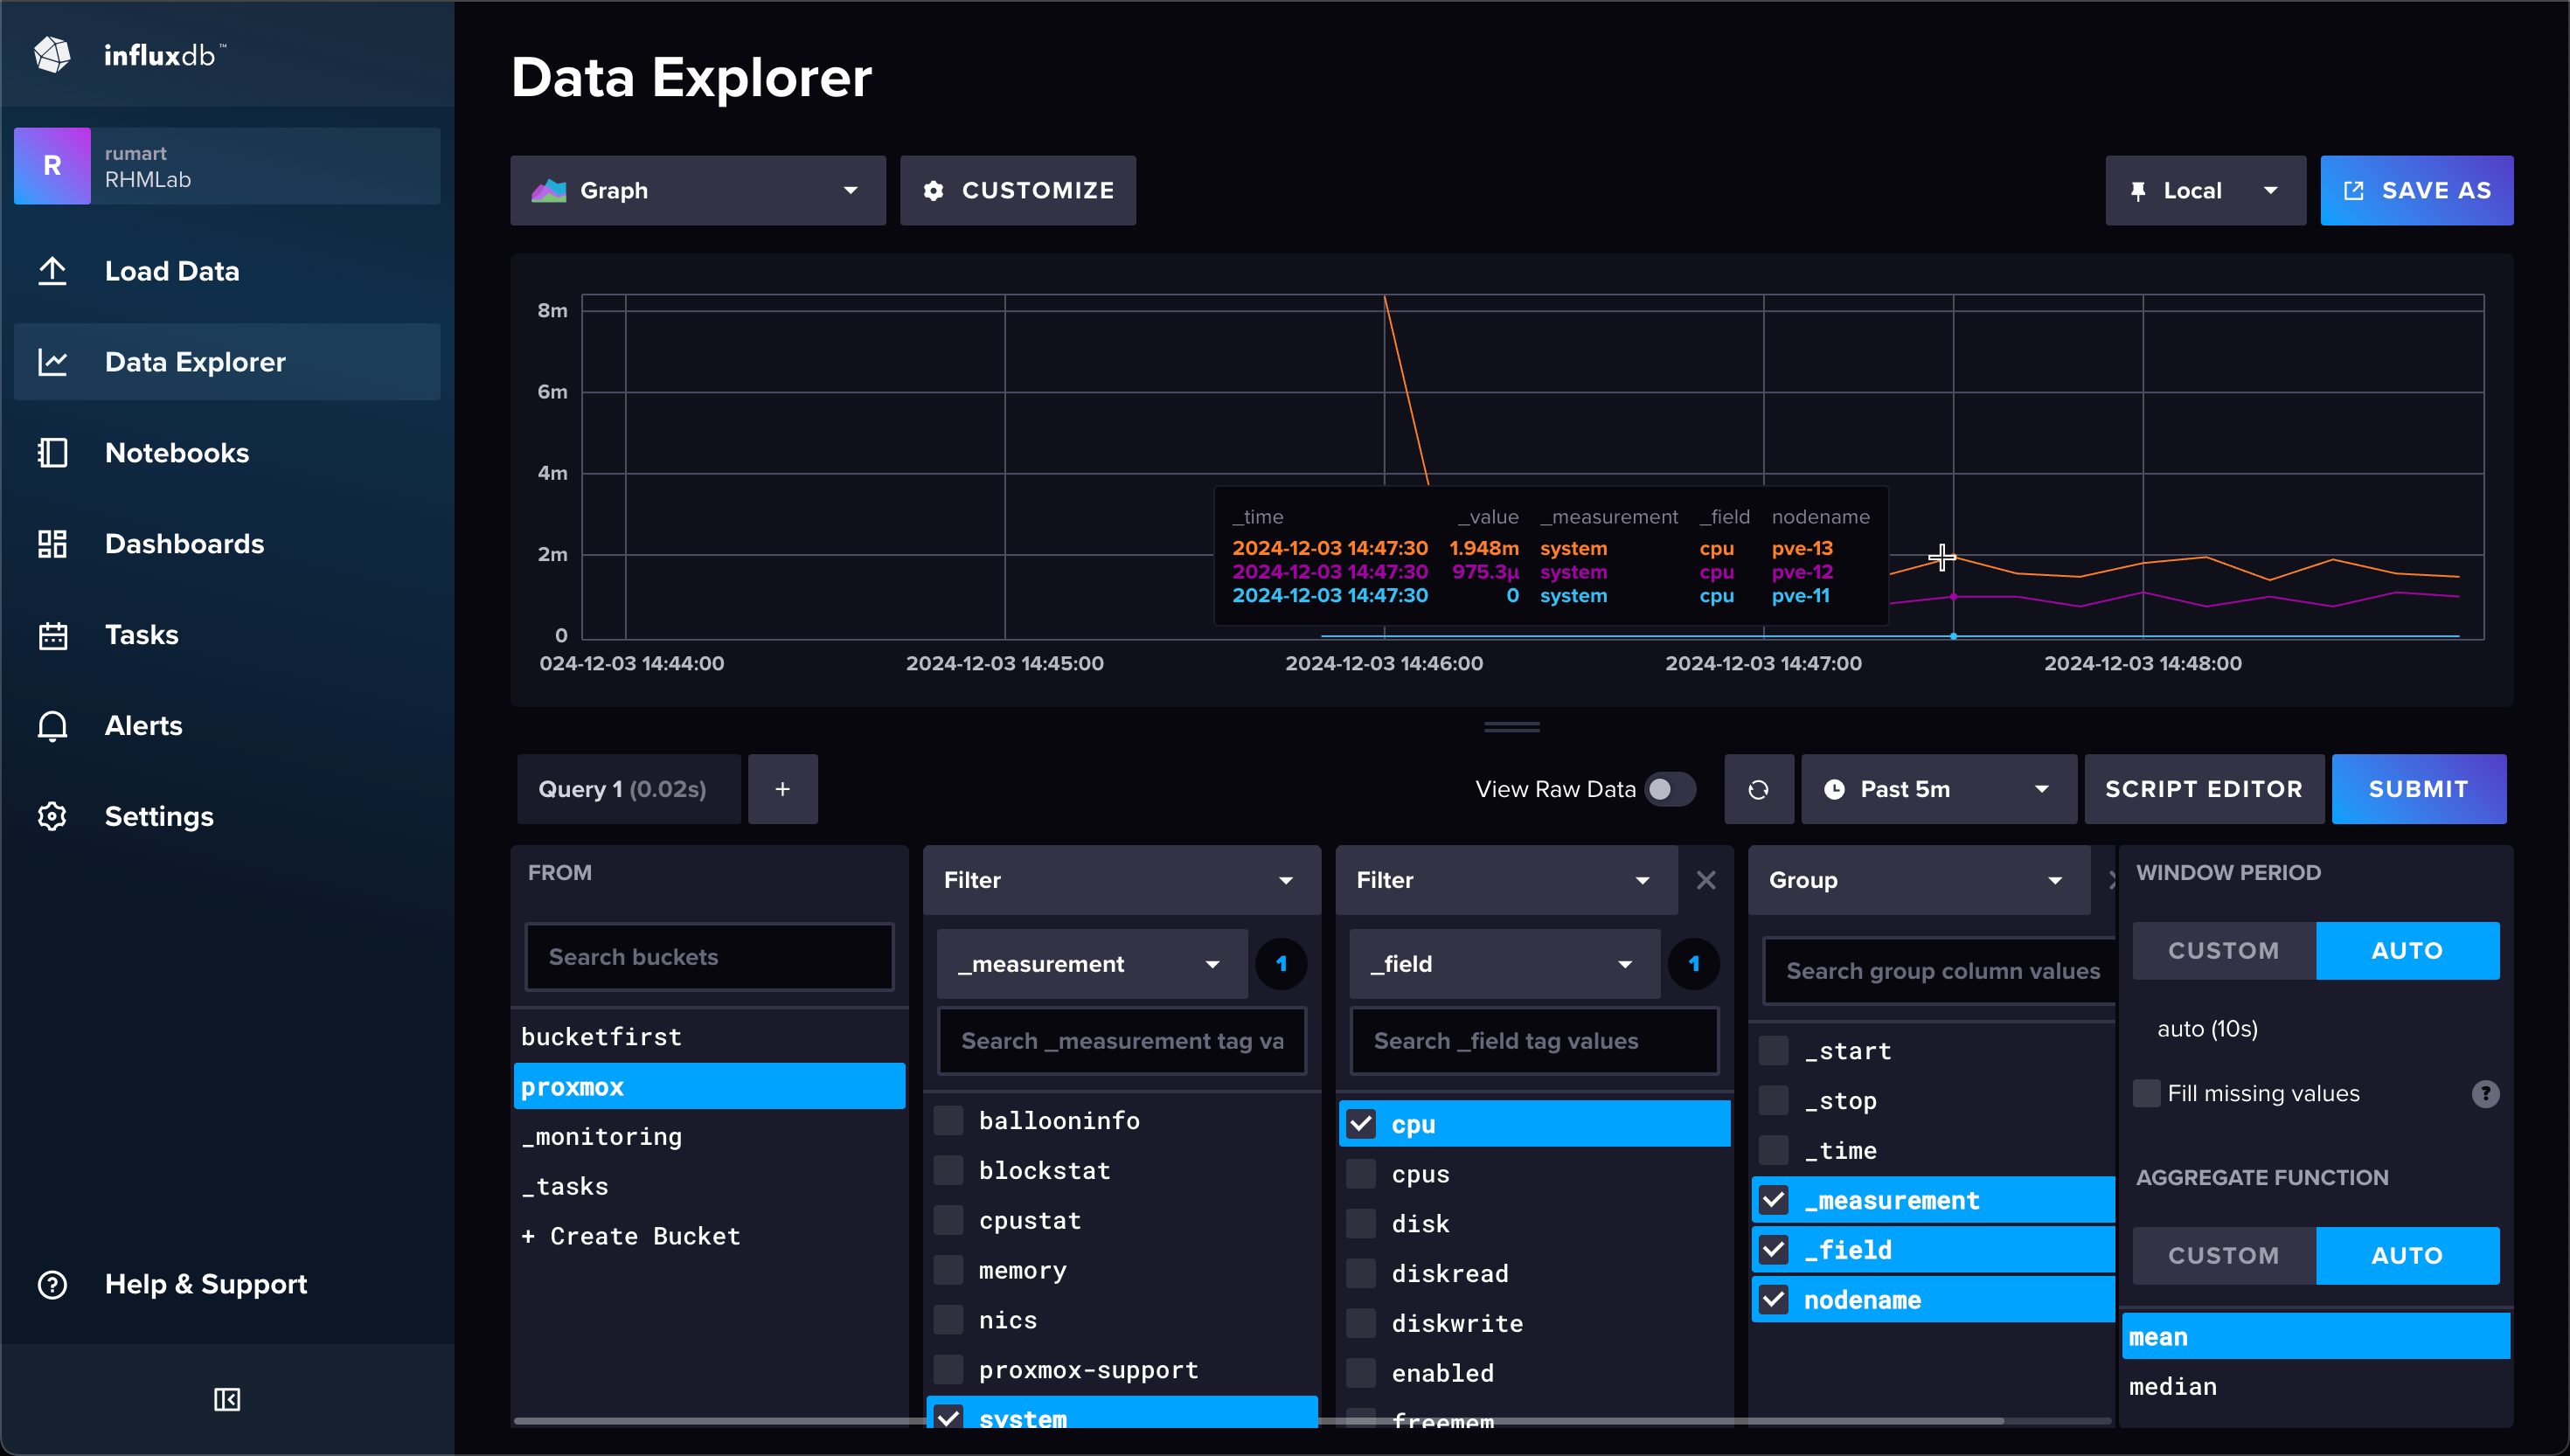
We can see that we have some data available, in this example the CPU utilization for each of the three hosts in the cluster.
Now, whereas the Influx UI has gotten better in recent versions we want to utilize Grafana for our visualizations.
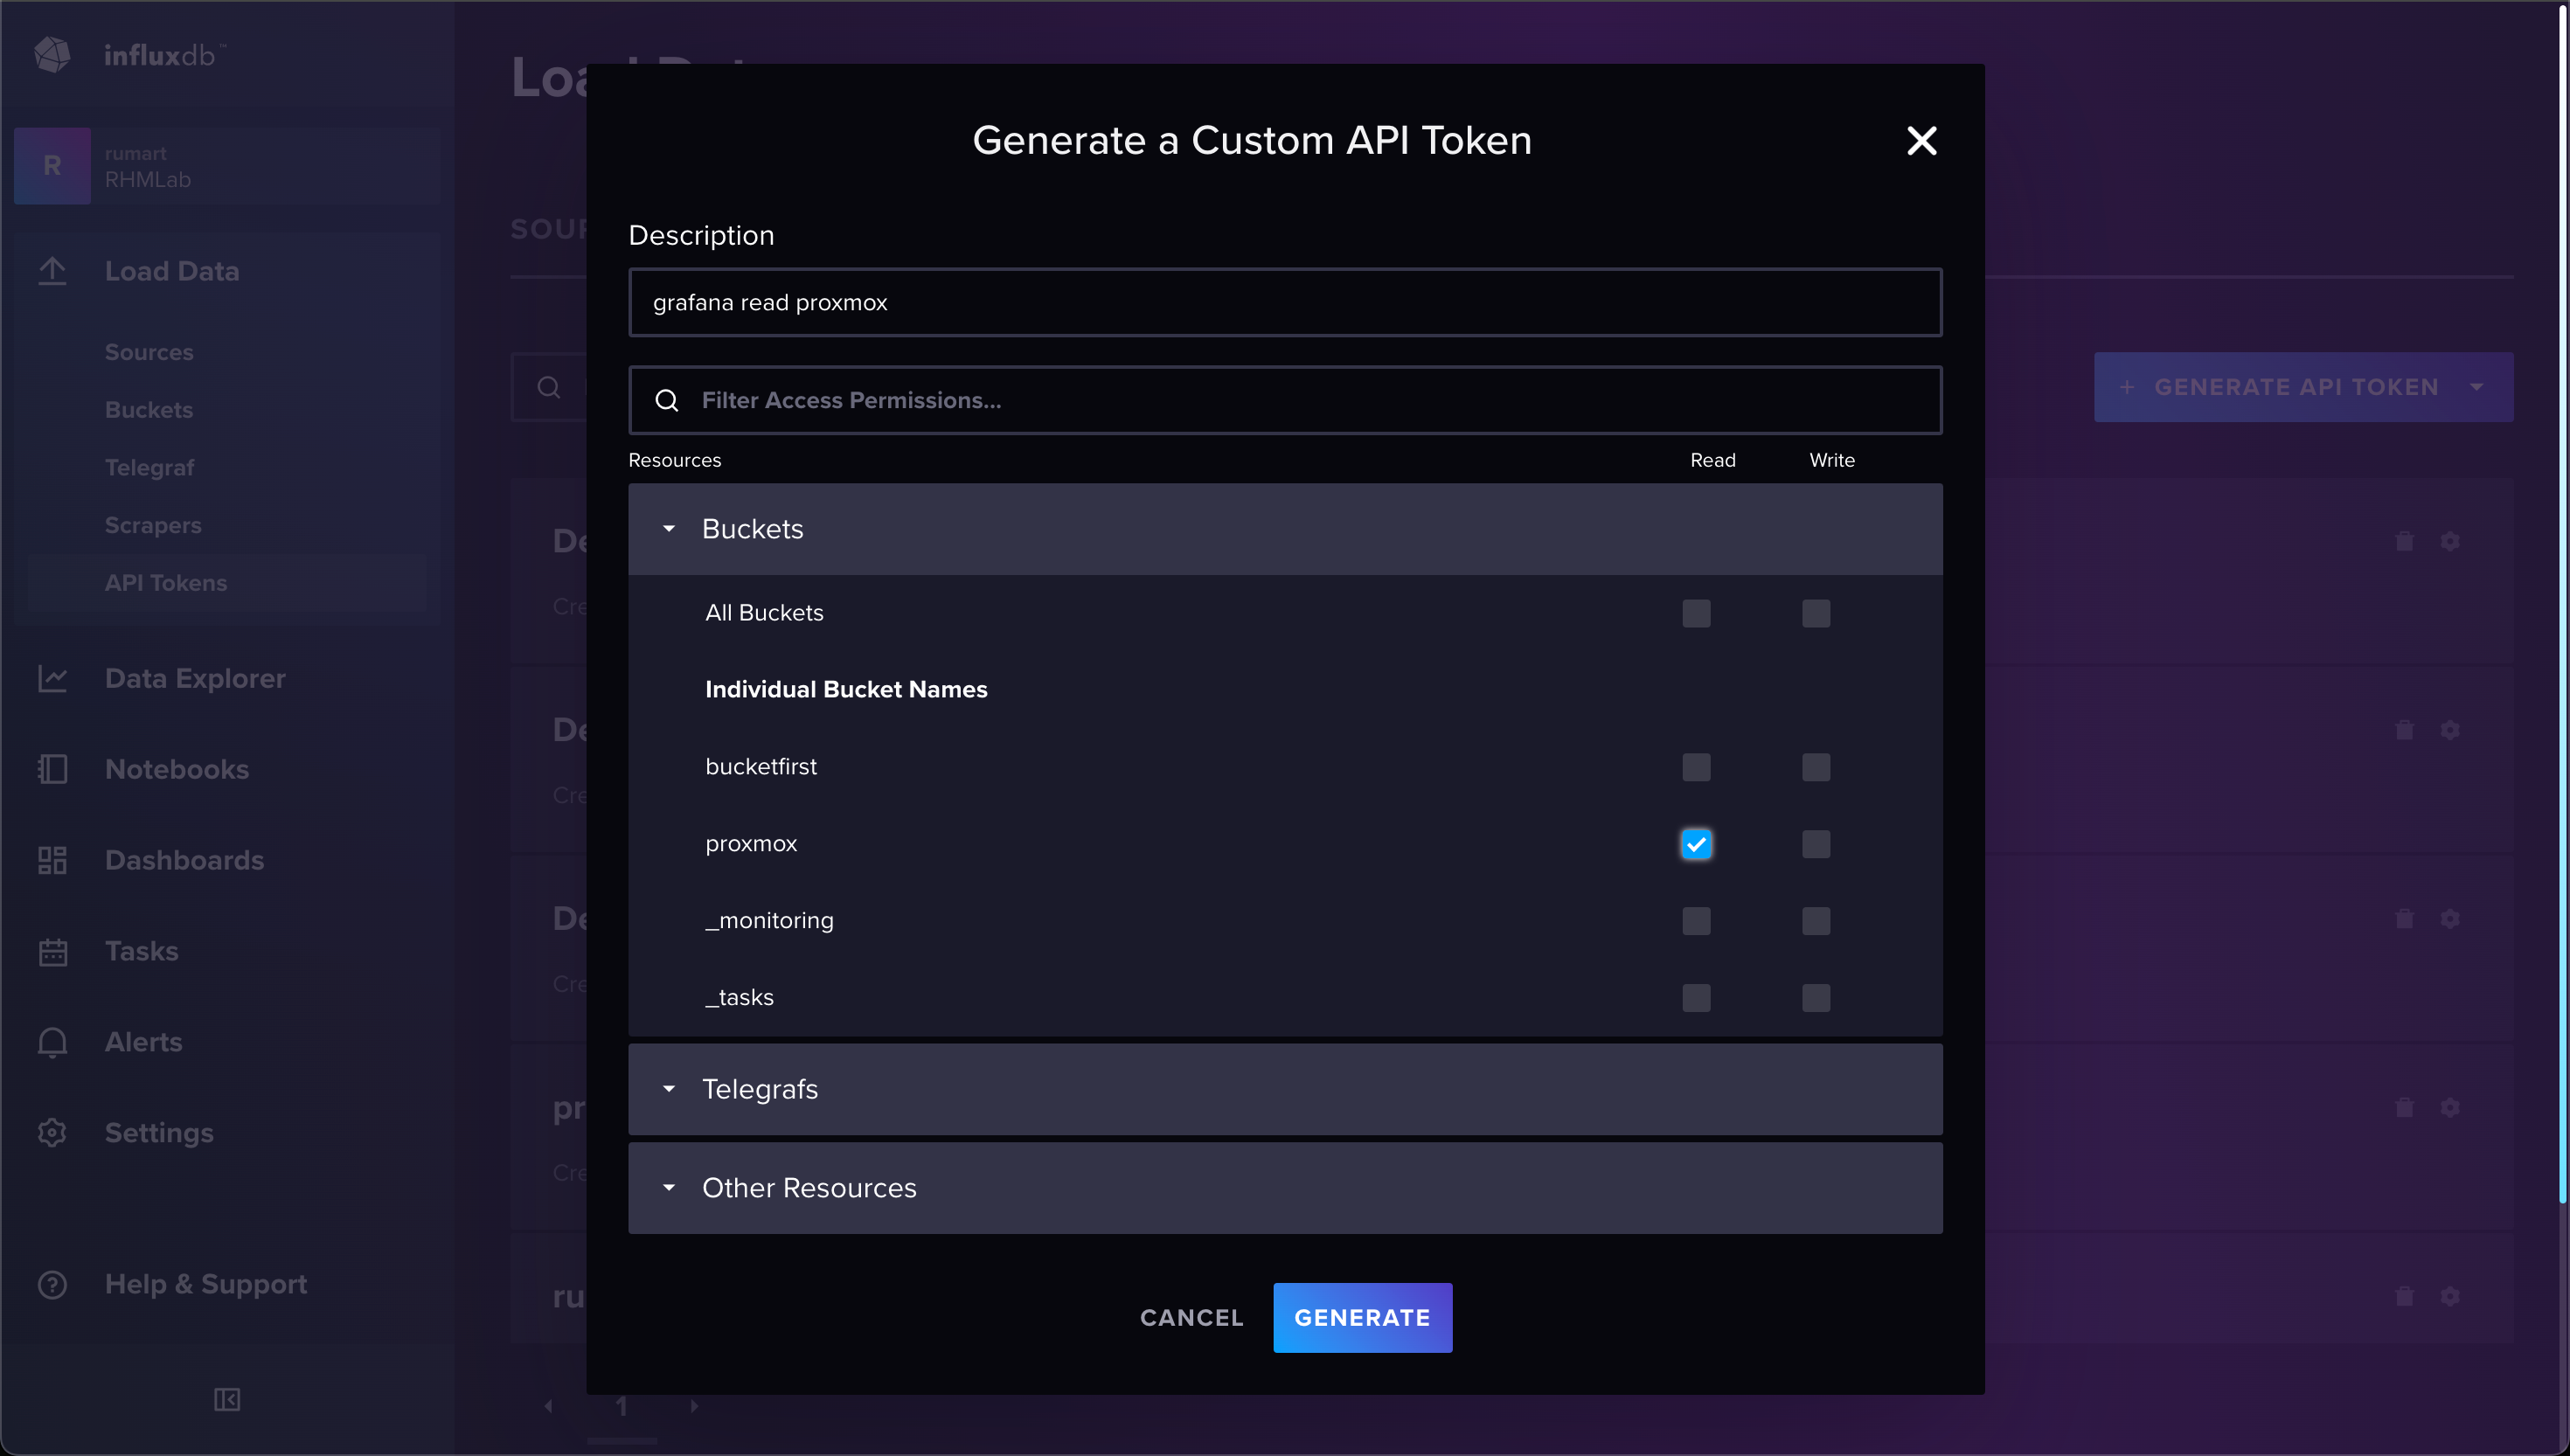
Before connecting Grafana to Influx we'll create a token for reading the proxmox bucket. You might want to handle the connection differently if you have more buckets to visualize in Grafana
Over in our Grafana instance we'll go ahead and create a new Datasource. We'll specify the IP address and port for the InfluxDB server as well as the query language.
Since the Flux query language, which is supported in Influx v1.8 and 2, is going into "maintenance mode" and will eventually go away, I've chosen to base the datasource on InfluxQL which seems to be what InfluxData recommends going forward.
For more information about this read this statement from InfluxData
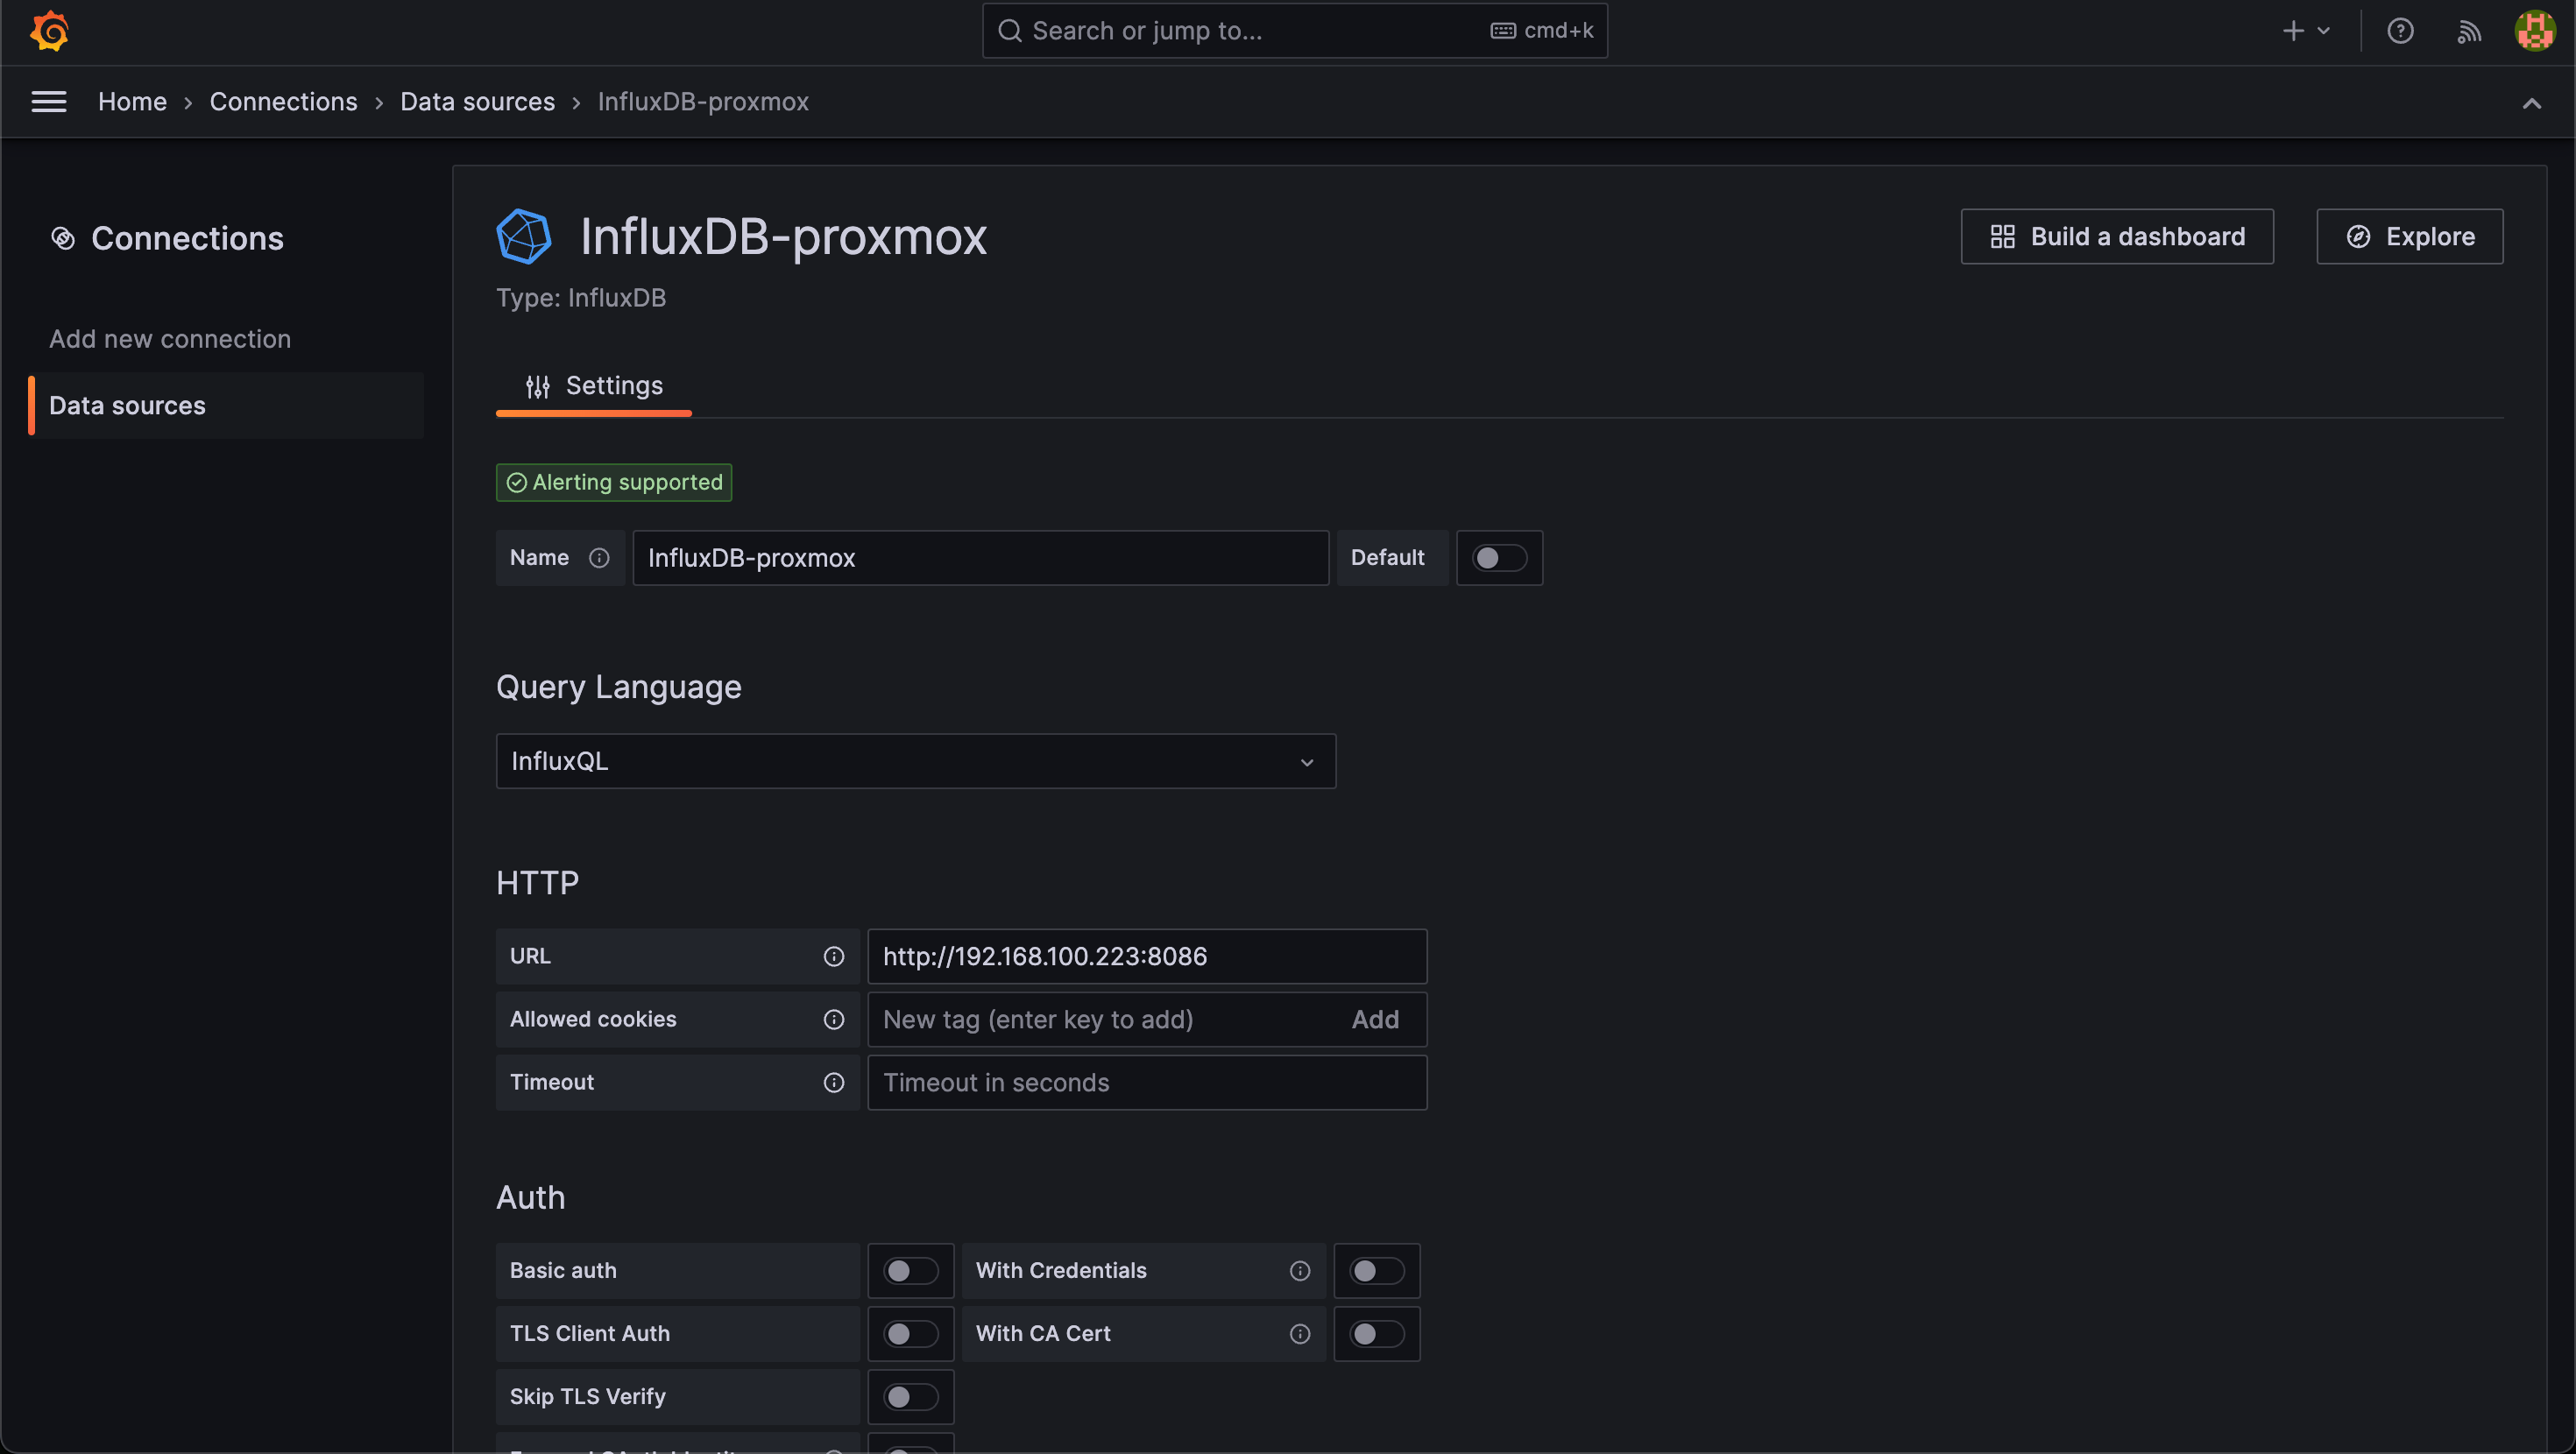
Since we're utilizing InfluxQL as the query language we'll have to add a custom header with the key Authorization and the value as Token <token>. (Replace <token> with the token generated previously). The database name is set to our bucket name and the method is set to GET. Please refer to the InfluxData documentation for how to integrate Grafana with InfluxDB
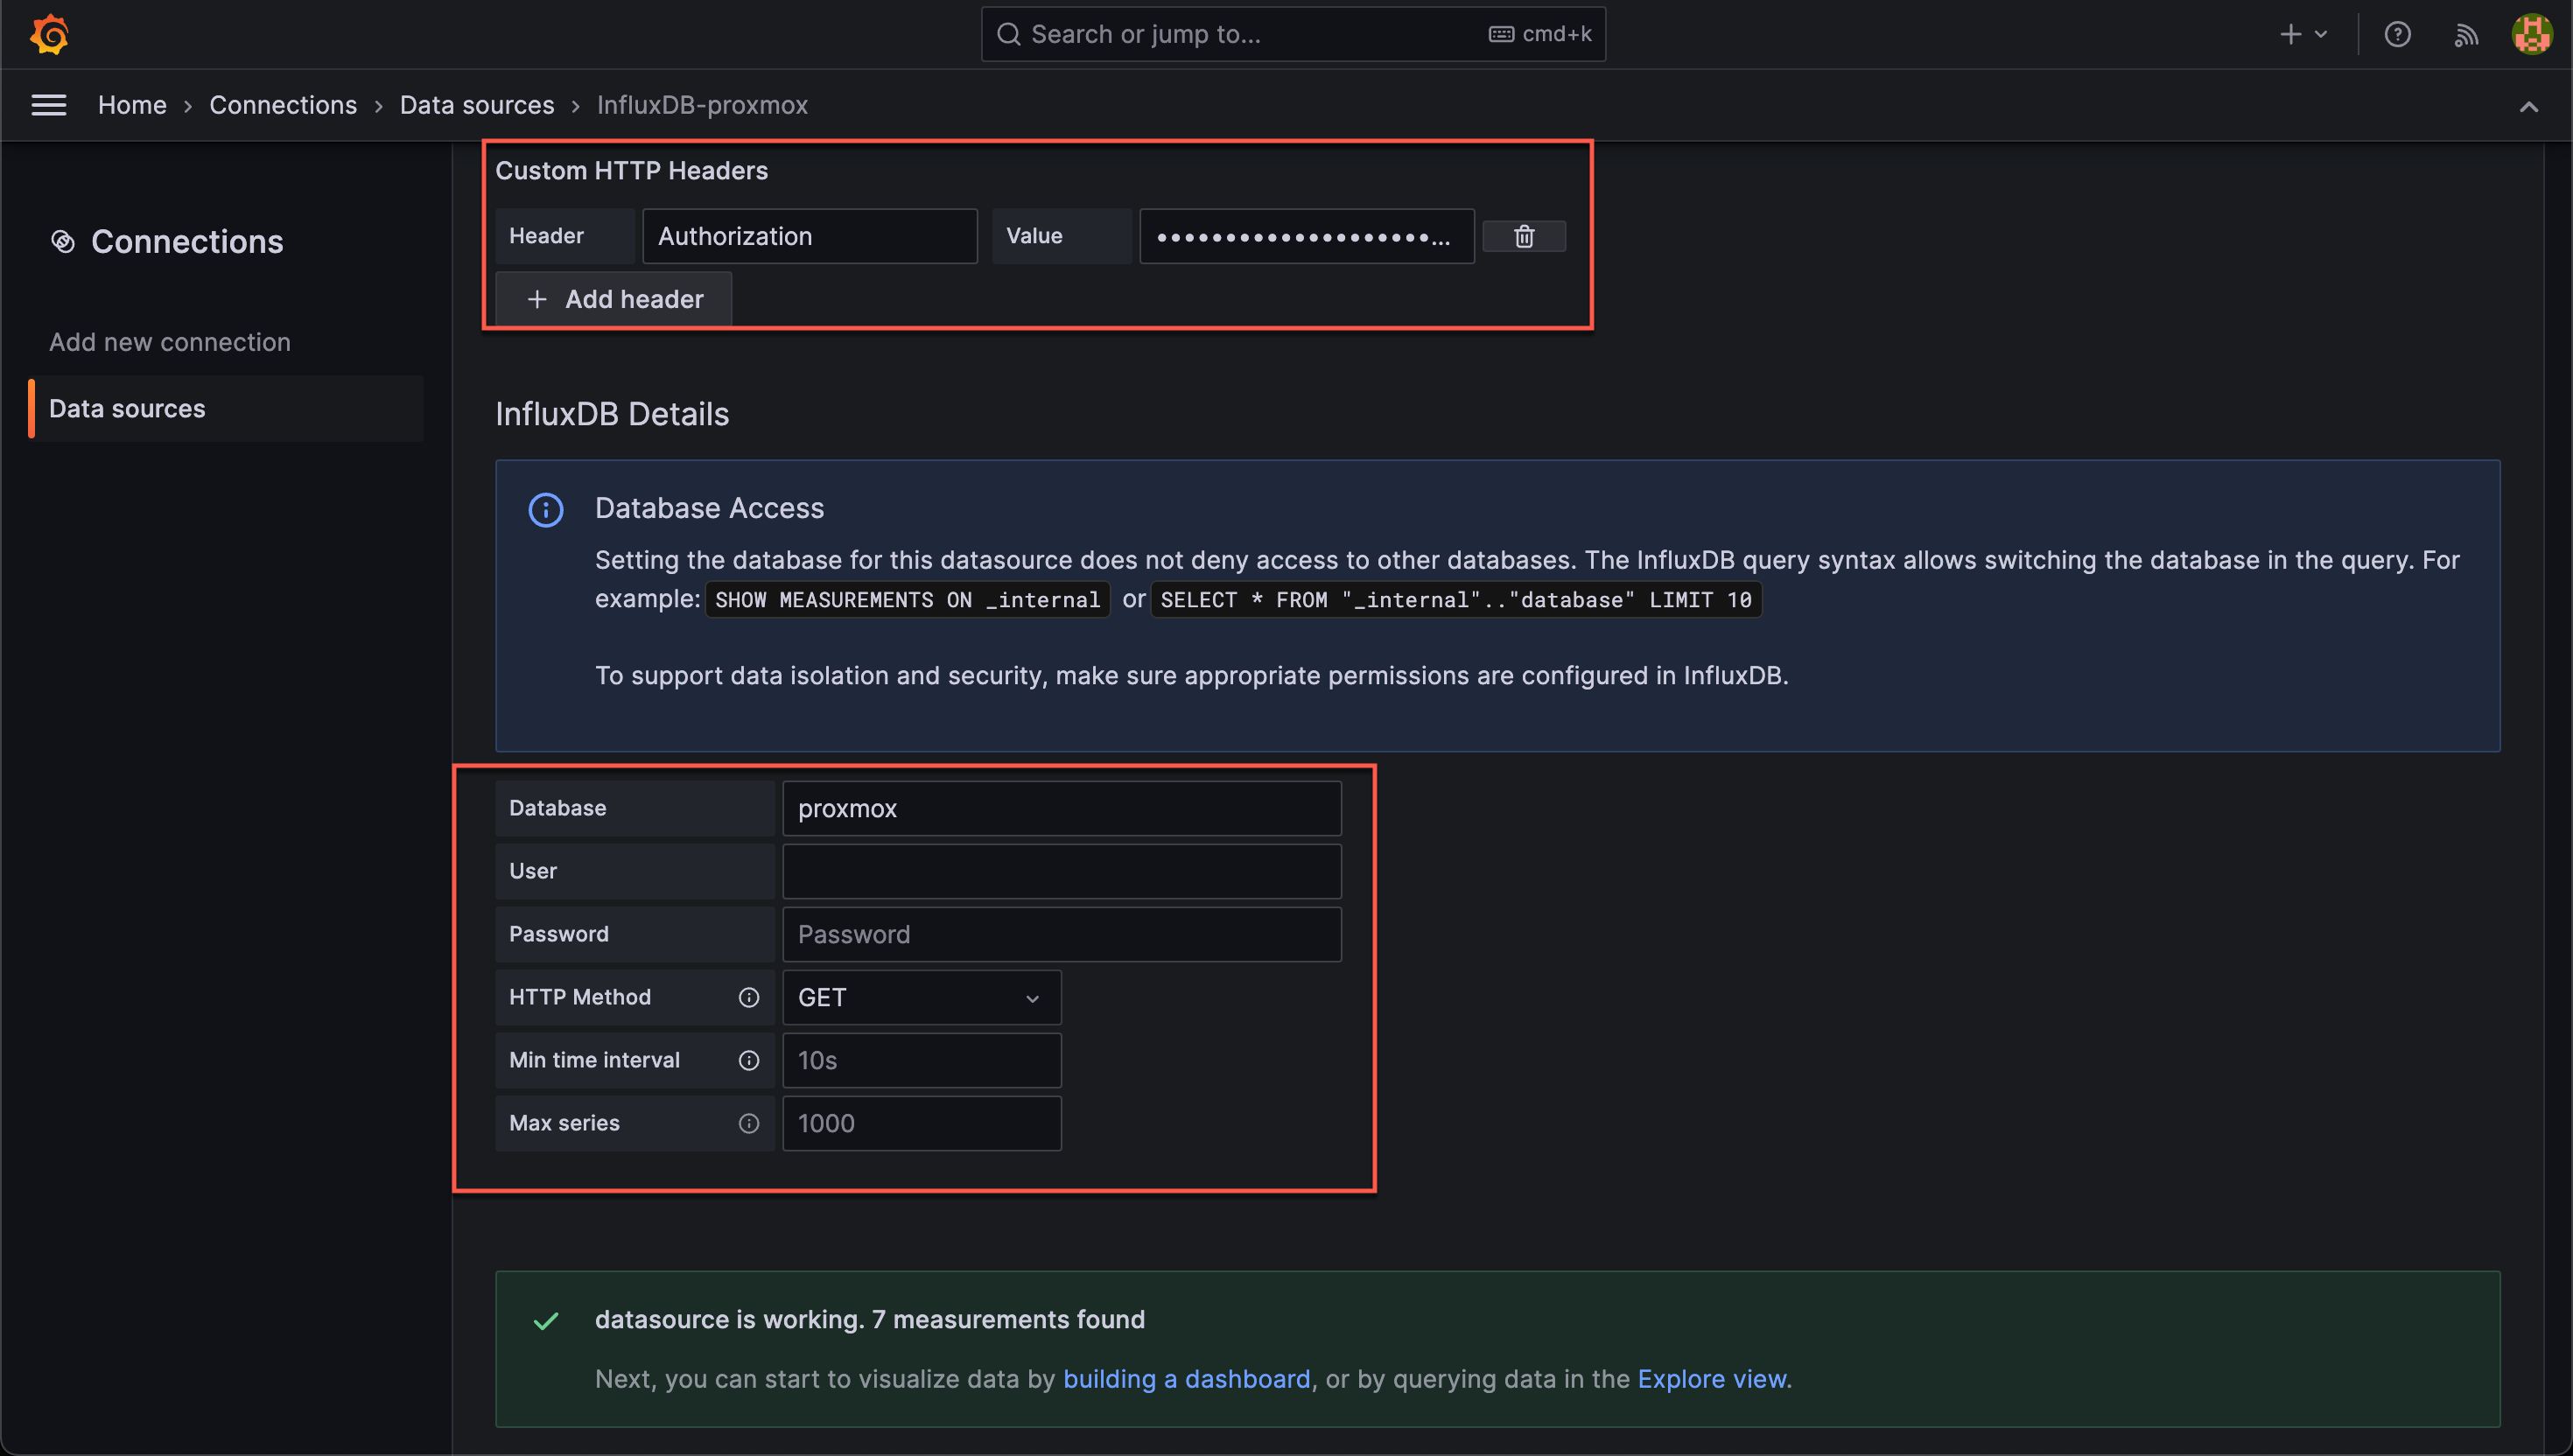
With the datasource connected and working we can go ahead and build our first dashboard!
Before creating any panels we'll add a few variables.
Note that since there's no official documentation on the metrics pushed via the Metrics server the field and tag names as well as the units used is my interpreation of the metrics and their data
First we'll create a variable to hold our hosts and vms respectively
From the InfluxDB it seems that both the pve hosts as well as vm names is included in the hosts tag. There is also a nodenametag which seems to only be used for pve hosts so we'll use this as our starting point
Hosts variable query:
1show tag values with key = "nodename"
VMs variable query:
1show tag values from system with key = "host" where vmid =~ /\d+?/ and "nodename" =~ $hosts
In this variable we make use of the hosts variable defined and the values from that to filter the vms included. To further filter we do a regex match on the vmid field which will only exist for VMs
Now with this in place we can add some visualizations.
I won't detail every panel, these are just as an example and exists in an overview dashboard which is also created as an example
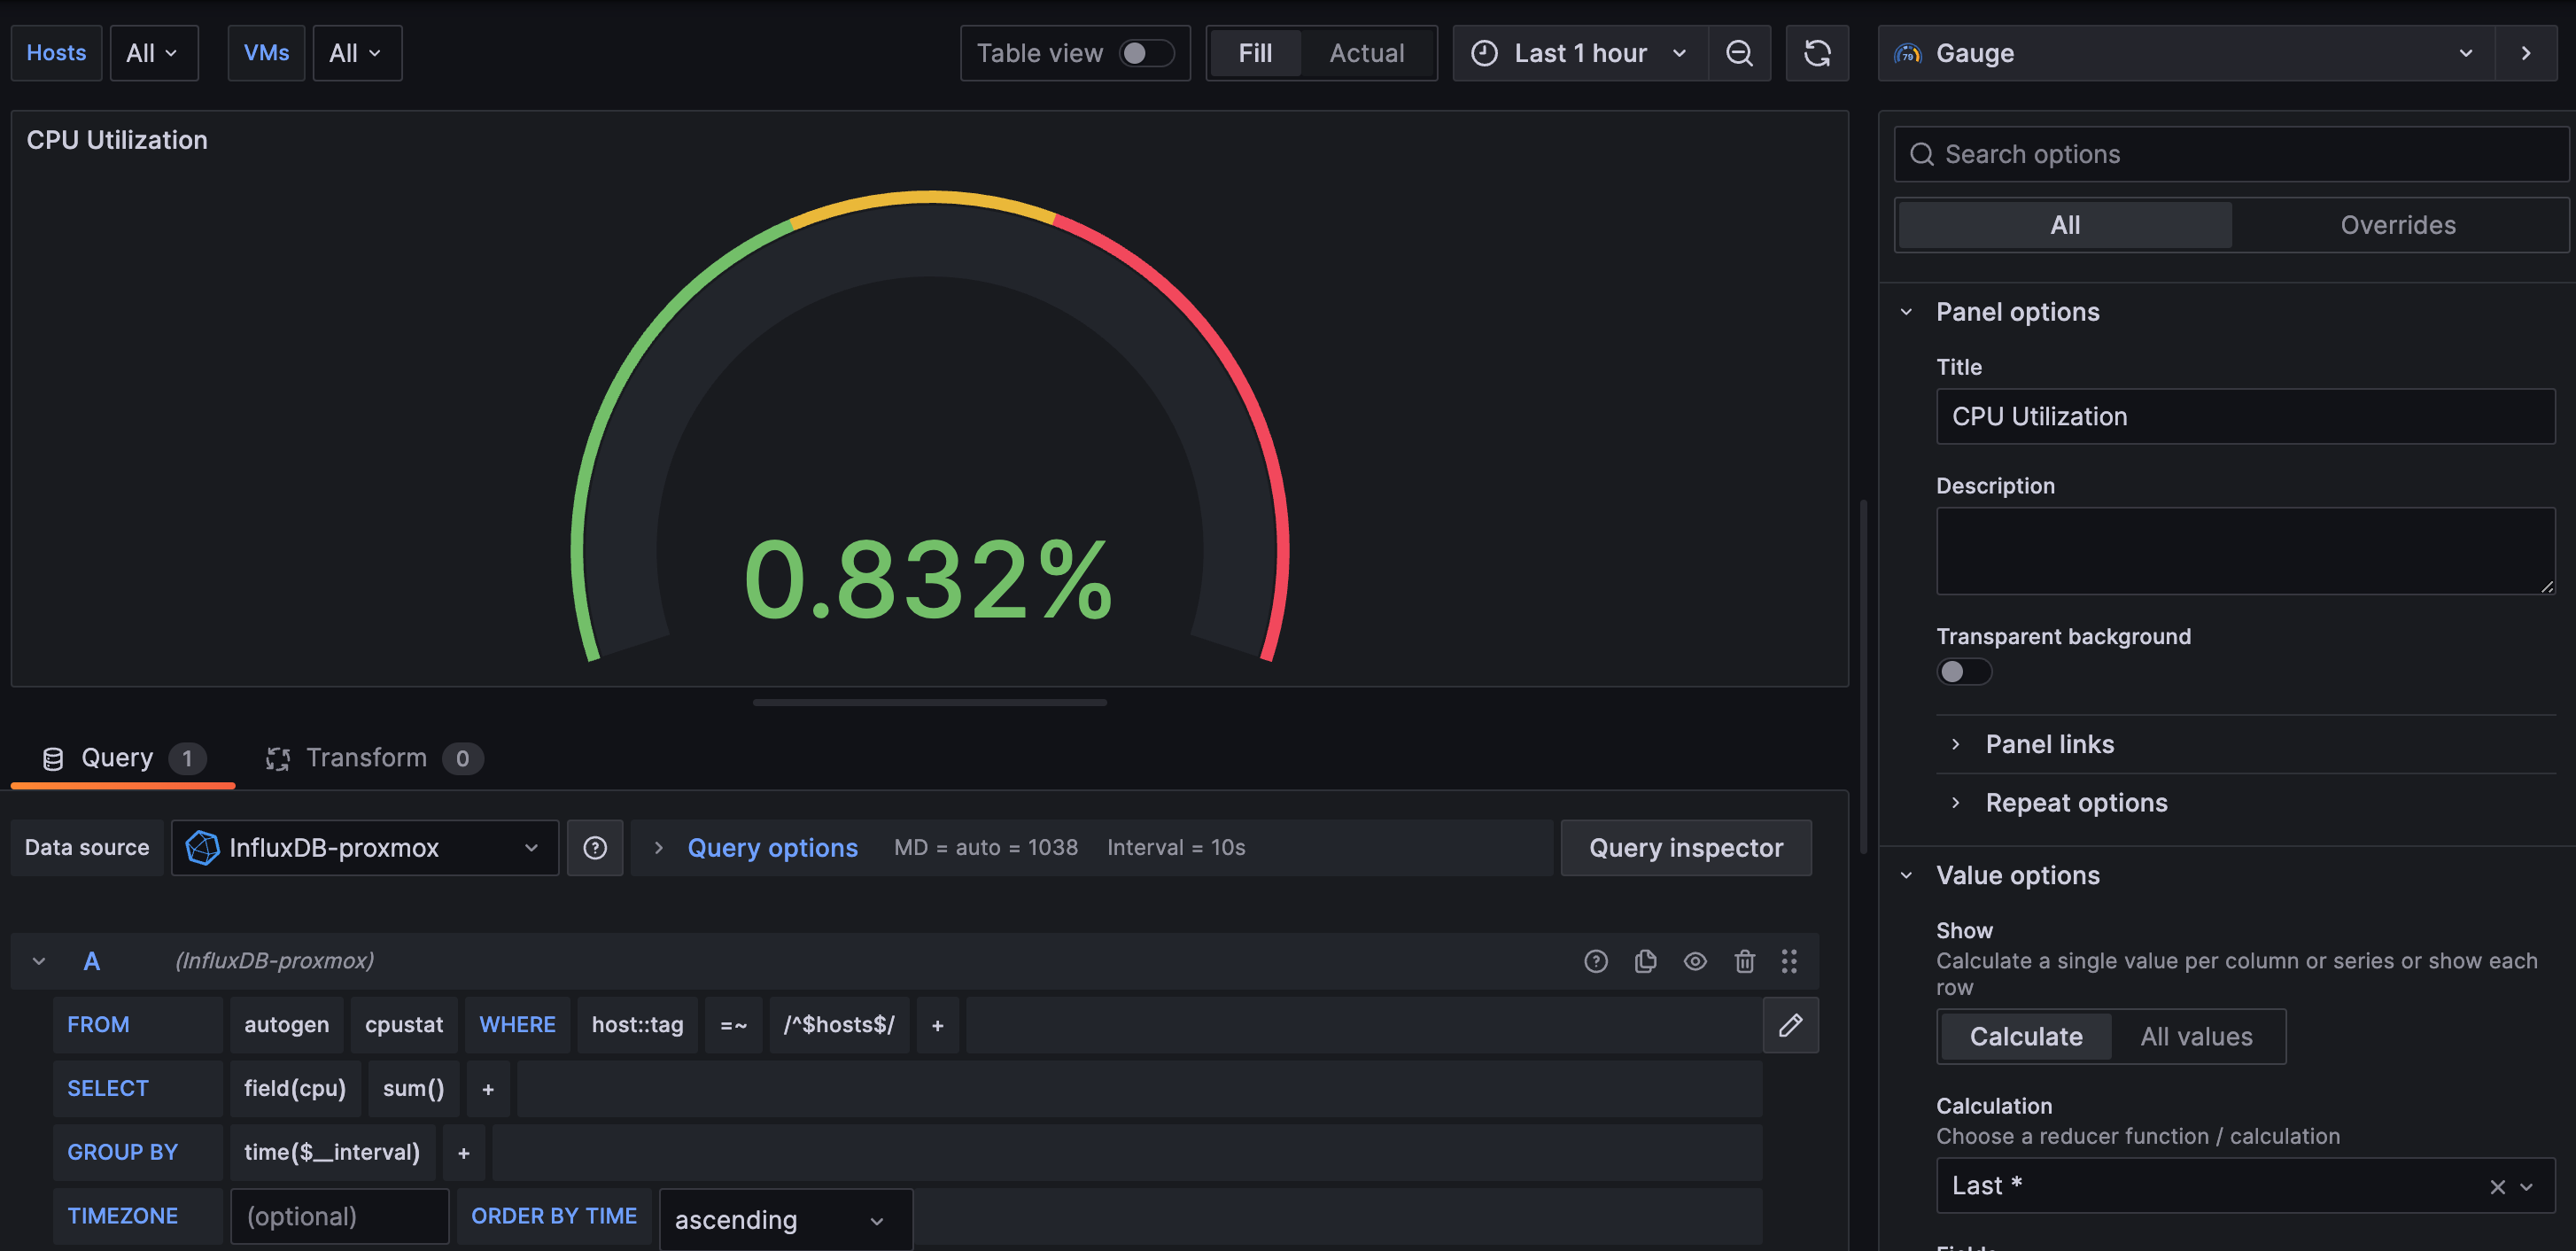
First we have a gauge showing the CPU utilization on a set of hosts
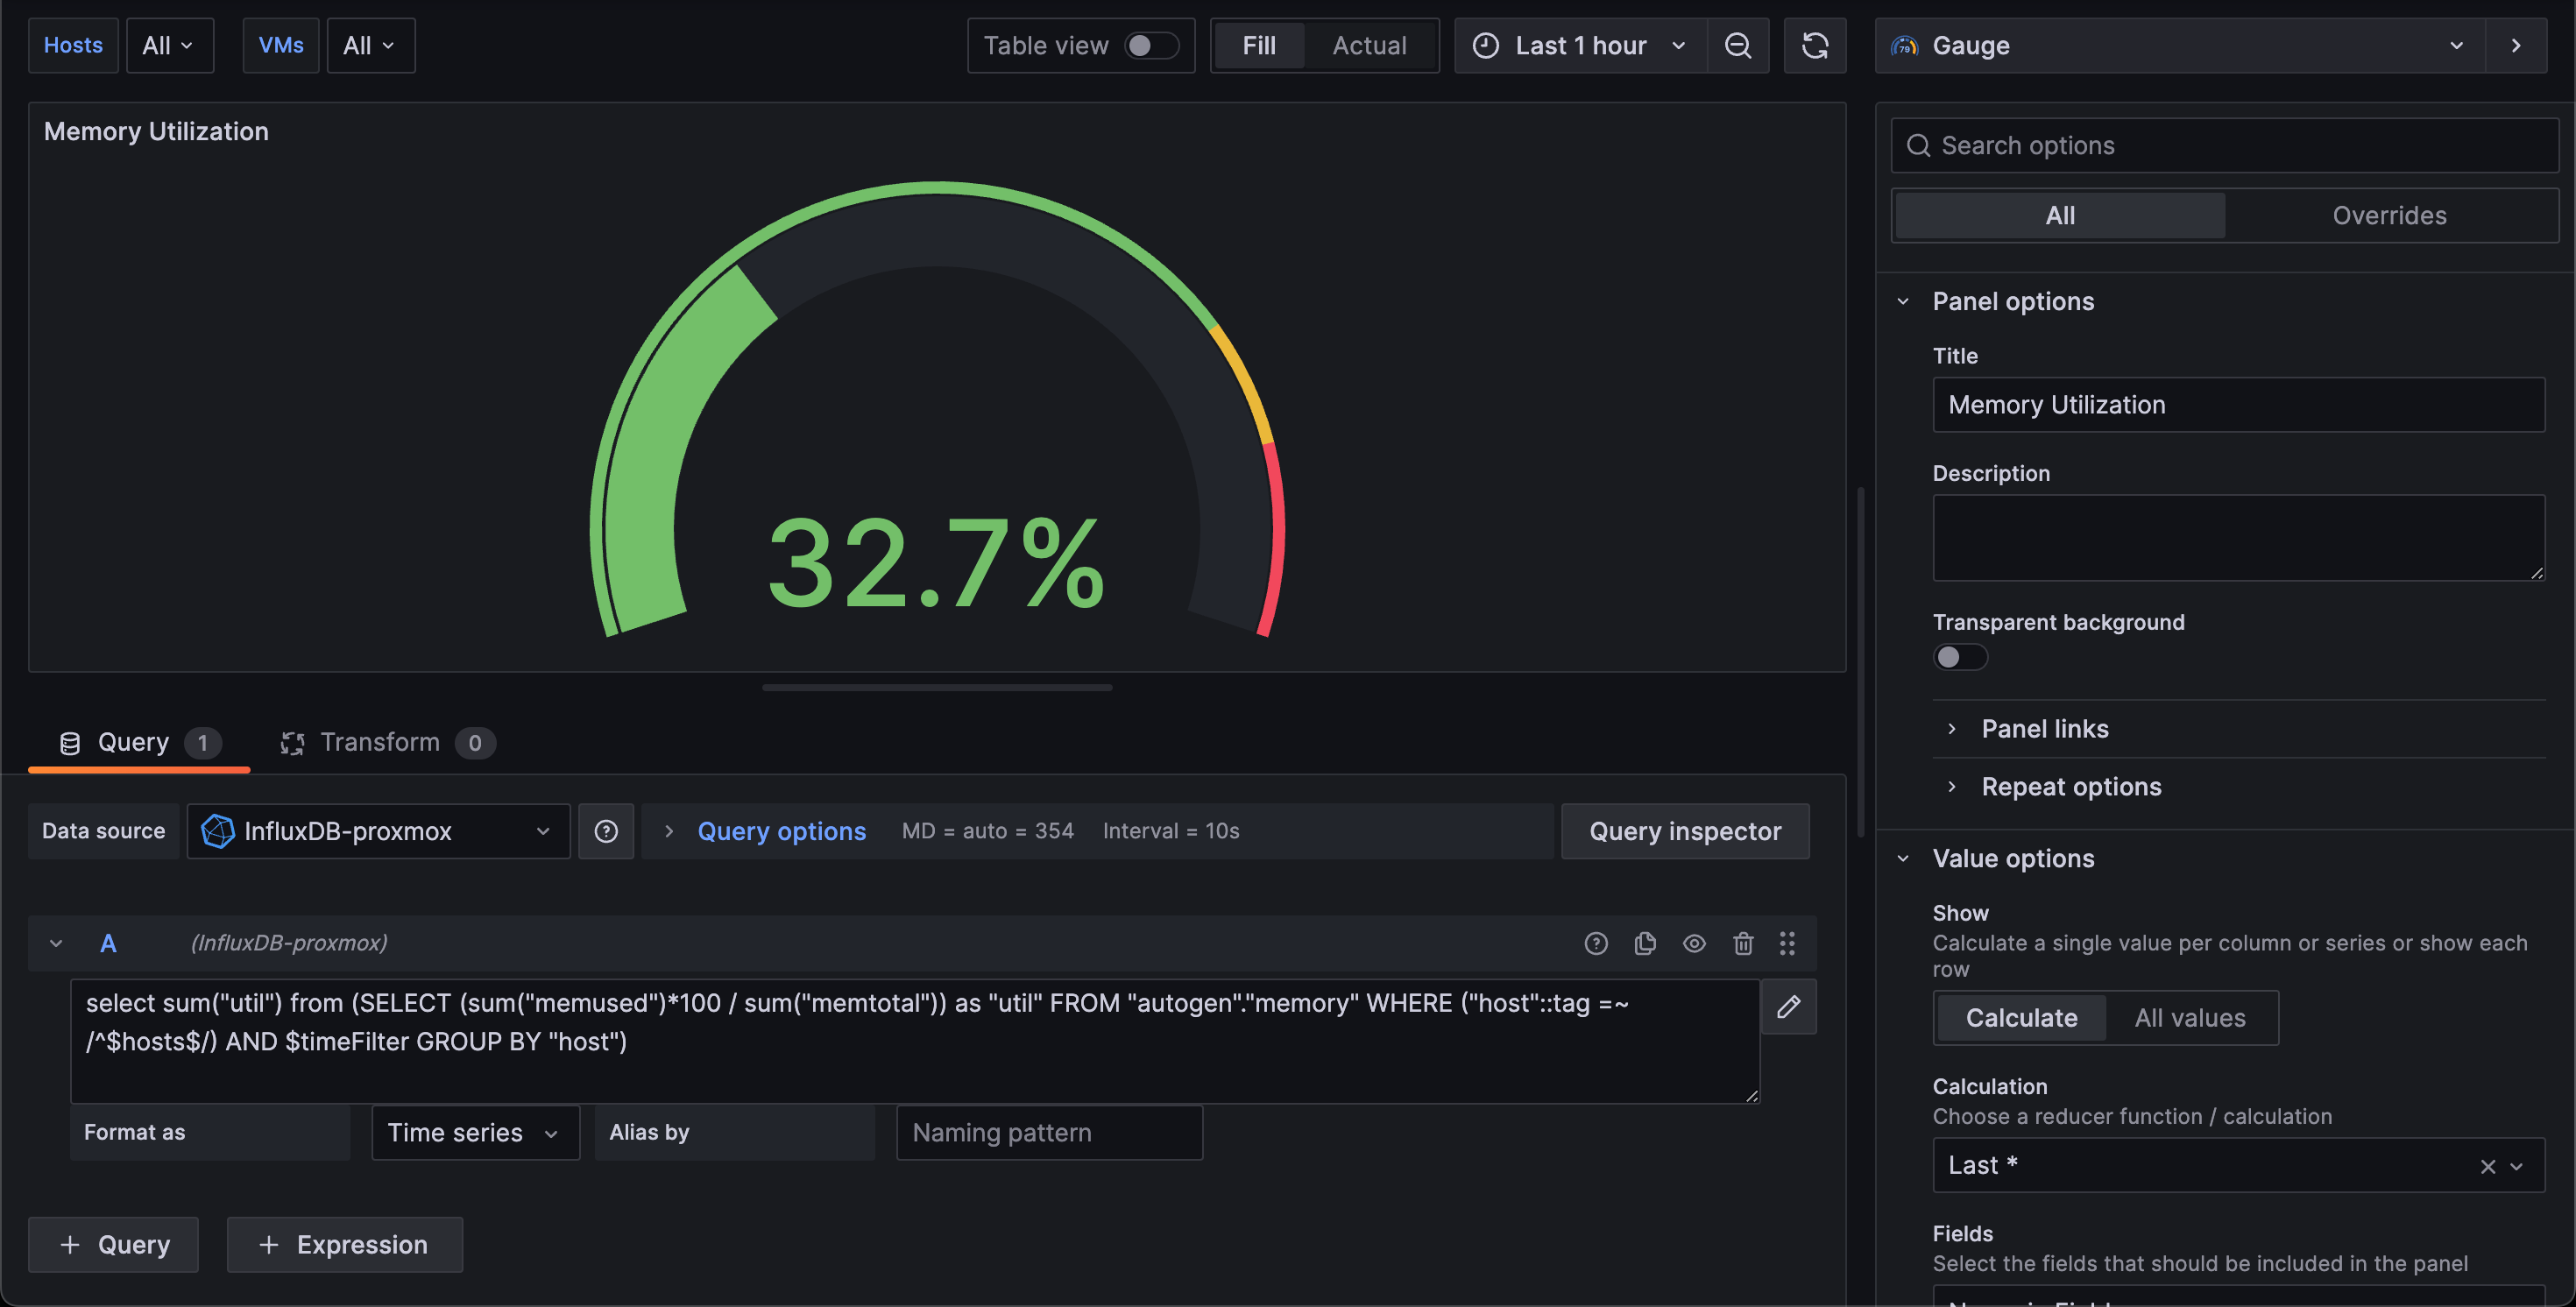
Next we'll have the same just for Memory utilization. Note that here we'll calculate the percentage based on the used and total memory in bytes
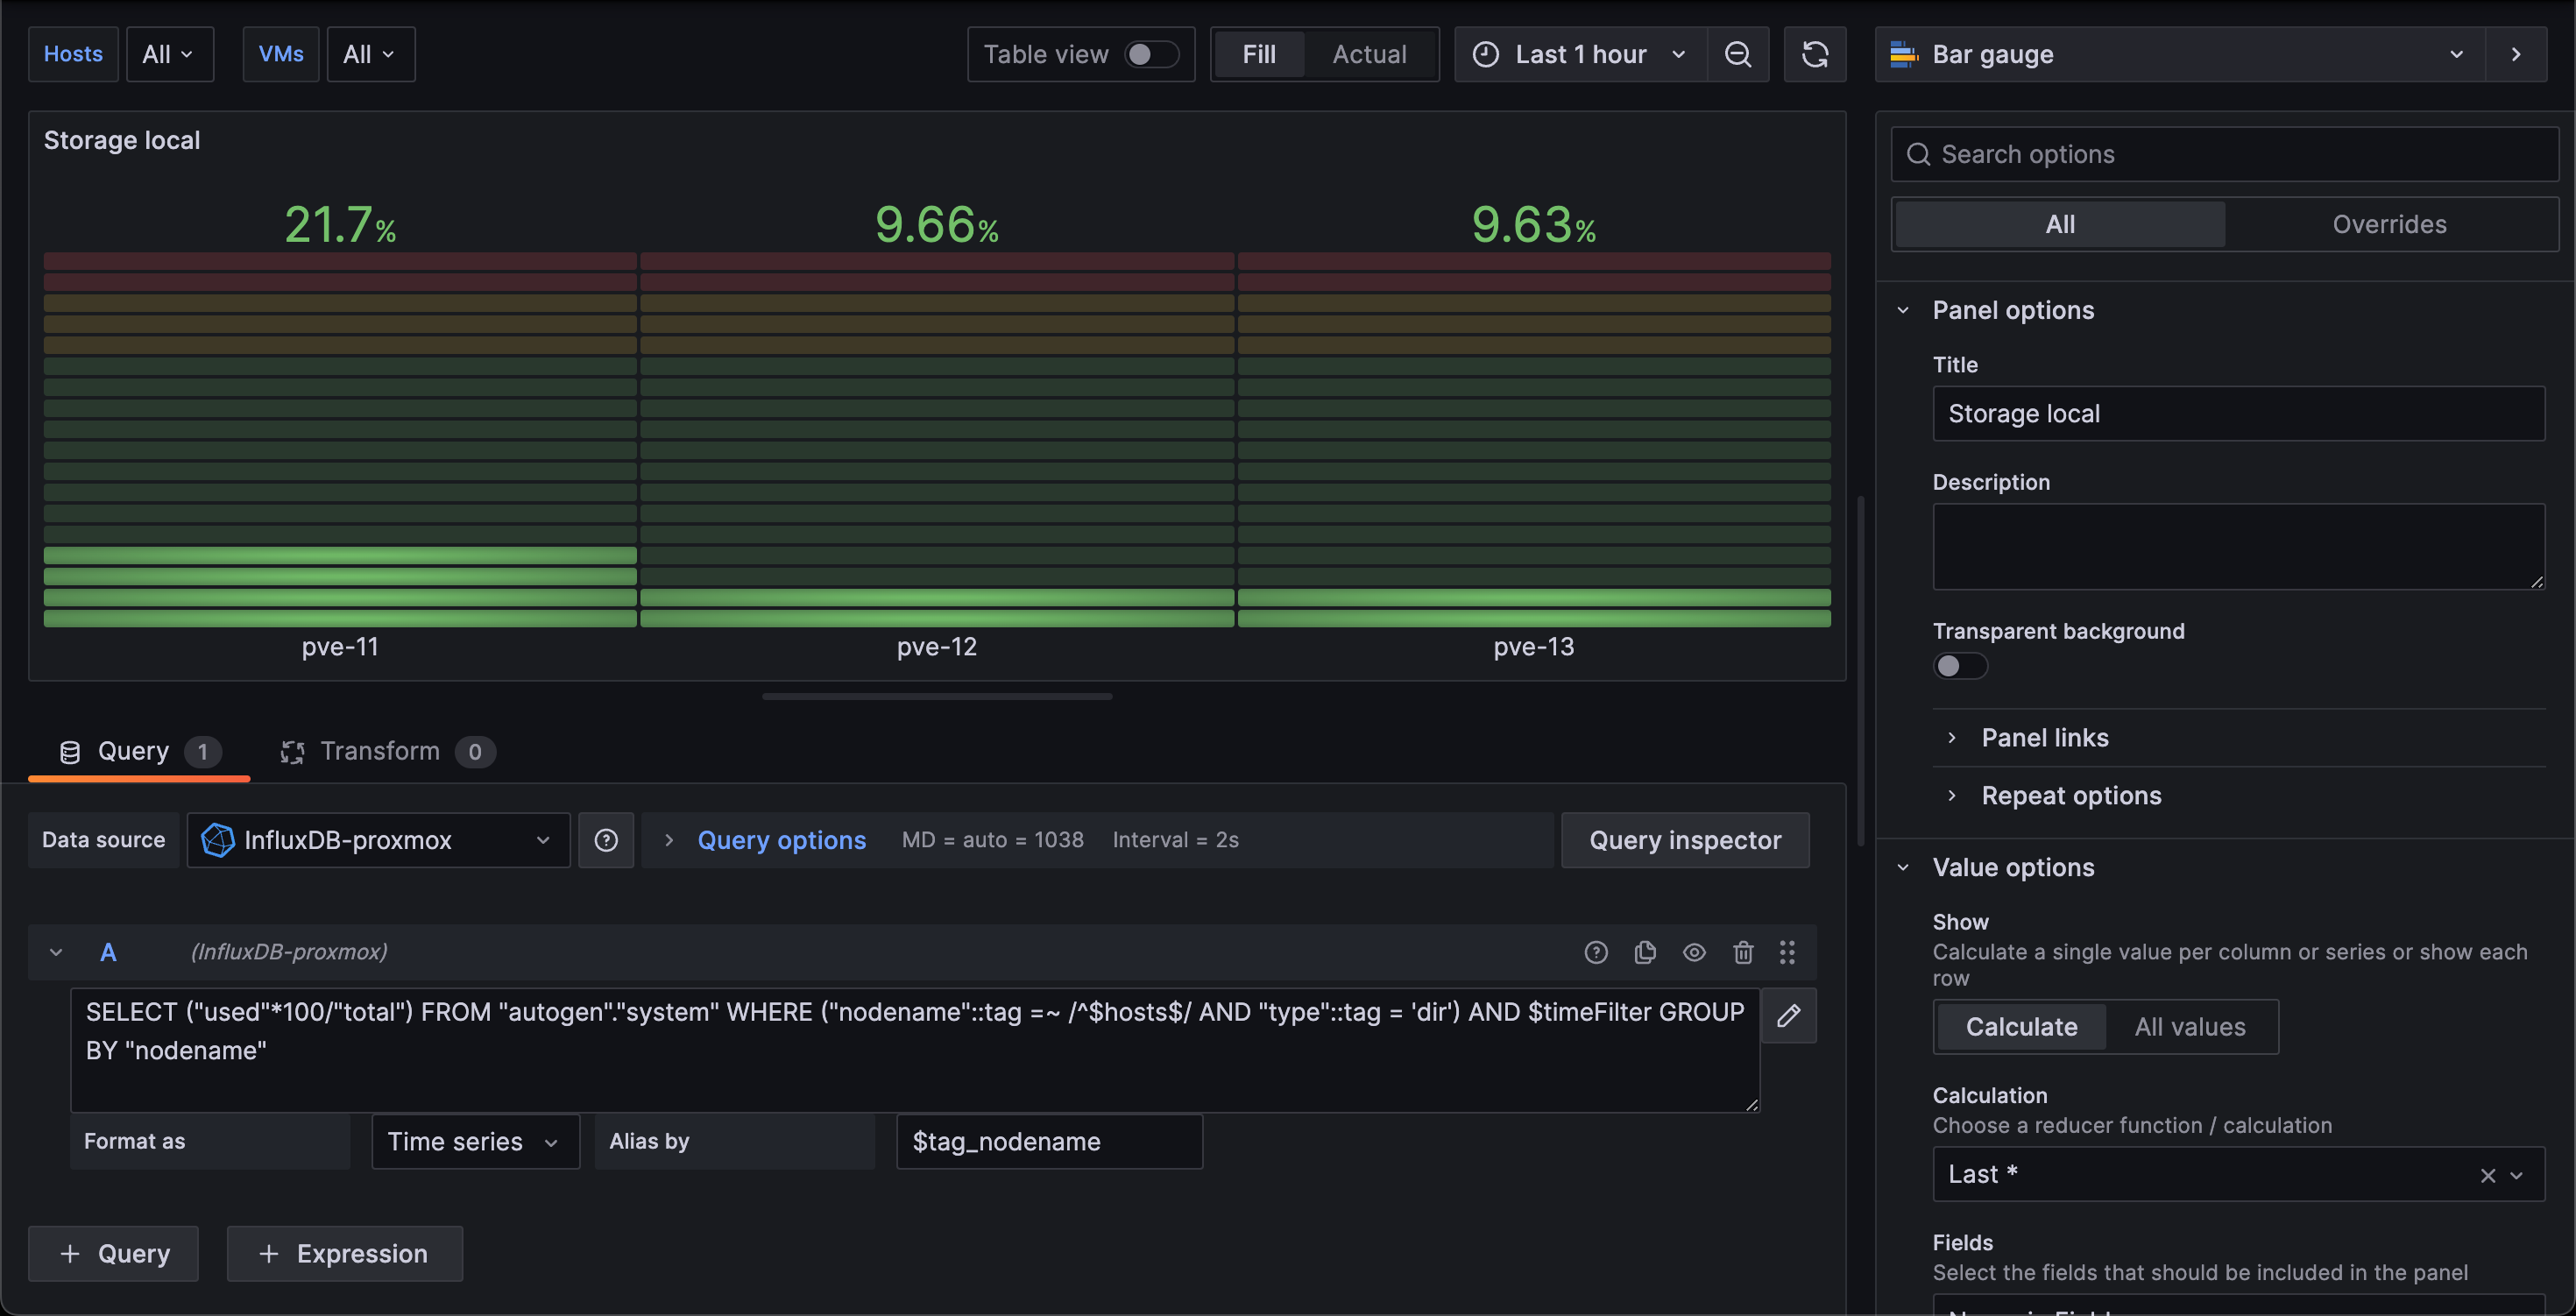
Next we'll add a panel that shows the utilization for the "local" volume. I chose this since this is where you'll typically store ISO images and backups
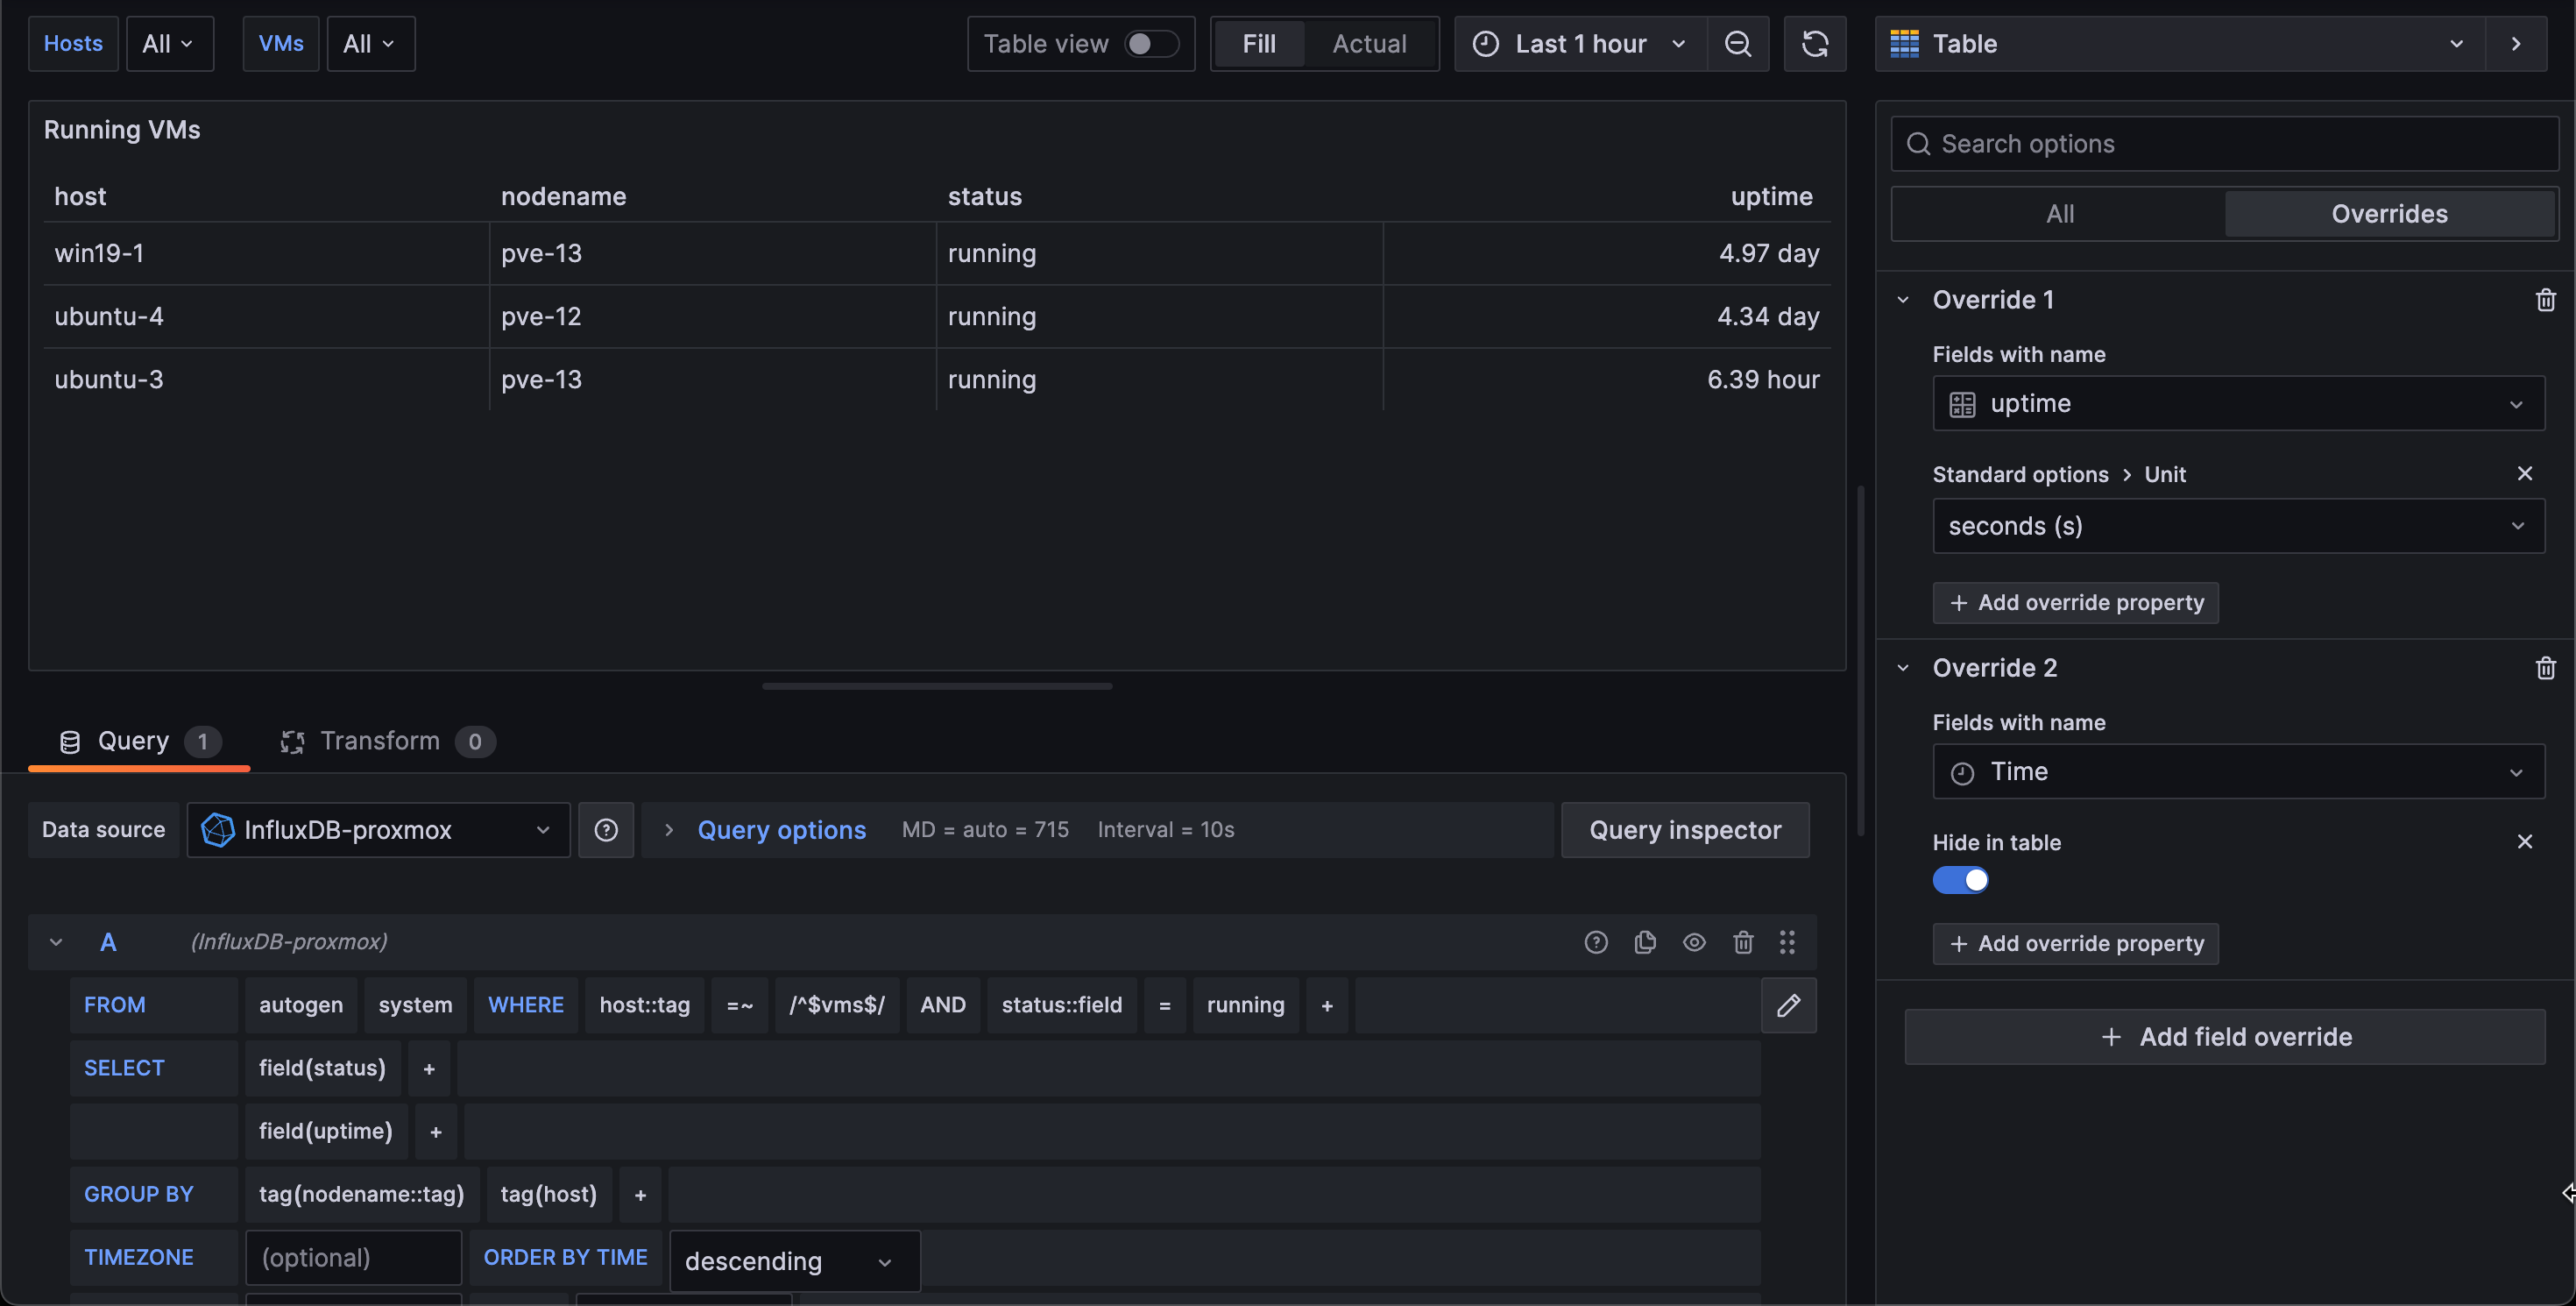
We'll also add a table panel for the running VMs and their uptime. Here we'll also add some overrides to the panel
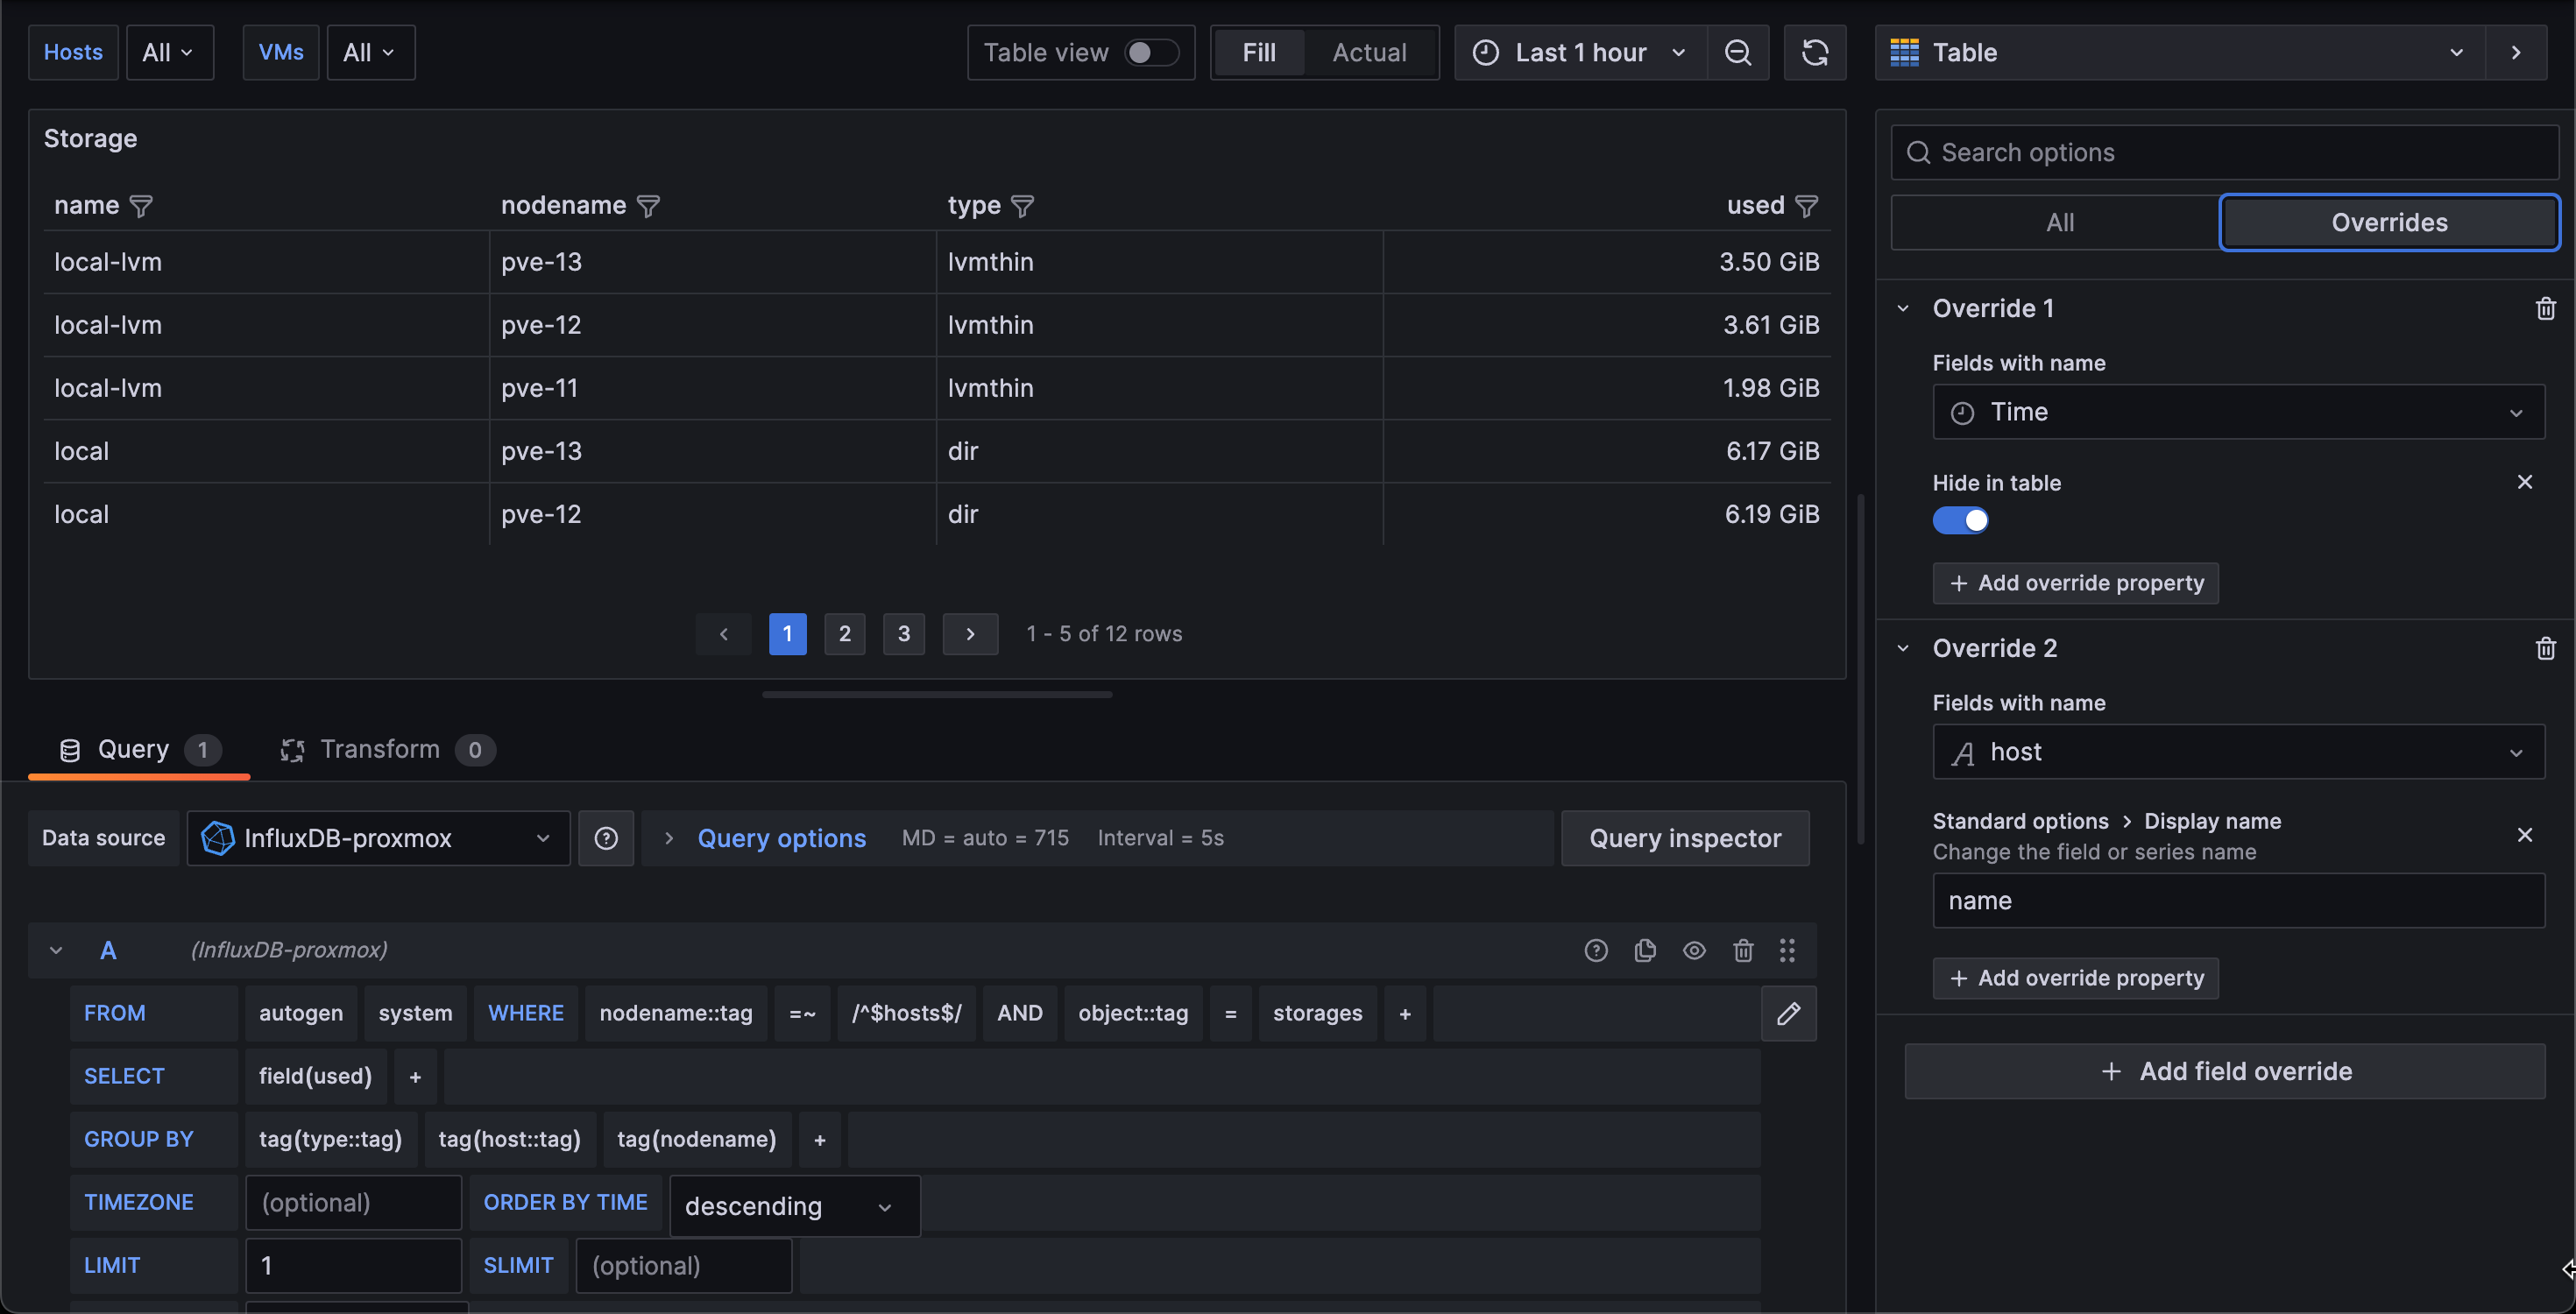
To the side of this panel we'll add a table panel that lists the different storage volumes
These first panels is meant to give an overview
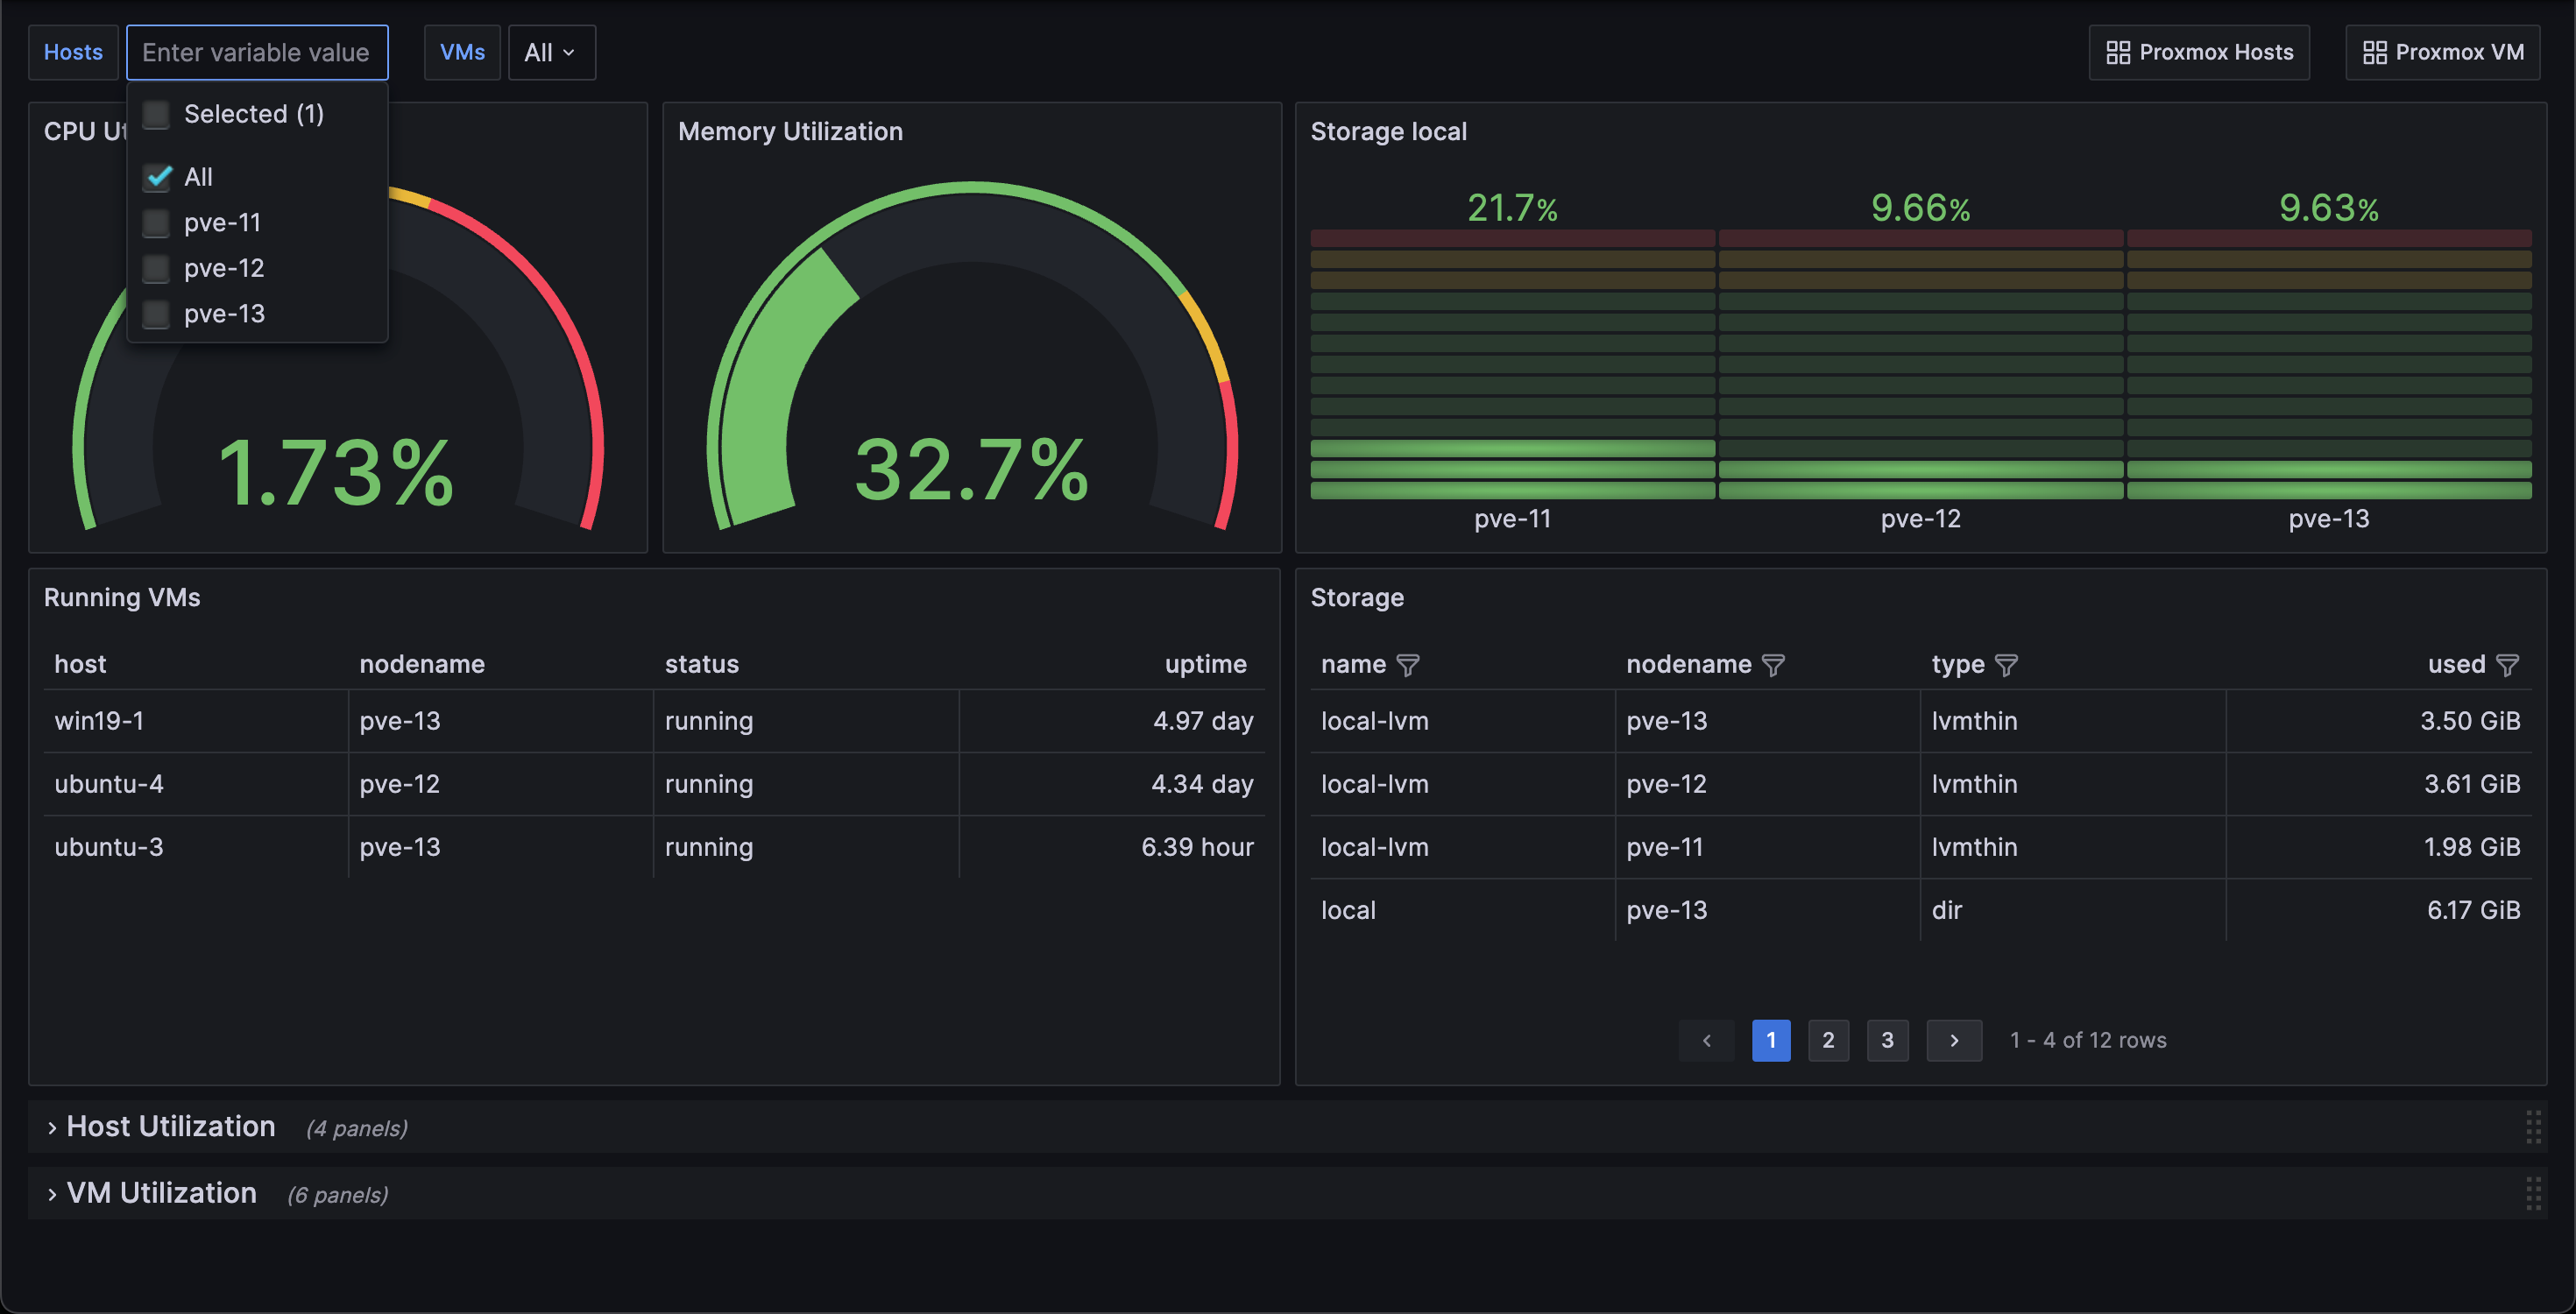
We can also see that the dashboard supports filtering on hosts and vms through the variables
Below these overview panels I've added two rows with host utilization and vm utilization graphs
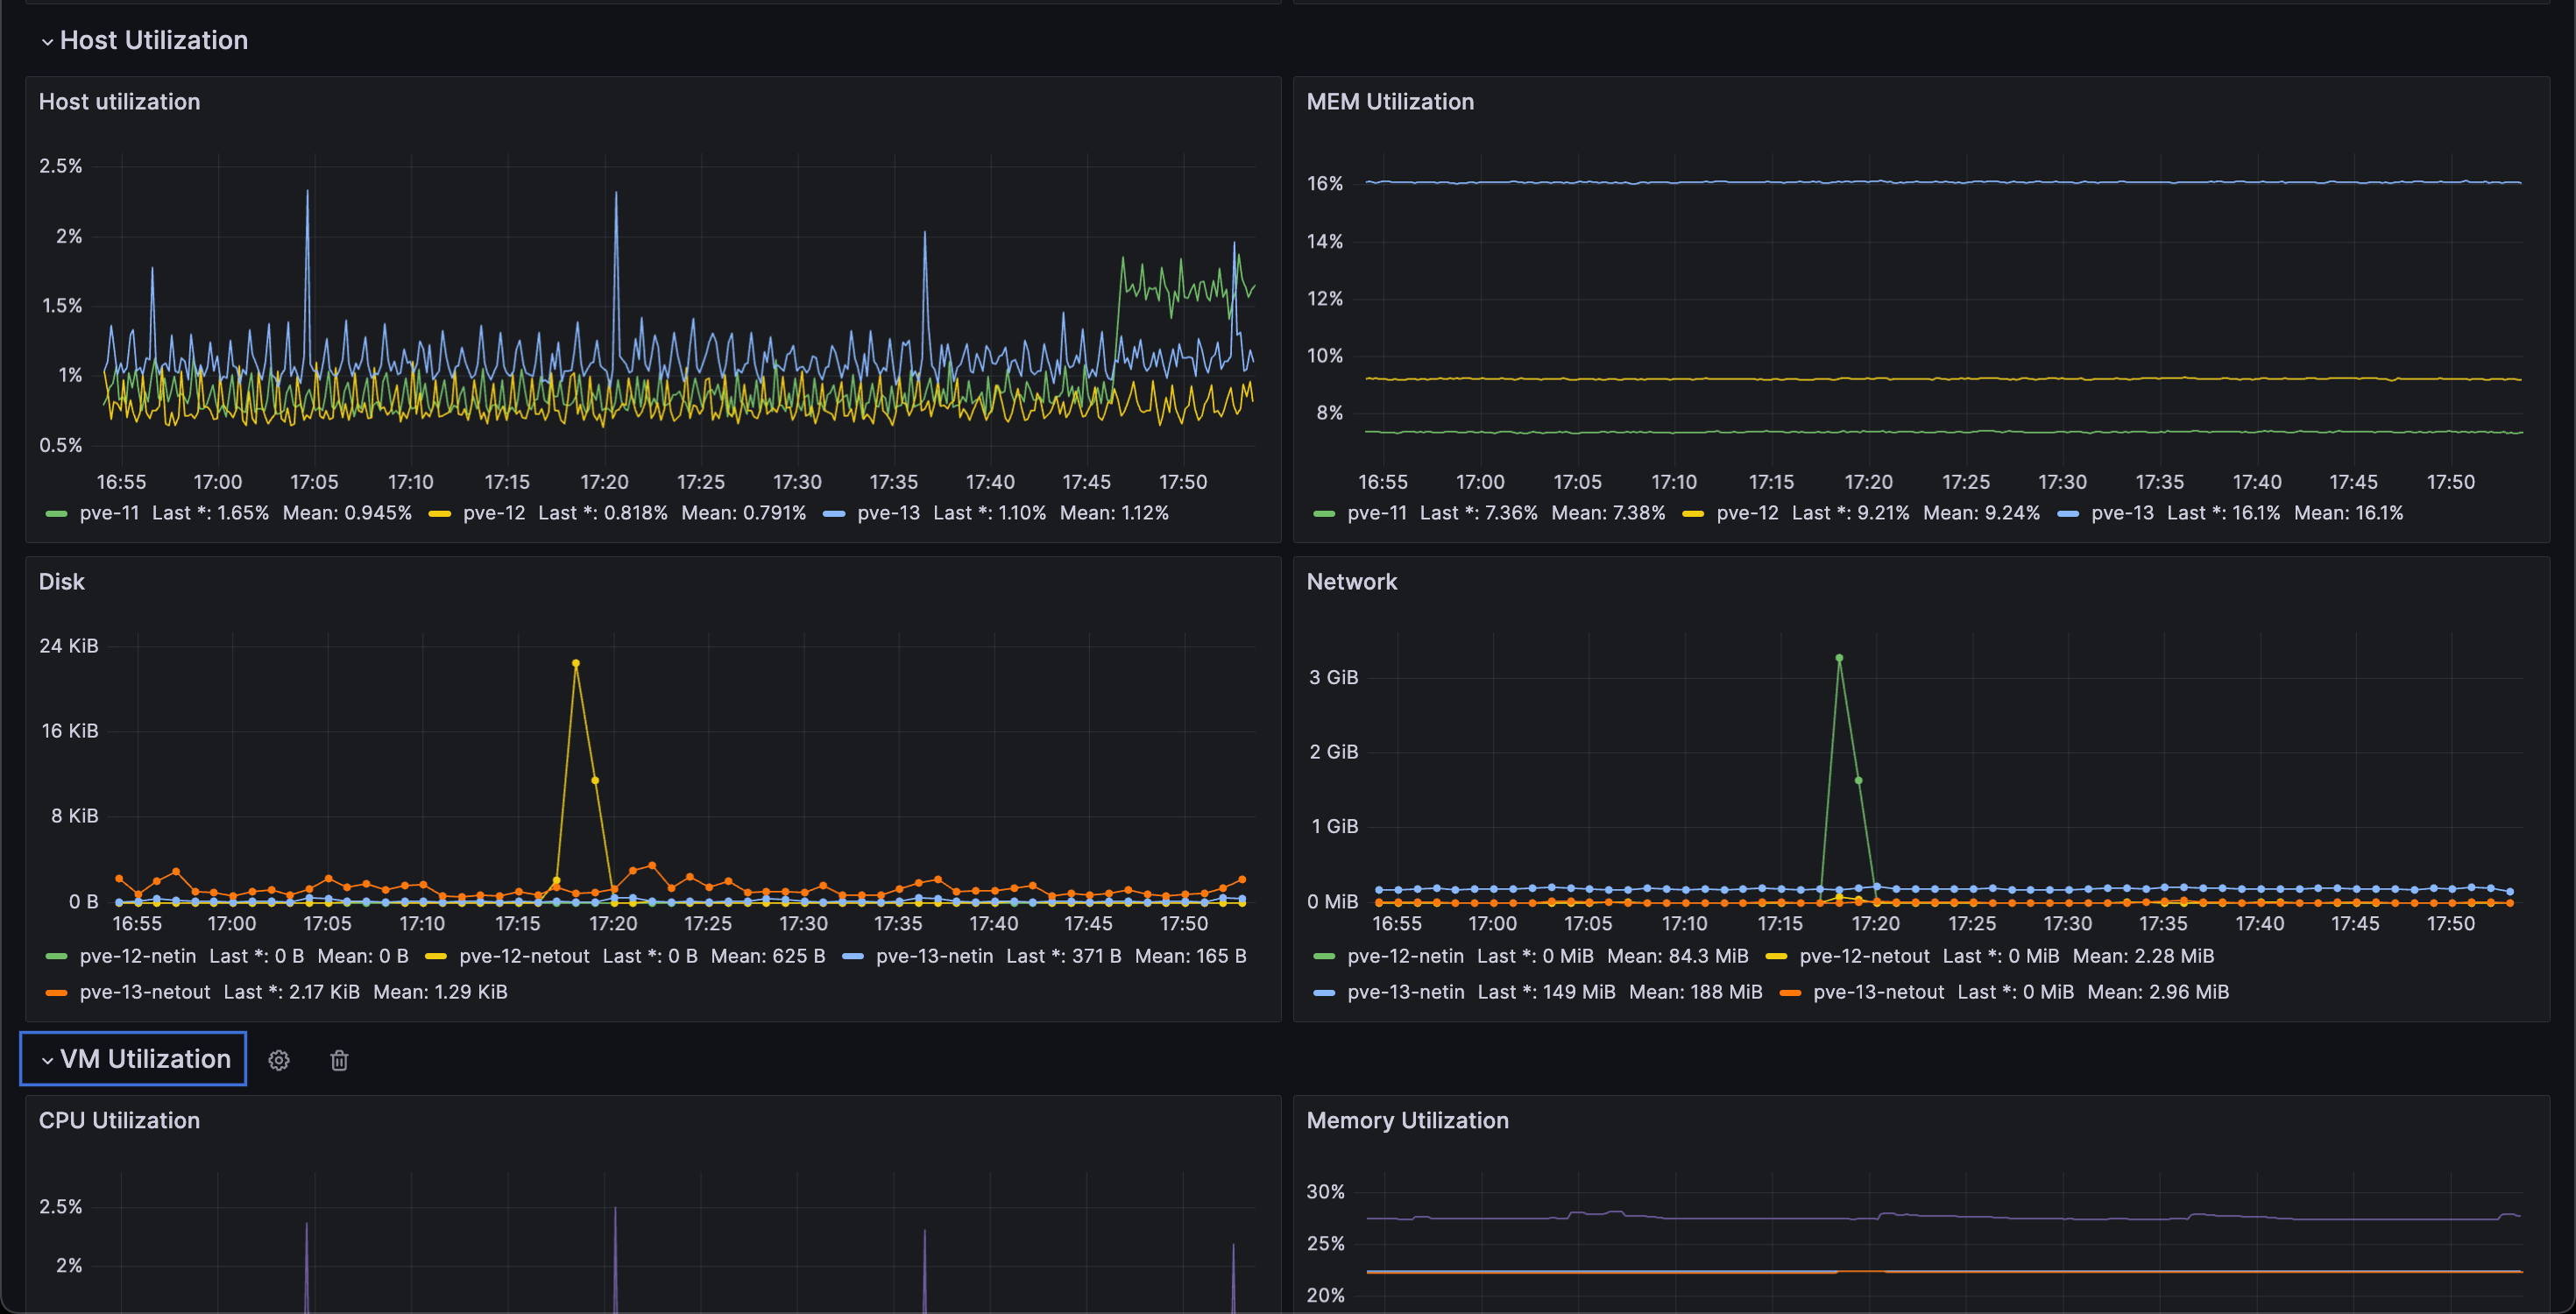
The dashboard can be downloaded from grafana.com with the ID 22482. With the ID you can also download it directly to your Grafana instance
Summary
This post has shown how to make use of the built in external metric server in PVE to integrate with InfluxDB. We've also seen a few examples on how to visualize the metrics in Grafana
There is quite a few other examples out there with both InfluxDB and Grafana. These are mostly using Flux as the query language, but as I explained this is eventually going to go away so I wanted to create some examples using the InfluxQL.
Thanks for reading, and please feel free to reach out if you have any questions or comments