Monitoring Harbor with Grafana and Prometheus
In this post we'll take a look at how to monitor a self-hosted Harbor instance with Prometheus and Grafana.
Harbor is an open source registry which amongst other things can store your container images. Harbor is an Cloud Native Computing Foundation (CNCF) graduated project.
In my environment Harbor is running on a Ubuntu VM, but it can also run on Kubernetes.
For information on how to install and configure Harbor please refer to the official documentation
In my environment I have also got a Prometheus server running for scraping different set of metrics, and Grafana for visualizing these metrics.
For information on how to install Prometheus please refer to the official documentaion and for Grafana you have the documentation here
Now, for the rest of this post we'll focus on how to integrate the three components.
Harbor exporter
Harbor exposes quite a few different metrics. What's nice about it is that they are all exposed using the Prometheus data model. This makes it easy to get those metrics into Prometheus.
There's actually four different components that exposes metrics, exporter, core, registry and jobservice.
The exporter component exposes metrics related to the Harbor database and the Harbor instance it self. Projects will also be exposed here
The core component exposes three different metrics, all regarding the http requests to the core
The registry component exposes metrics related to http requests to the registry, and also a few storage metrics
The jobservice component exposes metrics related to, you guessed it, the jobservice.
Scrape config
For Prometheus to scrape the metrics we're setting up scrape jobs for all four of these.
I've pulled all of these from the Harbor documentation. If we want we could add some of our own labels to the jobs.
 1  - job_name: 'harbor-exporter'
 2    scrape_interval: 20s
 3    static_configs:
 4      # Scrape metrics from the Harbor exporter component
 5      - targets: ['192.168.110.131:9090']
 6
 7  - job_name: 'harbor-core'
 8    scrape_interval: 20s
 9    params:
10      # Scrape metrics from the Harbor core component
11      comp: ['core']
12    static_configs:
13      - targets: ['192.168.110.131:9090']
14
15  - job_name: 'harbor-registry'
16    scrape_interval: 20s
17    params:
18      # Scrape metrics from the Harbor registry component
19      comp: ['registry']
20    static_configs:
21      - targets: ['192.168.110.131:9090']
22
23  - job_name: 'harbor-jobservice'
24    scrape_interval: 20s
25    params:
26      # Scrape metrics from the Harbor jobservice component
27      comp: ['jobservice']
28    static_configs:
29      - targets: ['192.168.110.131:9090']
If you run Harbor (and Prometheus) in a Kubernetes cluster please check the documentation for an example of how to define your scrape job
Prometheus
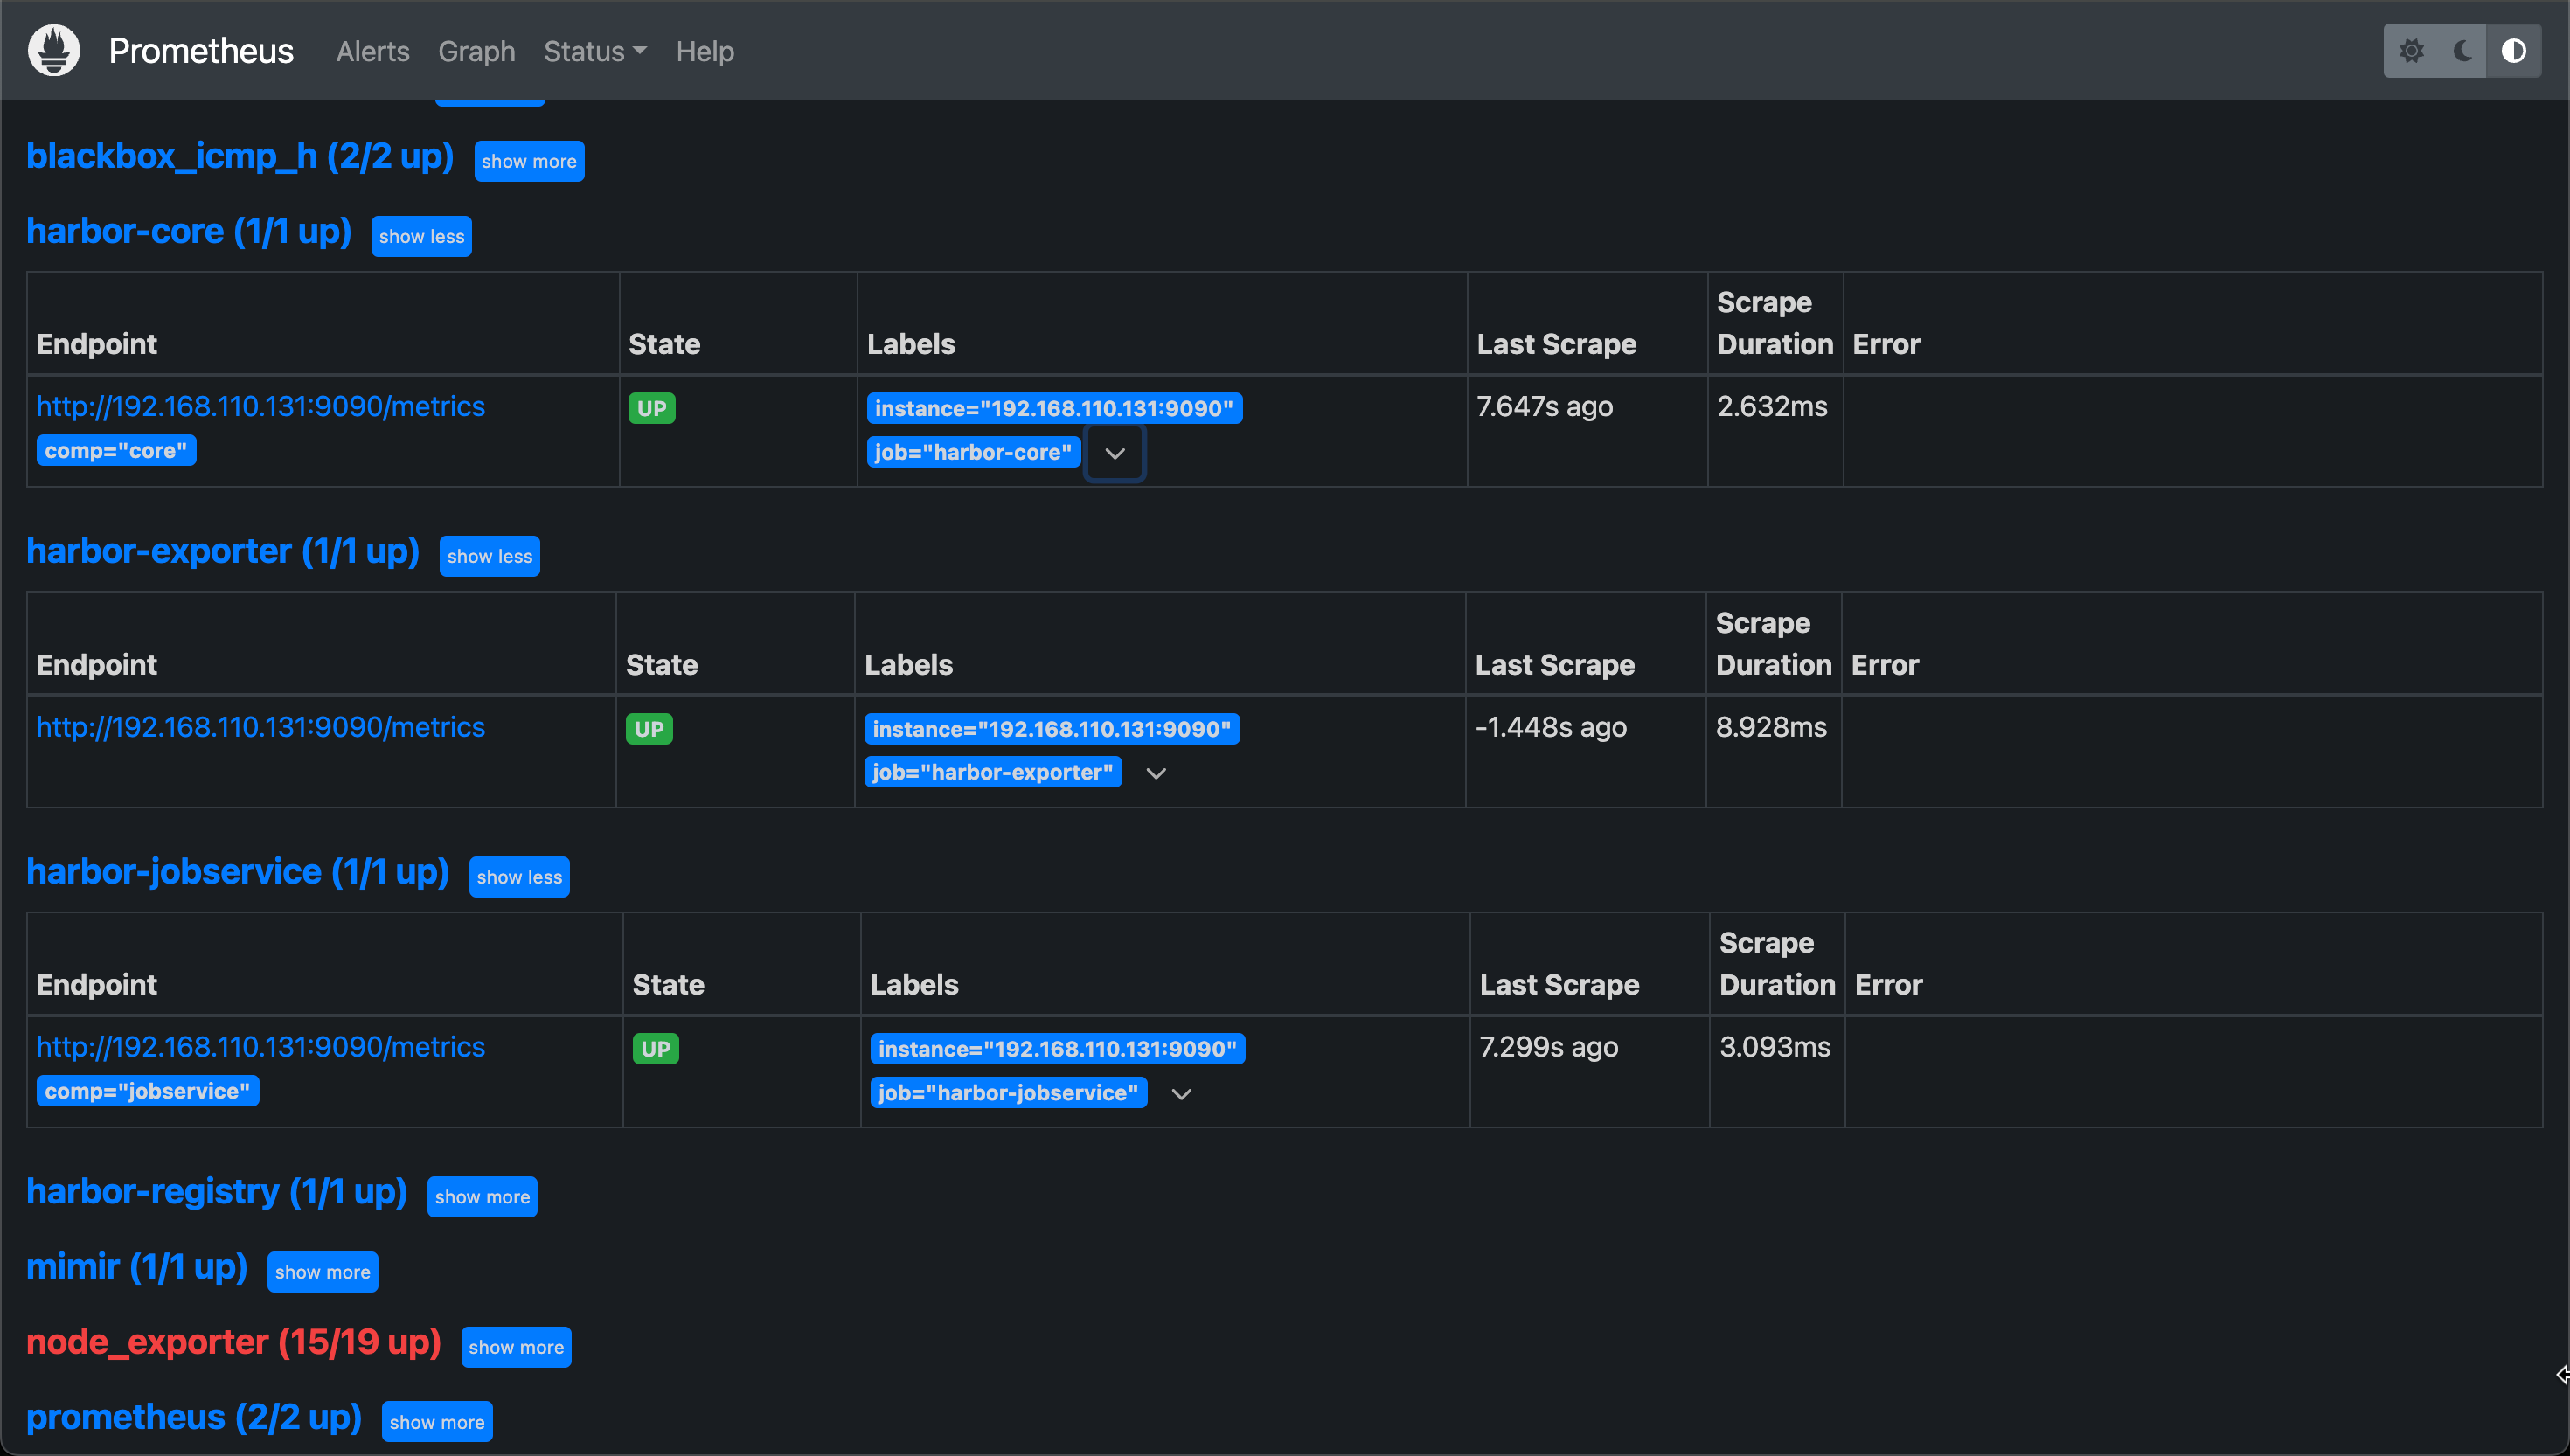
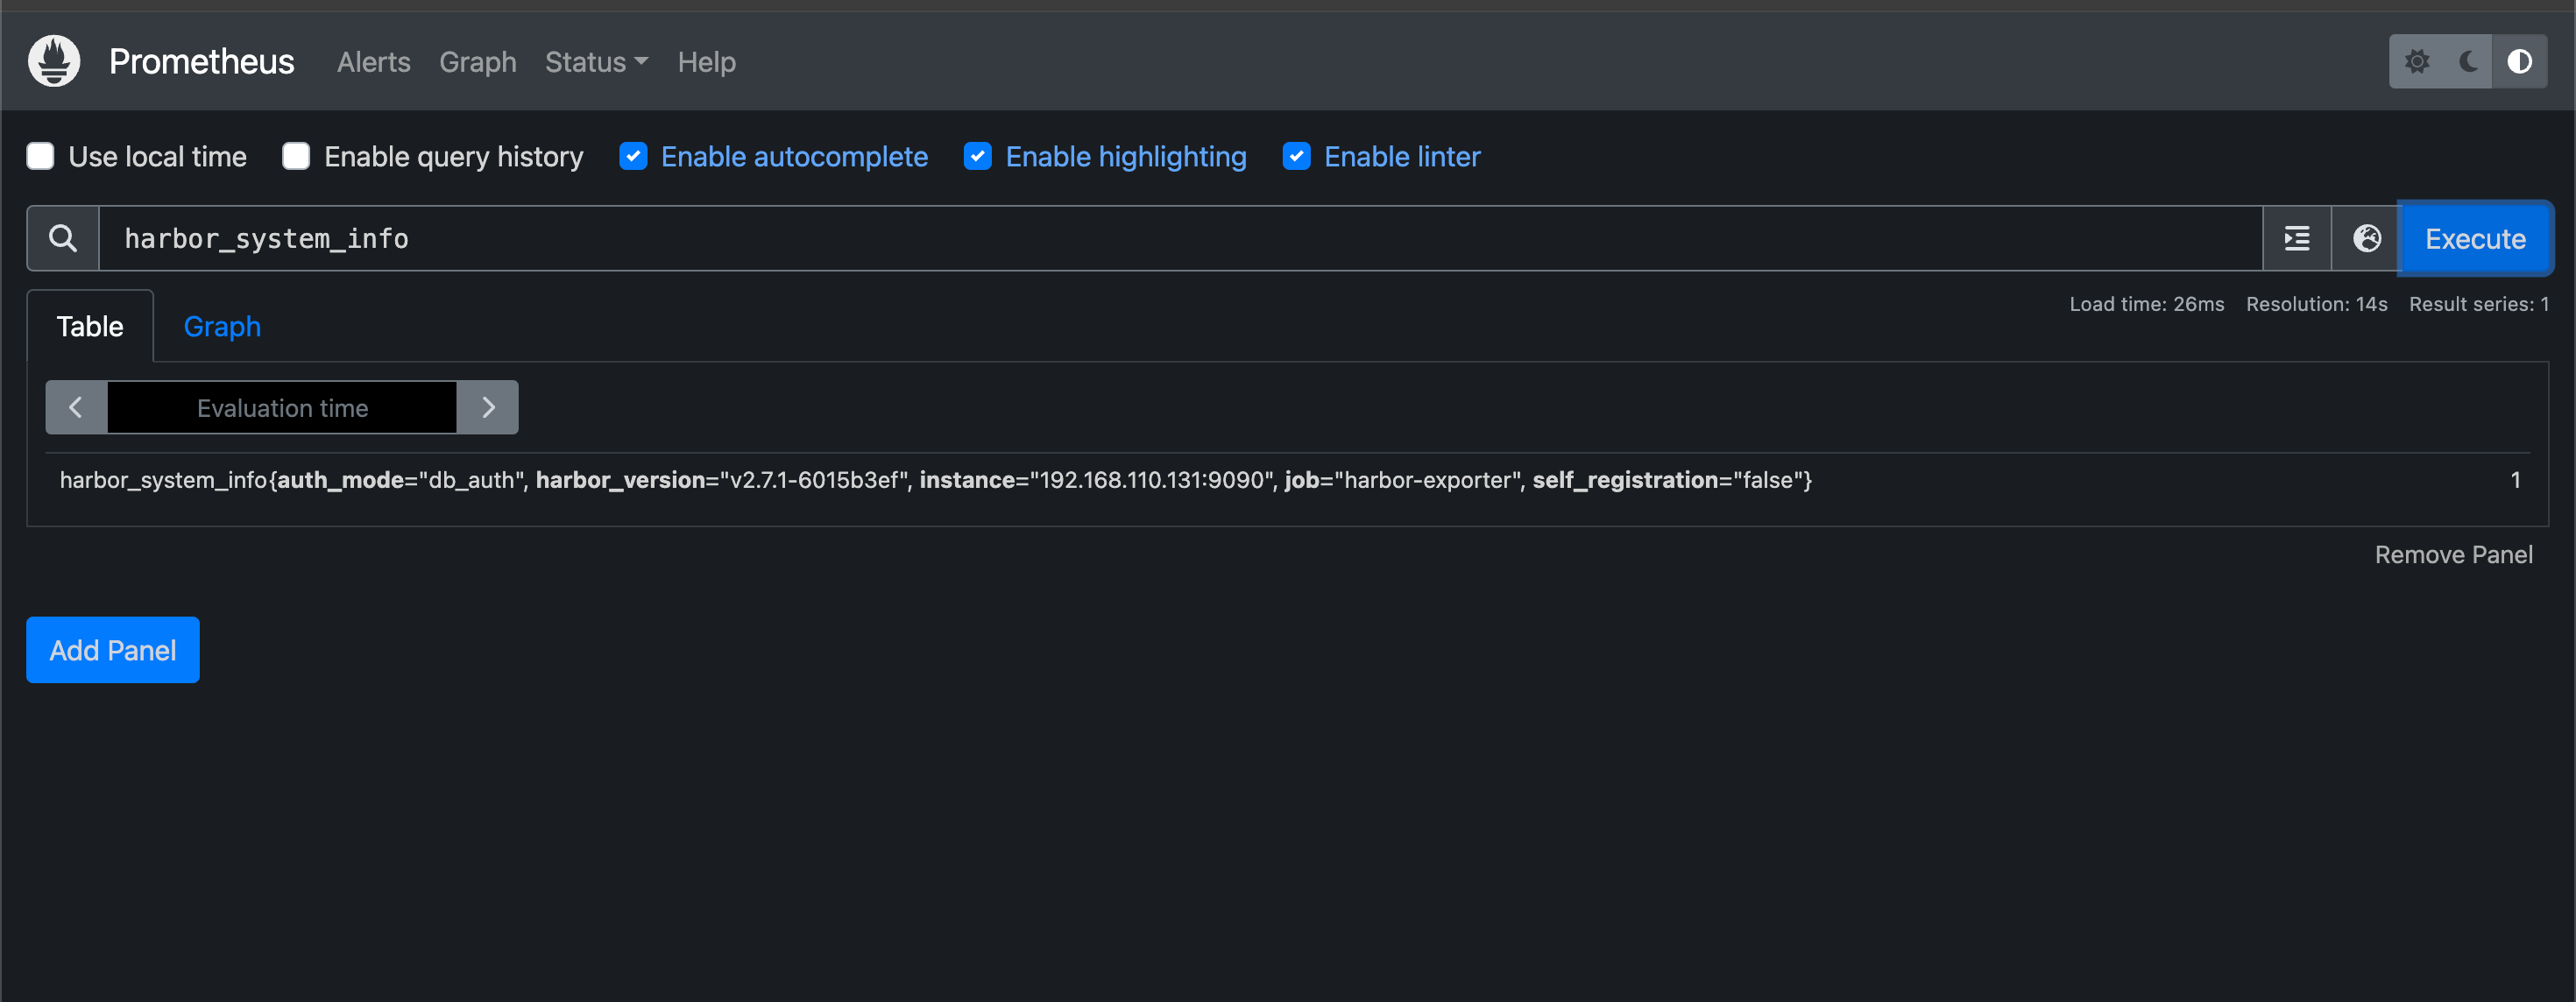
When the Prometheus scrape config is configured we should start getting metrics in Prometheus.
Grafana
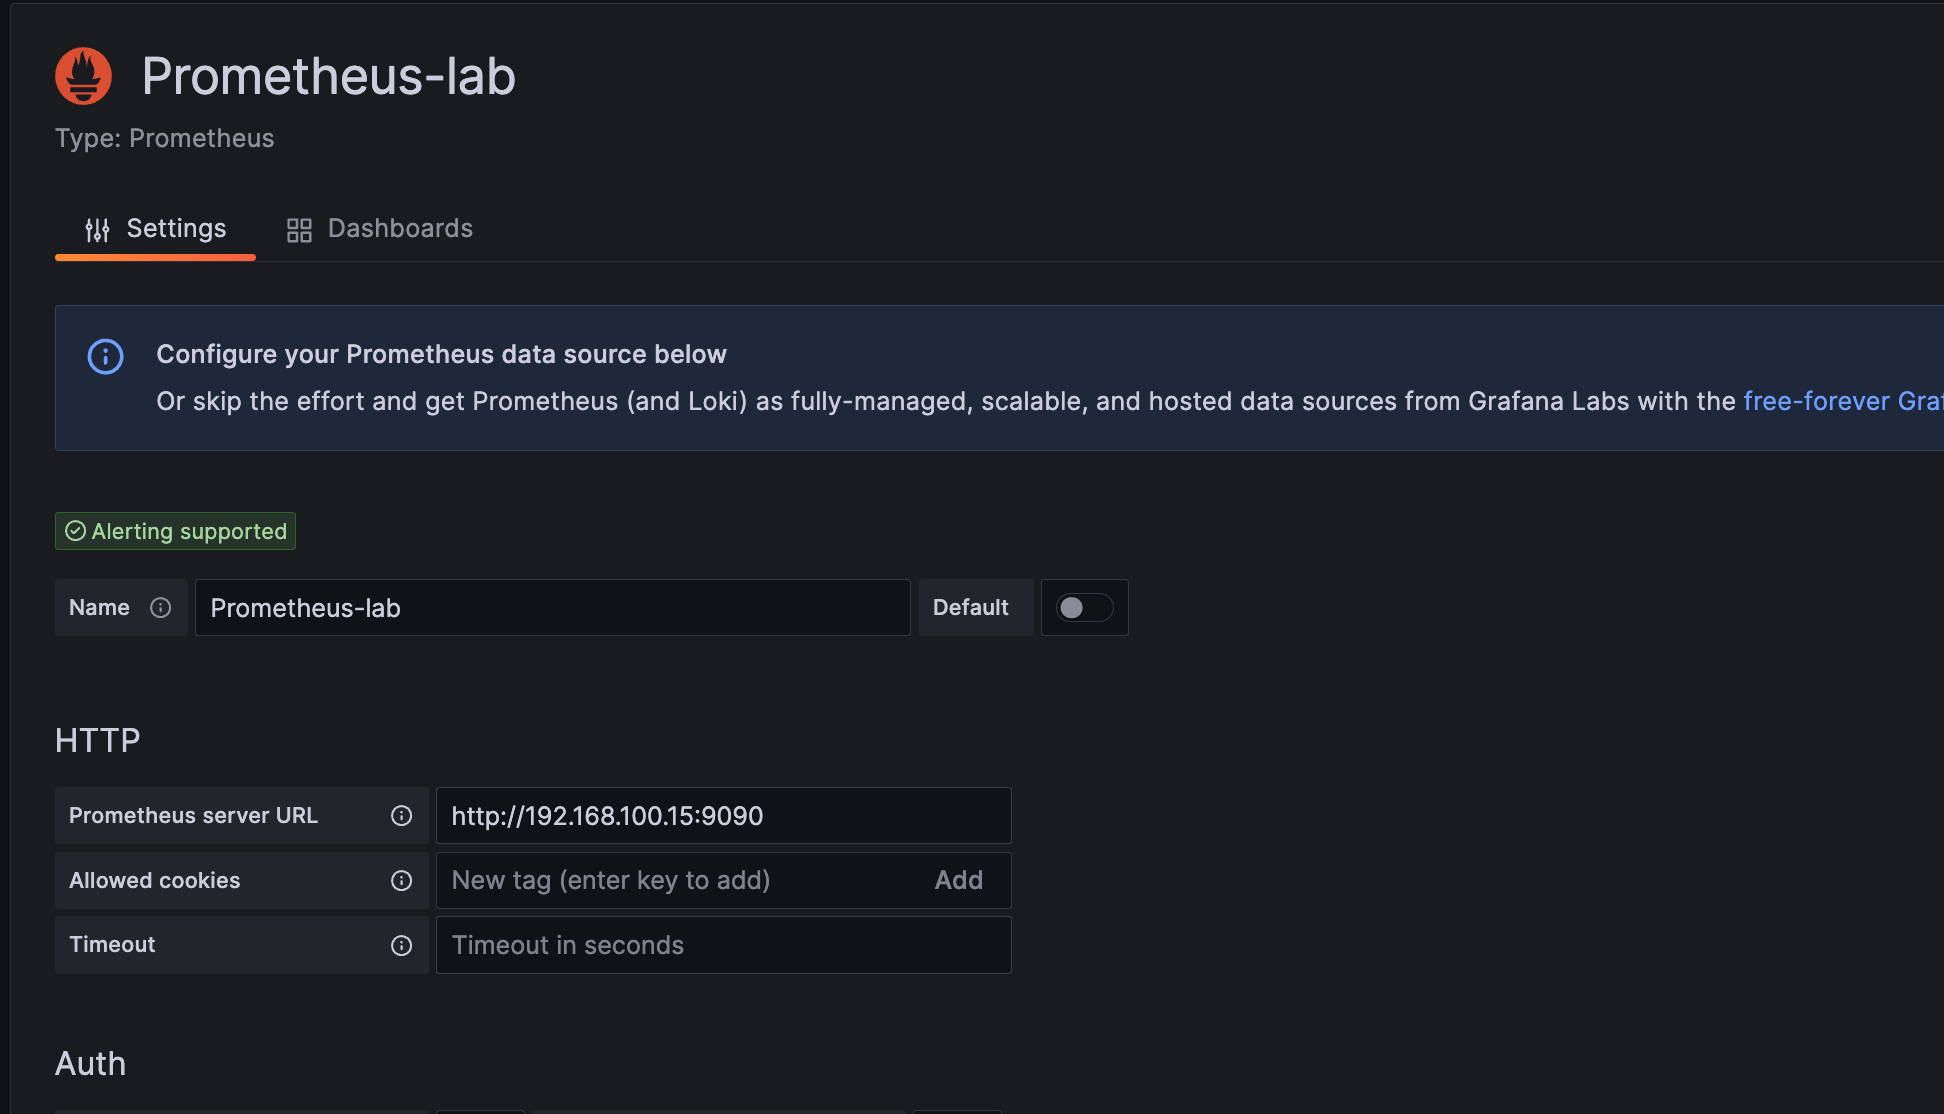
Over in Grafana we already have a datasource connected to the Prometheus instance
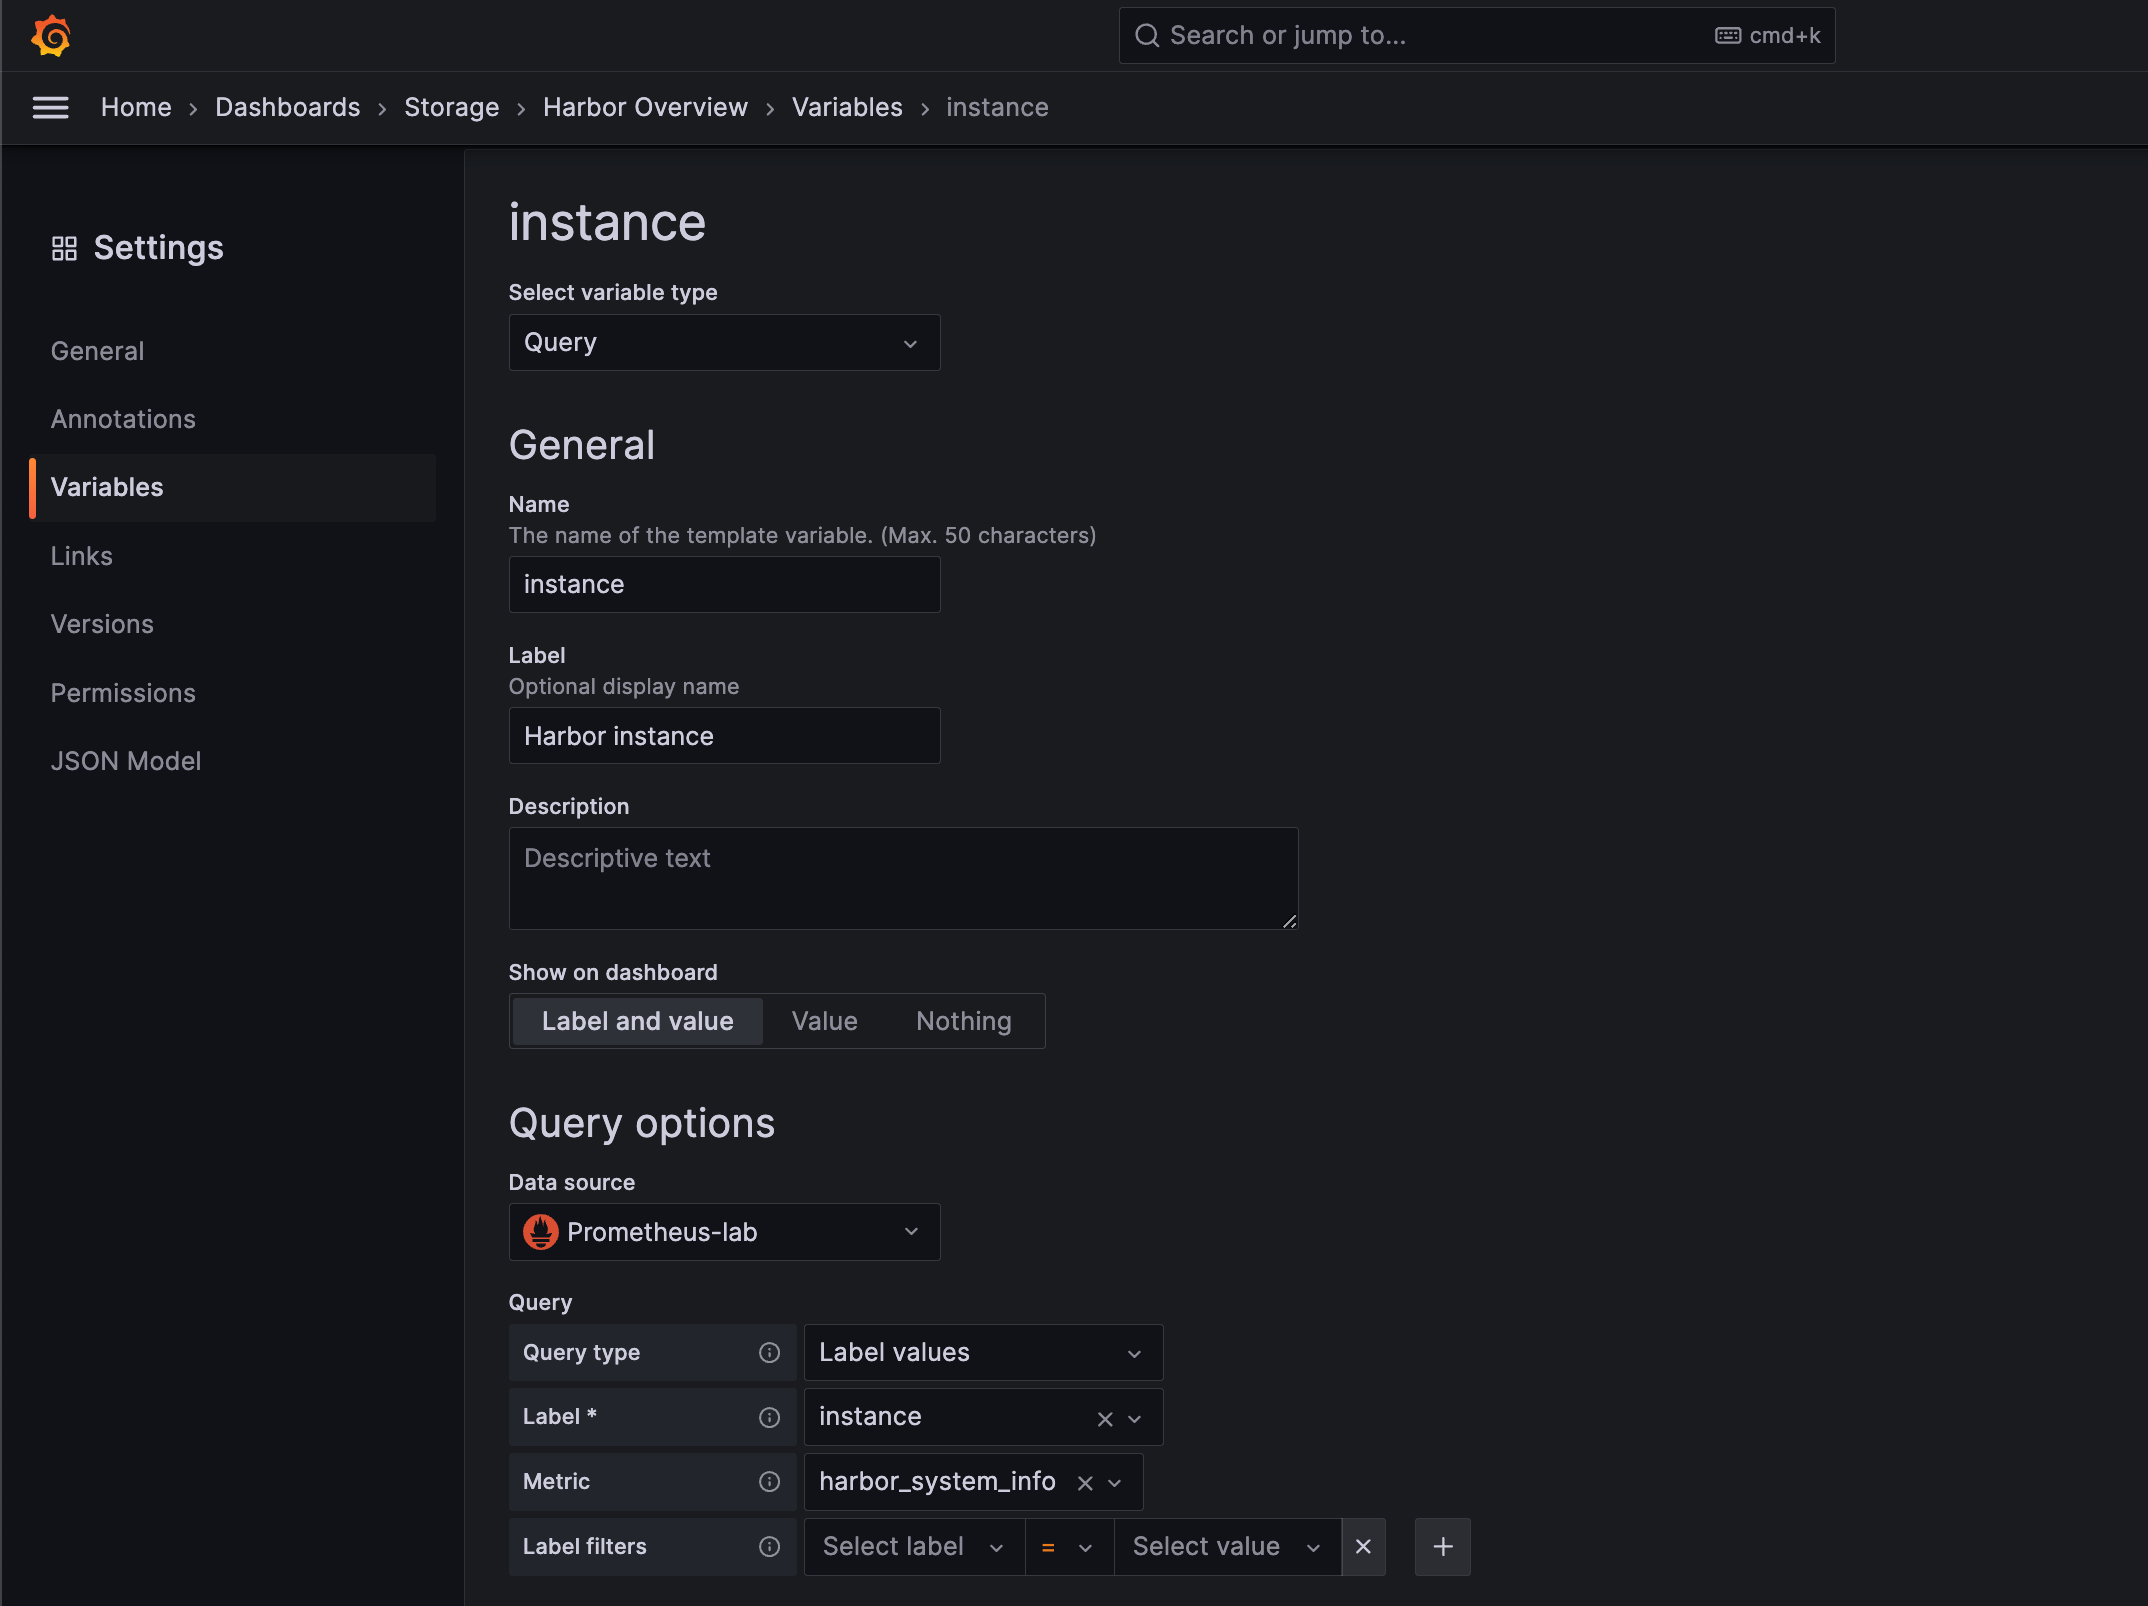
We've built out a dashboard where we have a variable for instances
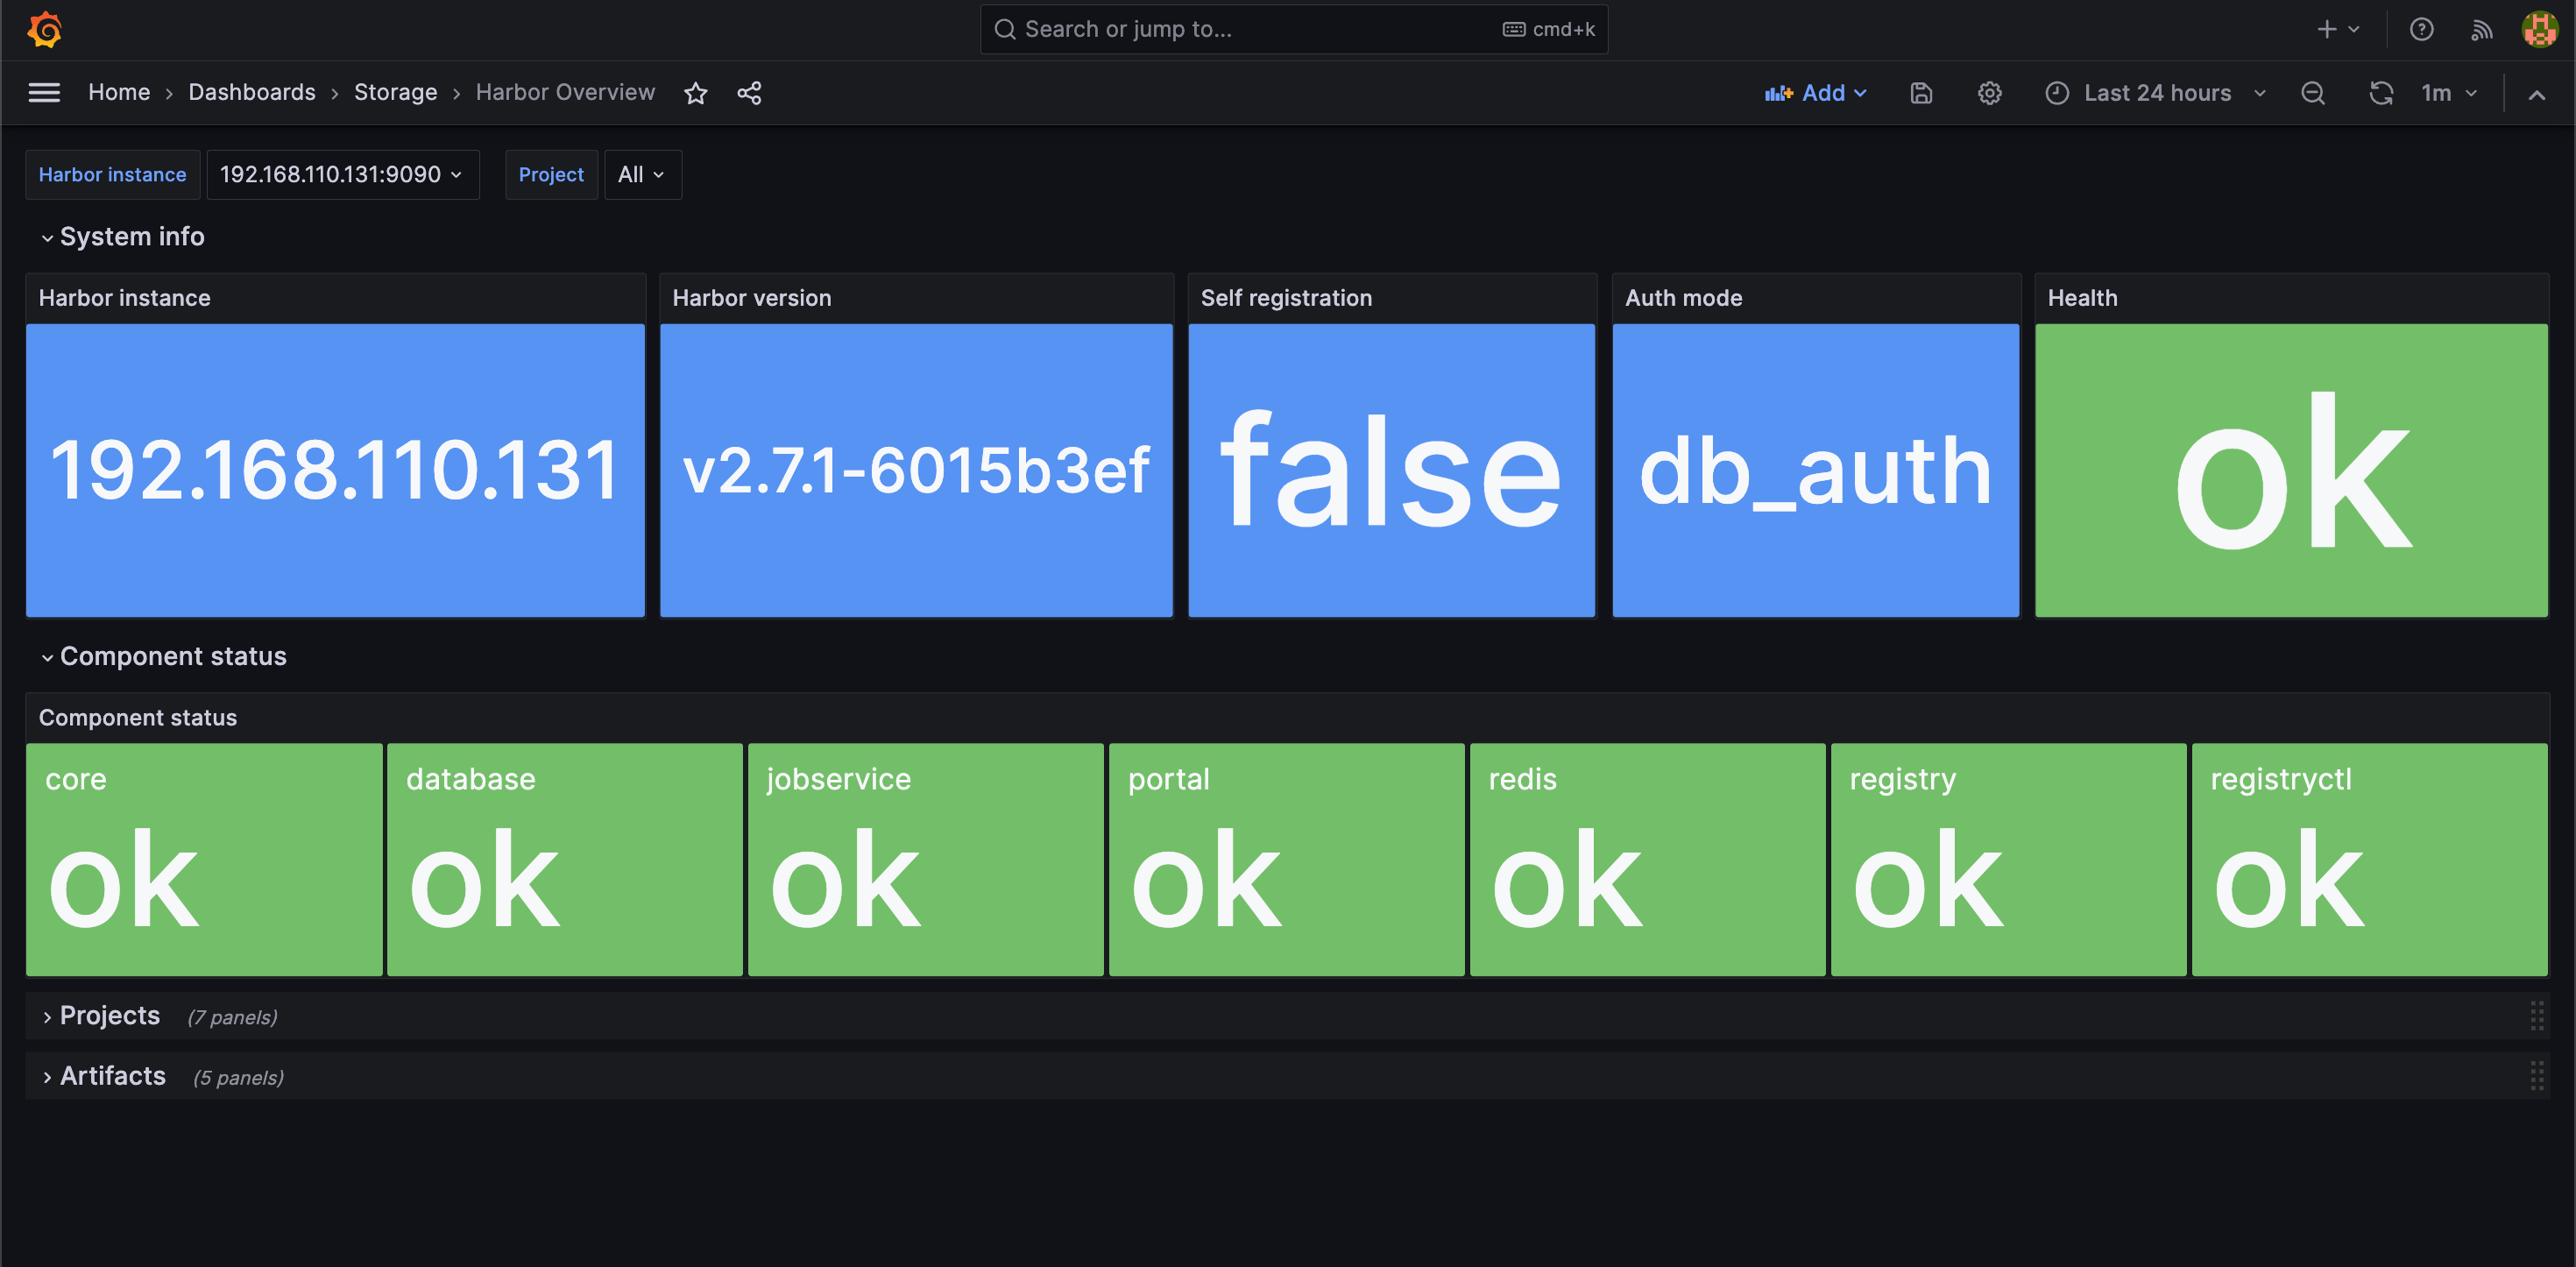
Our dashboard has rows for System info, Components, Projects and Artifacts.
The two first shows a quick overview of the status of the Harbor instance
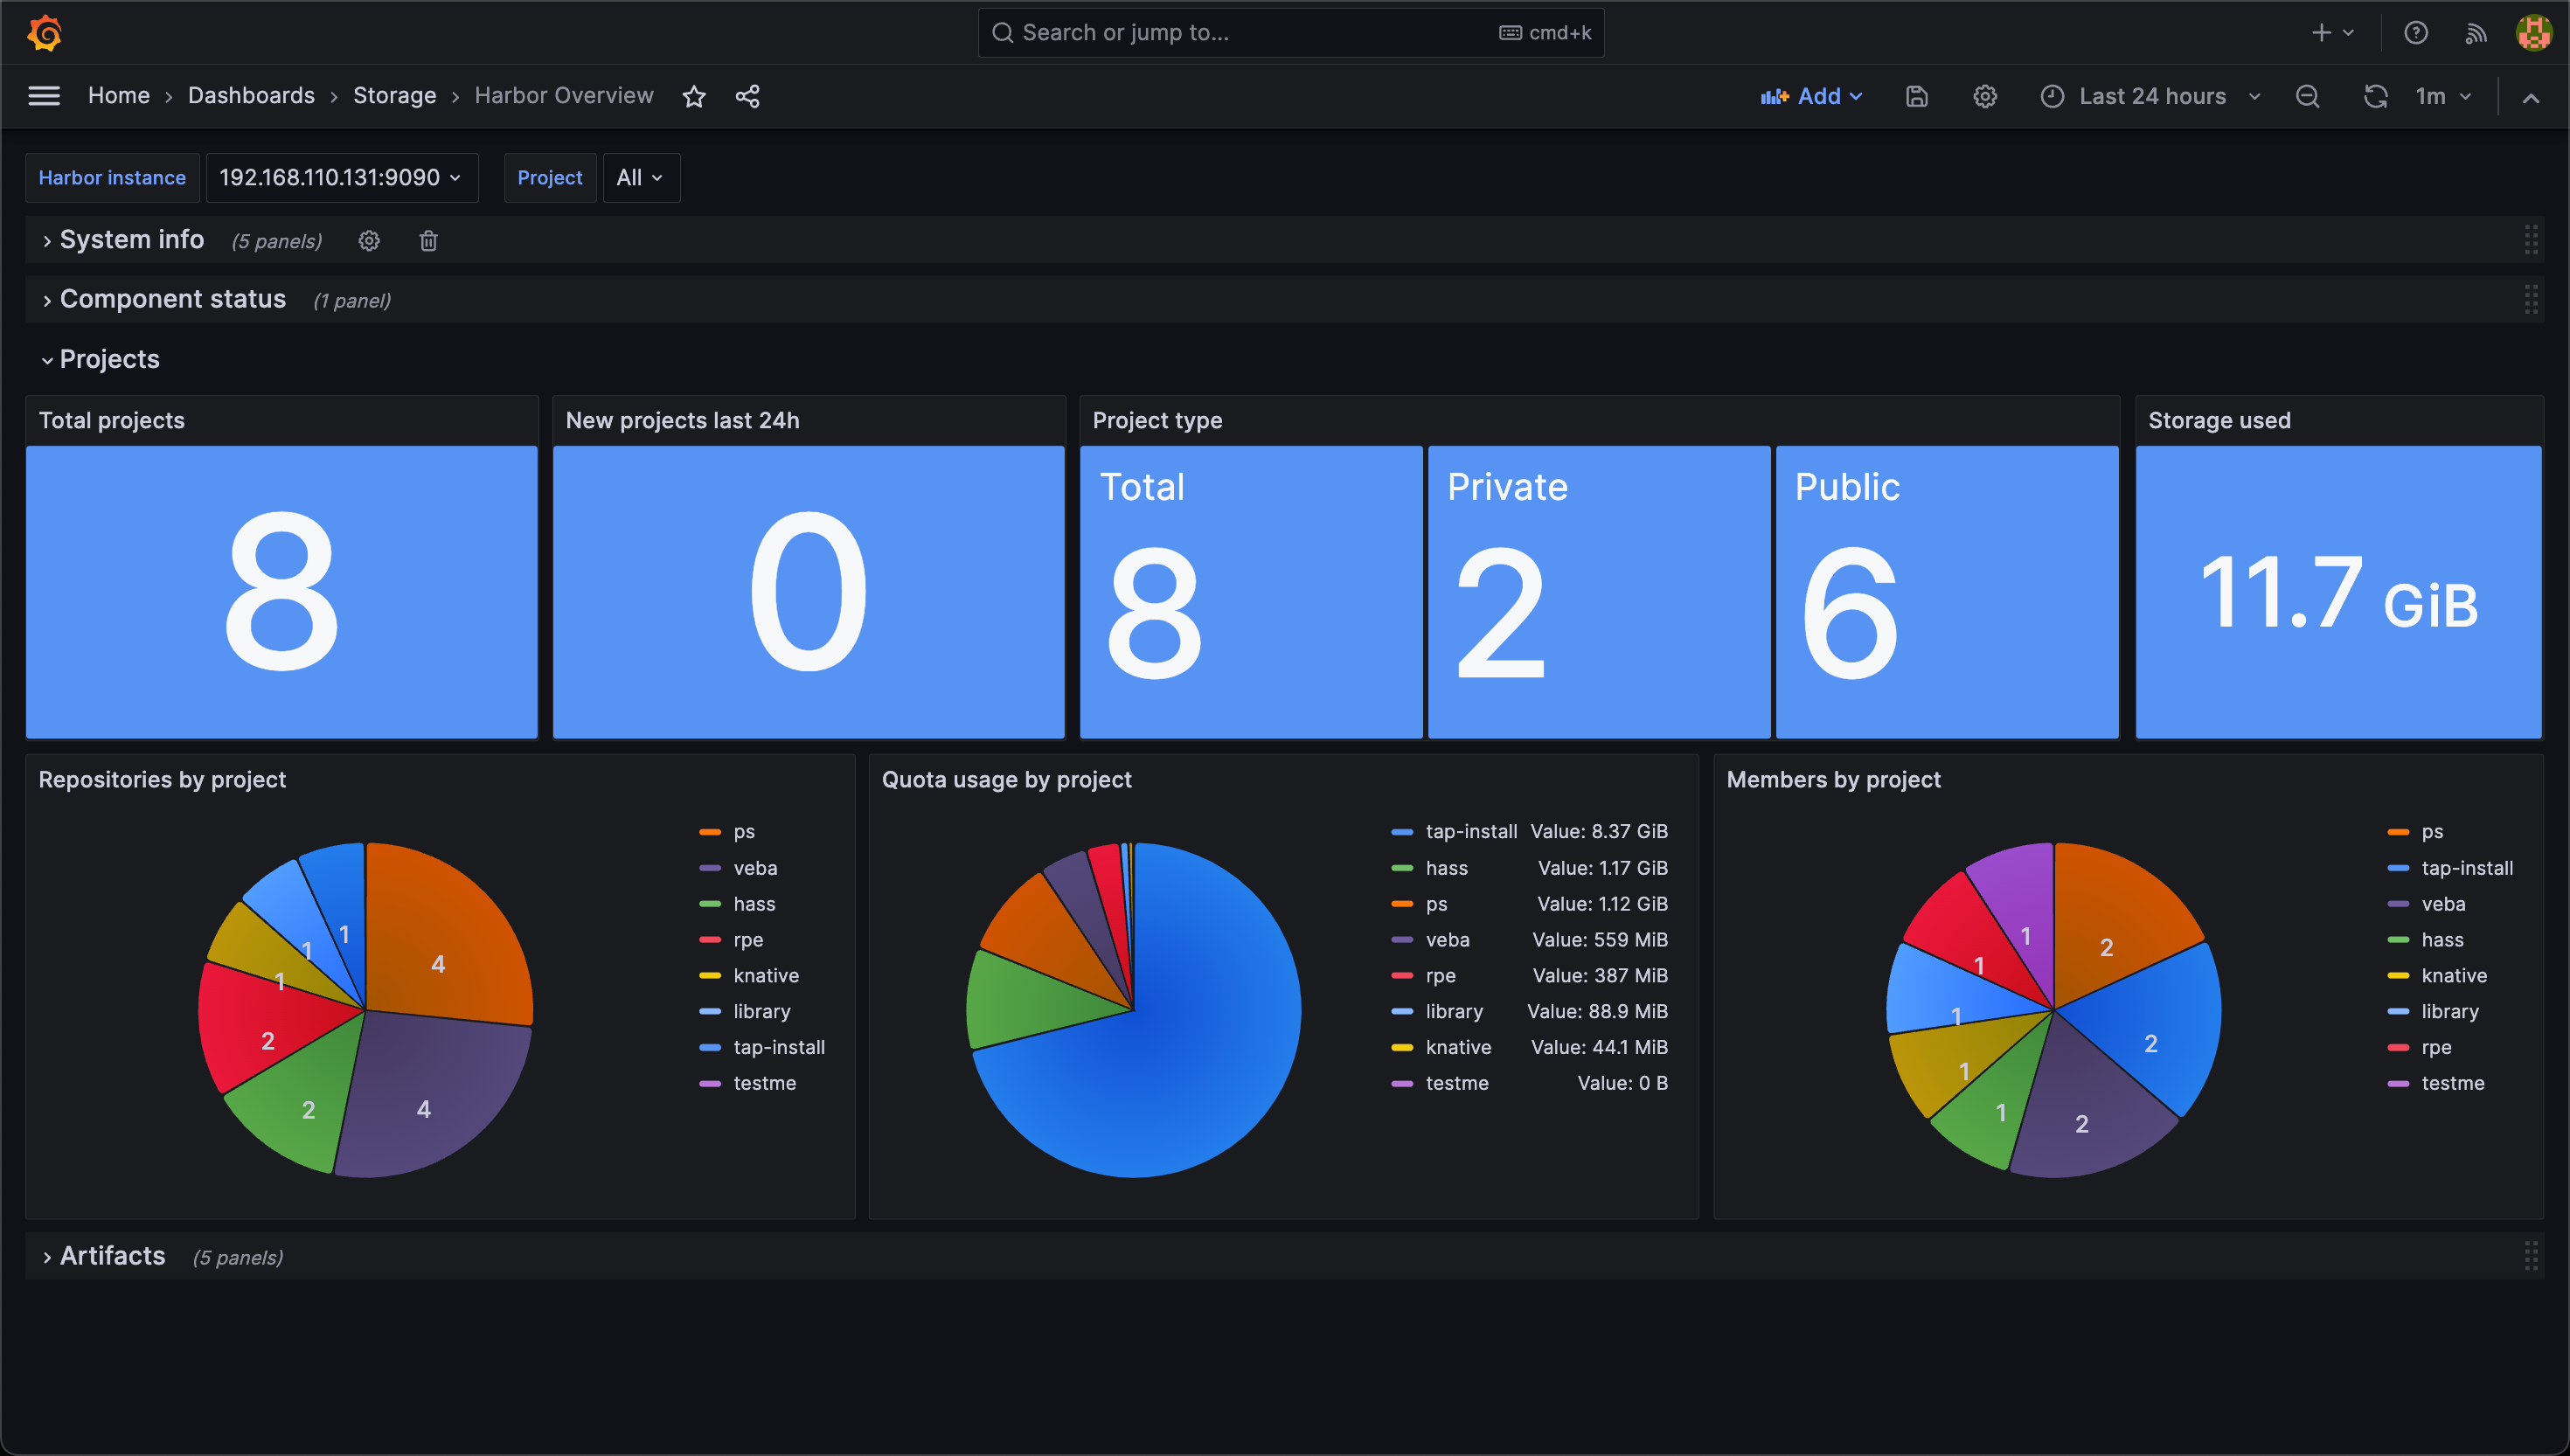
Next we have the Projects panels where we get some information about the different Projects created in the Harbor instance
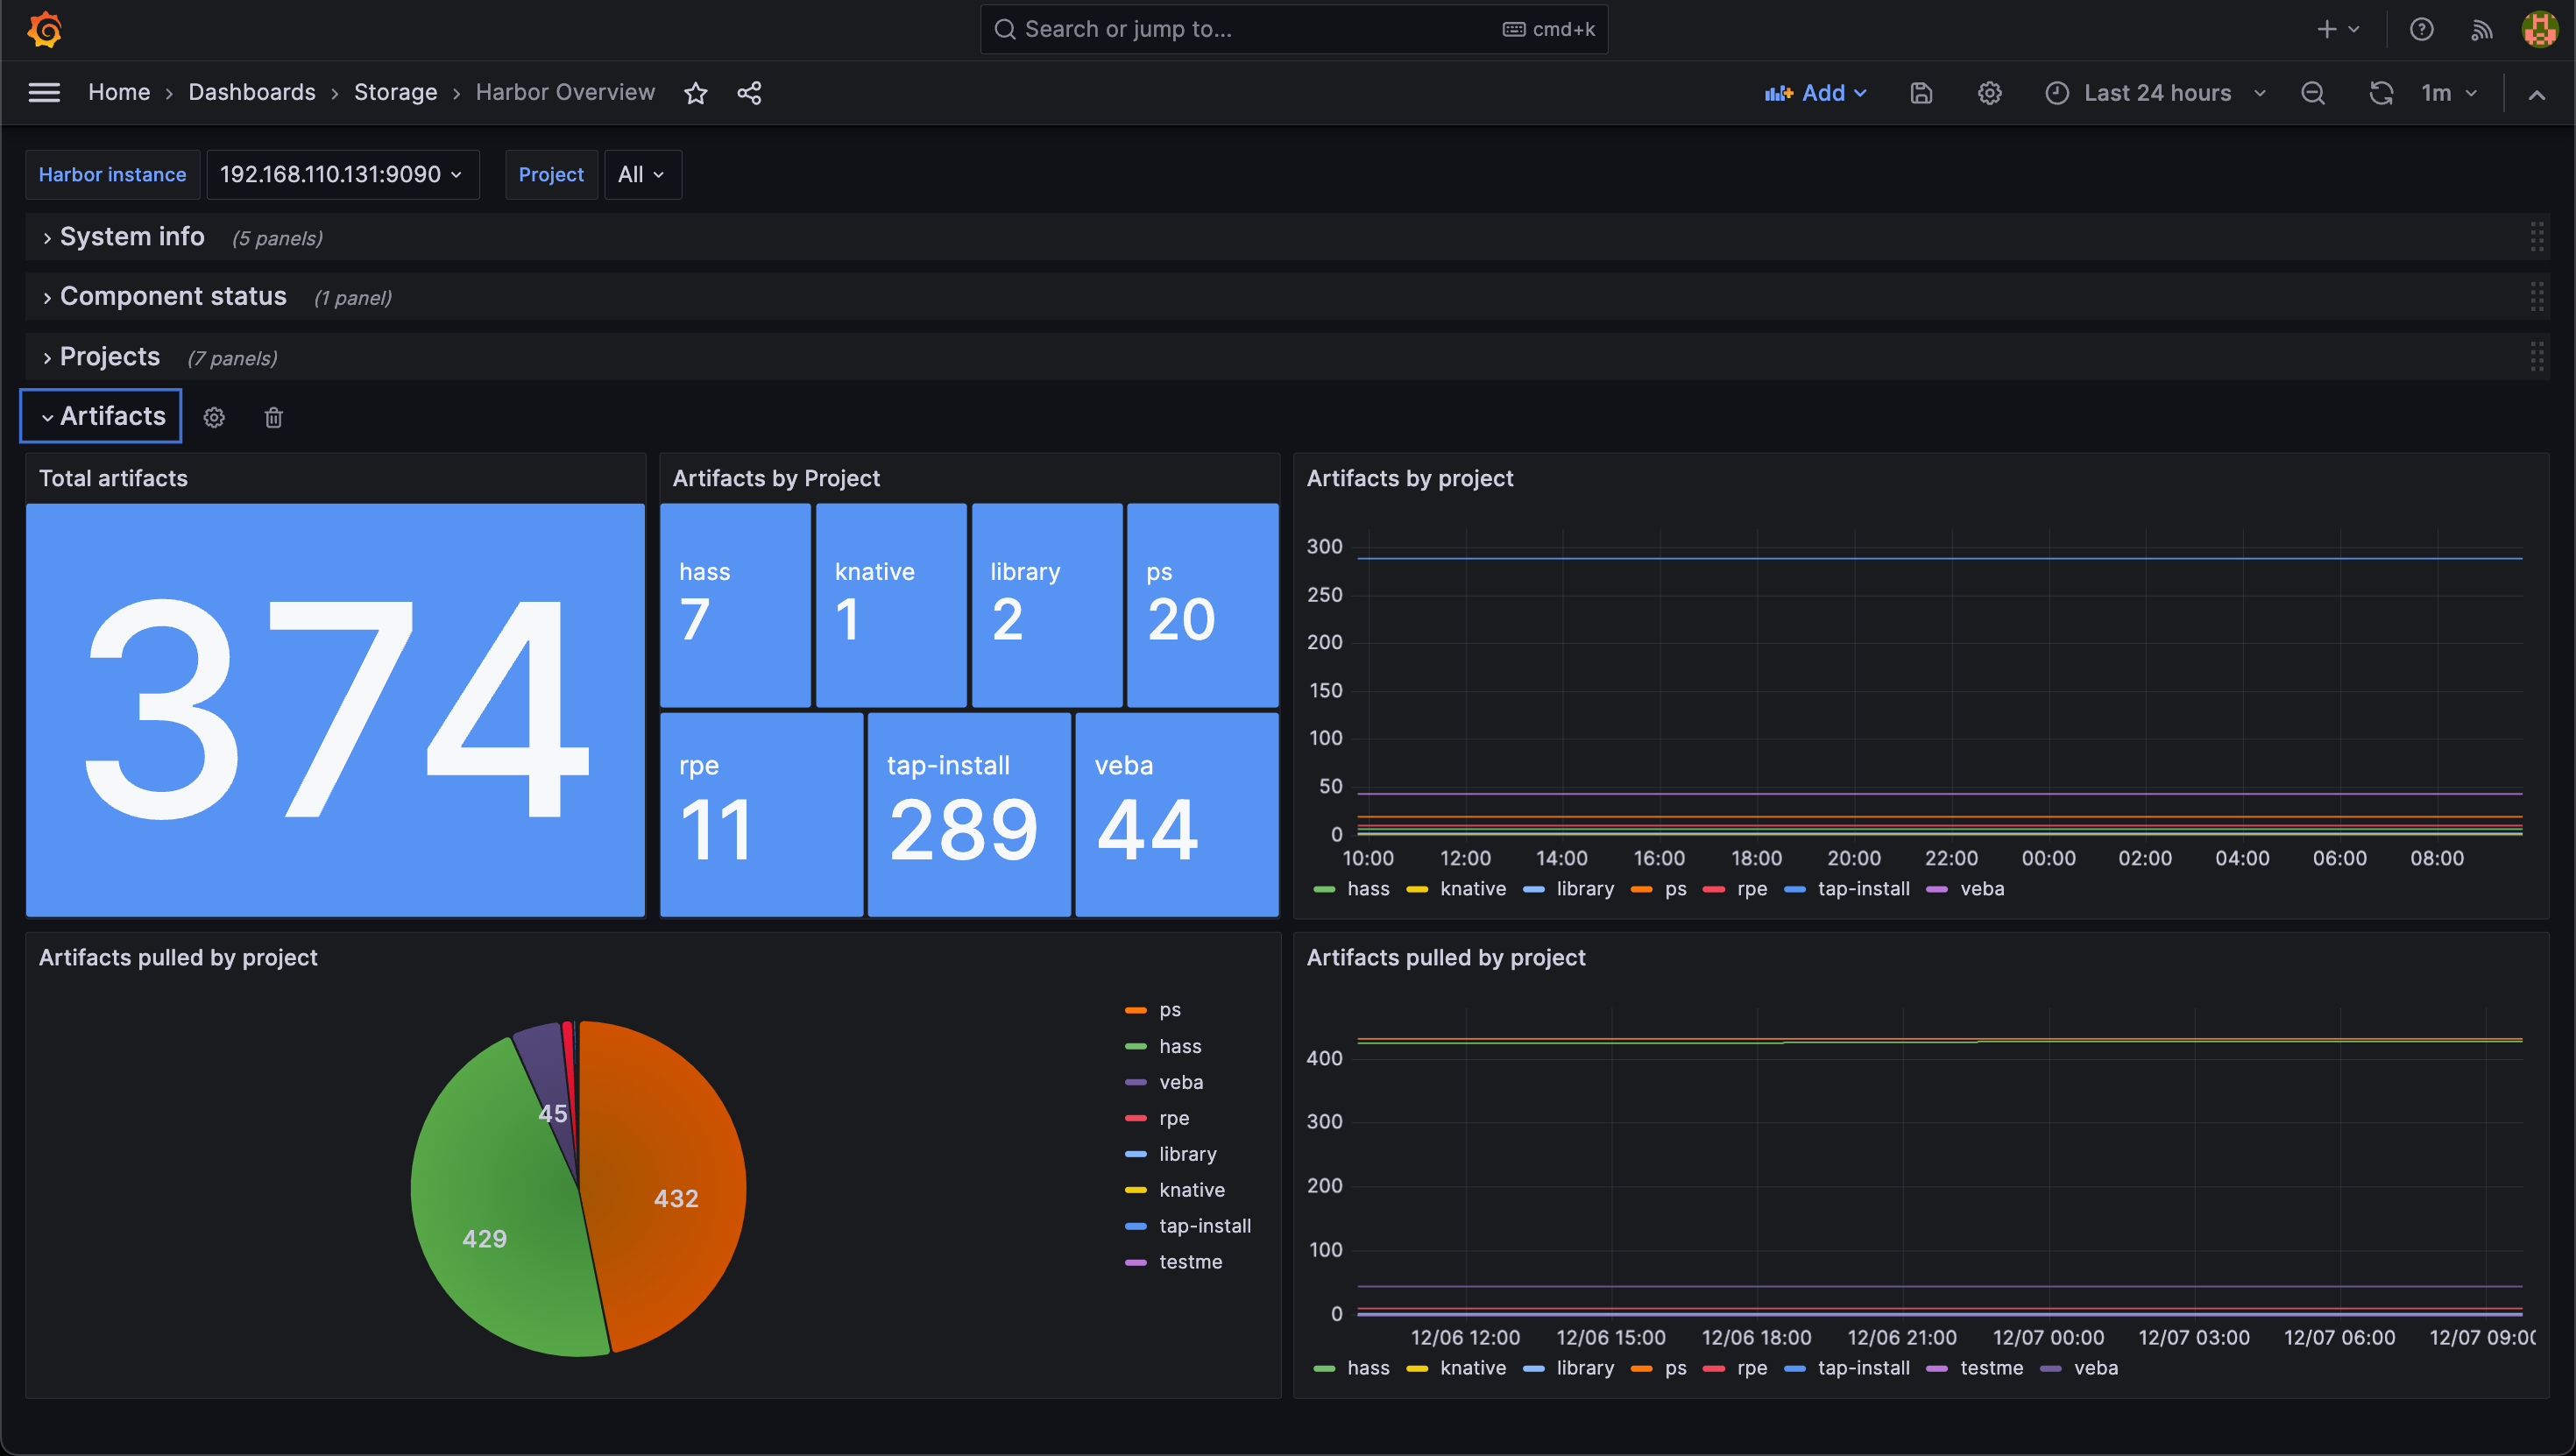
And finally we have the Artifacts panels
Summary
This was a short write-up of how to integrate Harbor with Prometheus and Grafana. With Prometheus supported metrics in Harbor this is very easy to get up and running.
The dashboard shown as an example in this post can be downloaded from Grafana.com or better yet directly to a Grafana instance with the dashboard id, 19716
Thanks for reading, please feel free to reach out if you have any questions or comments