Shipping Mikrotik firewall logs to vRealize Log Insight
Recently I installed a Mikrotik router at home and since I'm in my lab environment are running vRealize Log Insight (vRLI) and I'm using this as my Syslog server I wanted to push logs from the firewall to vRLI.
Since I couldn't find any content packs for Mikrotik I thought I'd take the opportunity to do a walkthrough of how to extract fields from syslog messages to get some value from them.
The first part of this blog will be how I've configured my Mikrotik router (yours might be different so you might have to adjust accordingly), the second part how I've extracted fields from the Syslog messages. Feel free to jump over either part.
Mikrotik remote syslog setup
To specify a remote Syslog server in the Mikrotik router we'll first create an action where we specify the Remote type and the details for our remote server.
Note that there are a few ways to do this. I know that vRLI supports RFC3164 syslog messages and that is what we'll get if we specify the BSD syslog option here. We're a bit ahead of things here, but the difference when outputted to vRLI isn't huge. In my case I like the latter so that's what we'll work with.
Here's a message without the BSD option selected. Hostname uses _gateway as the hostname
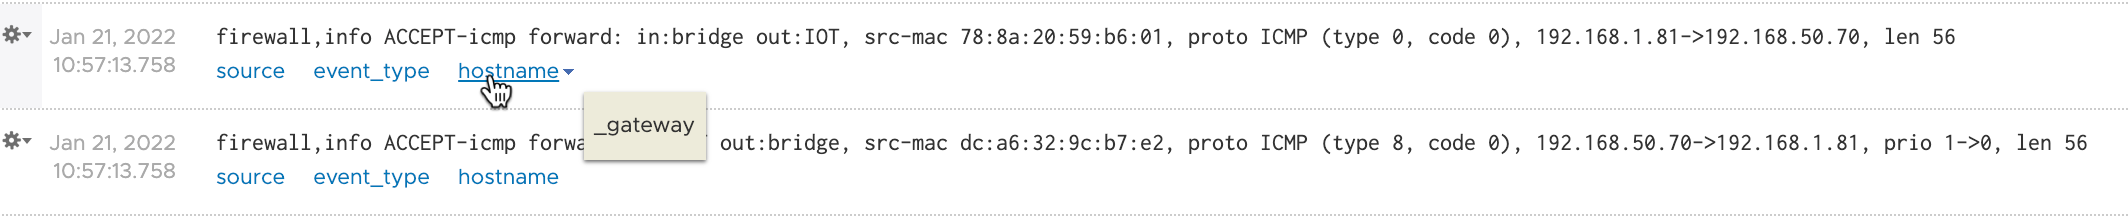
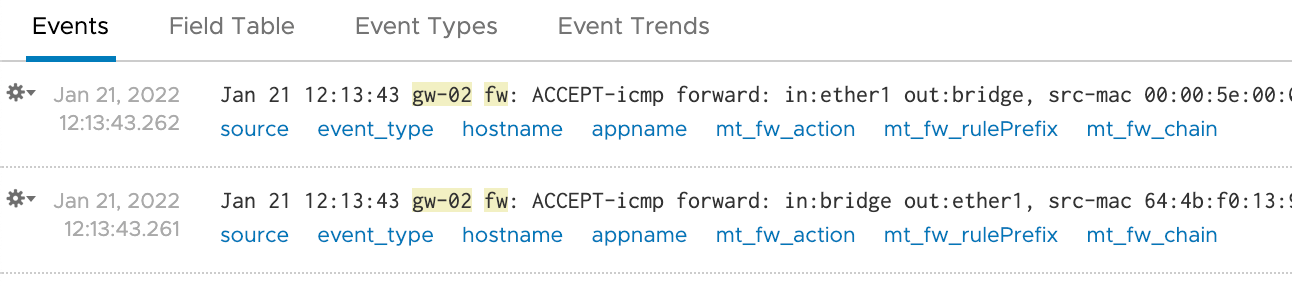
Here's a message with the BSD option selected, and a prefix specified in the rule (more on this later). Notice the hostname and appname fields. Hostname is now what I have as the identity of my router.

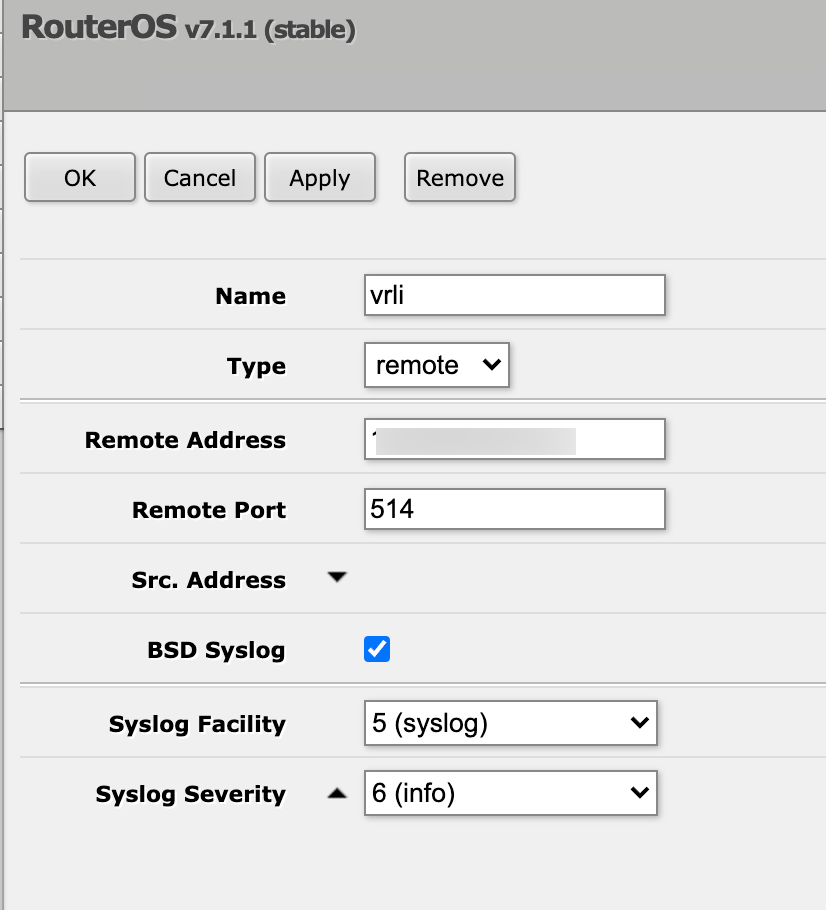
So let's create an action that points to our remote server and select the BSD option. I've set syslog as the facility and info as the severity (I haven't look at the rfc specification to see if this is correct, don't shoot me..)
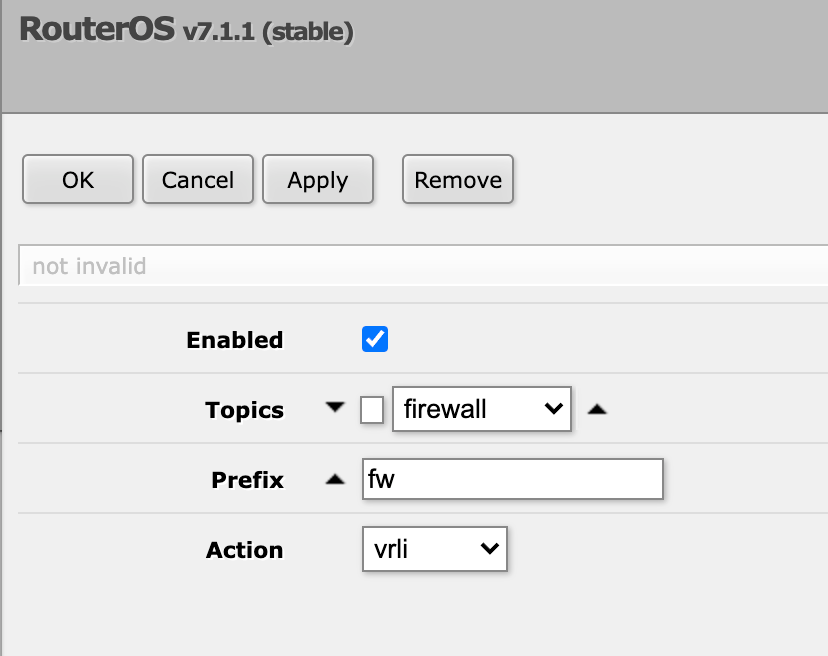
Second we need to create a rule that uses this action. Here we'll set Firewall as the topic and then select the newly created action. Note that we can prefix our messages here and I'll set fw as my prefix which eventually set this as the appname in the syslog message.
Mikrotik firewall rules
Now to tell our router to push logs to vRLI we have to specify the individual rules to log the action and we can add a prefix to the log entry
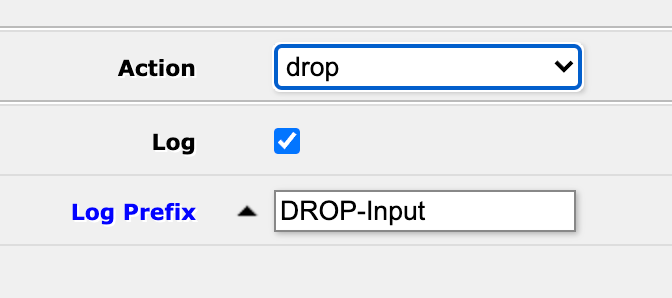
Let's see an example with this default rule that will drop all input that doesn't come from our LAN (and which has not been hit by a previous rule)

Down in the action section this is set to drop so we'll check the log checkbox and we'll set a prefix. I have my own kind of semi-standard for this where I start with the action, DROP in this case, then I have a short descriptive part to understand the rule. Here we might have i.e. the rule number or some other description, but for now I'm fine with this approach. The important part here is that we will use this later on in vRLI so we need to have some kind of a standard thinking about it.
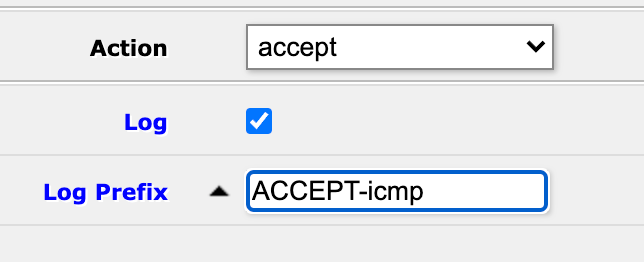
Let's also add an example from an accept rule so we can work with different log entries. We'll use the an ICMP accept rule for this which uses a different chain than before (forward)

And we'll log the action and specify a prefix for it
That's all that is needed in Mikrotik. Now, let's head over to vRLI and see if we have som log entries there.
vRLI log entries
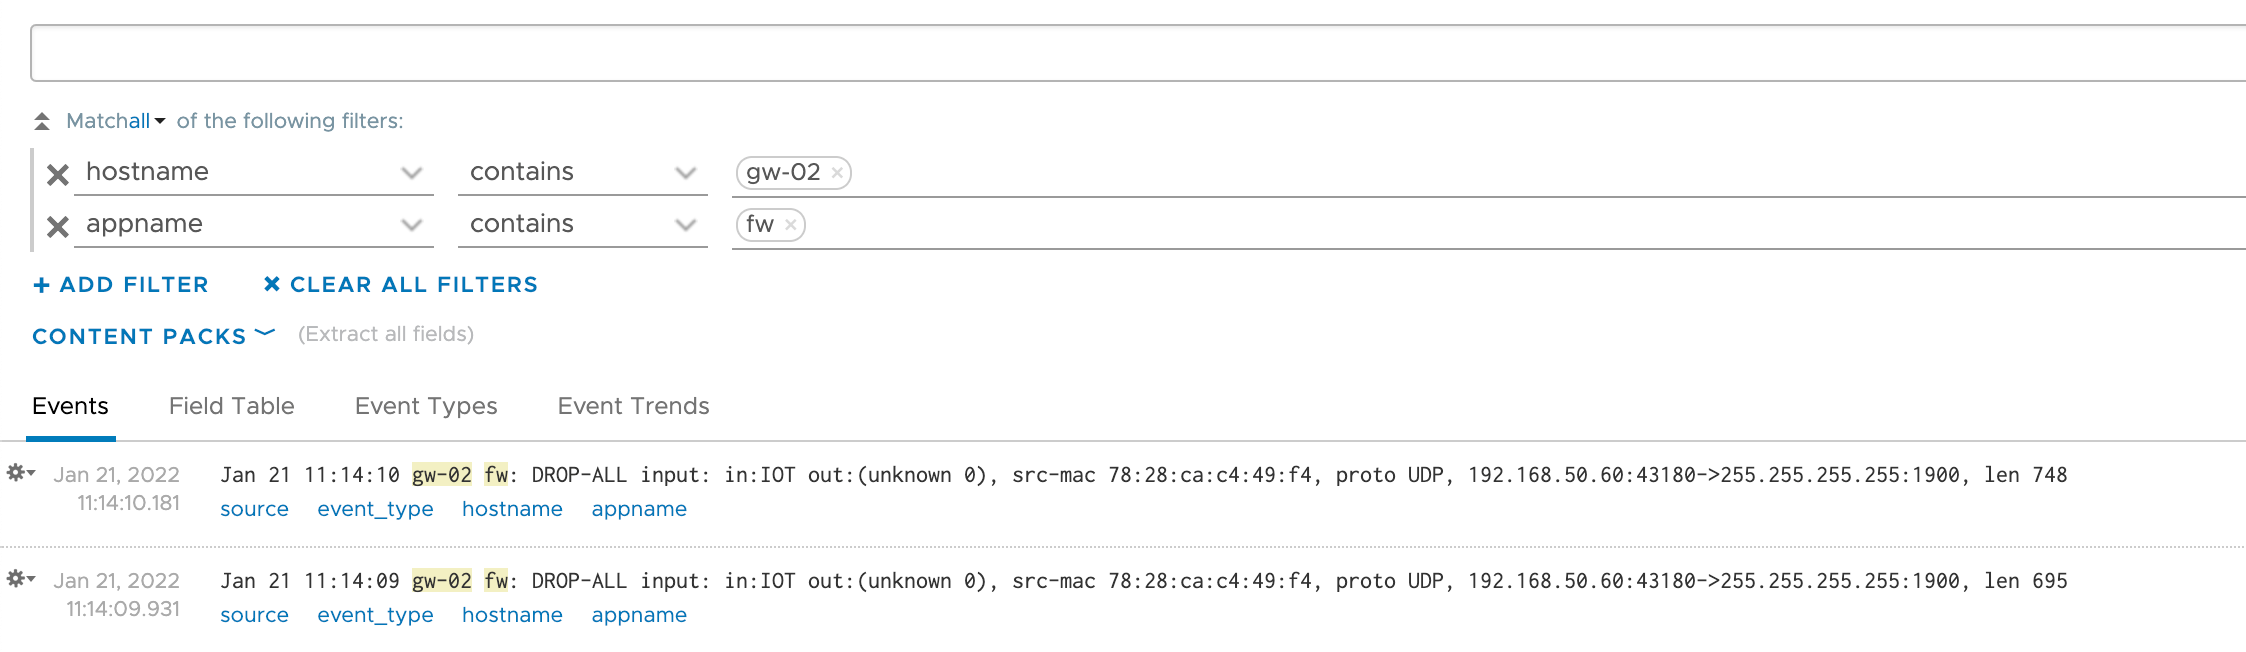
In vRLI should start seeing message like the following

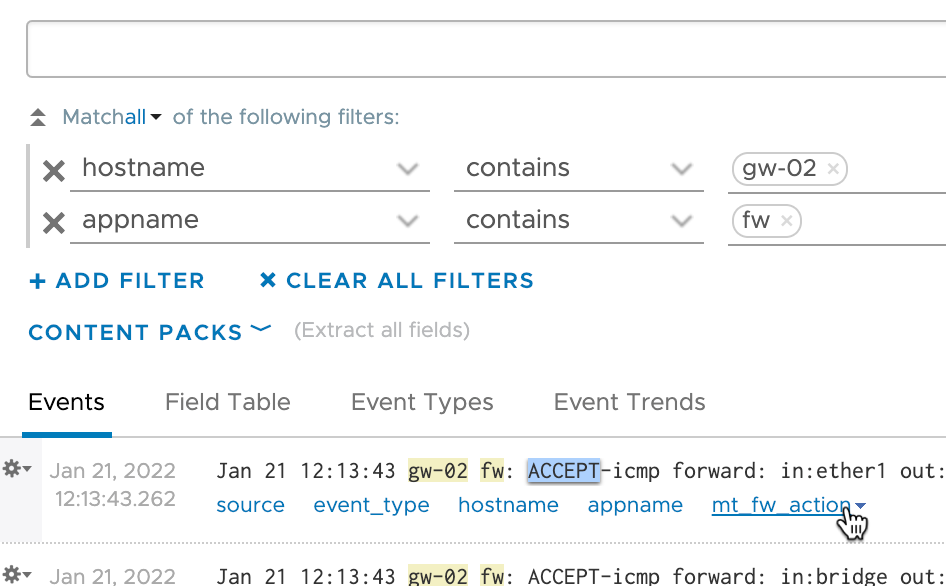
With the hostname and the appname we can filter on these messages
Extracting fields
The ability to filter on the router hostname and the firewall messages is good, but I would also want to filter on more specific things (like the IP addresses, the interfaces and so forth) and eventually build some graphs. To be able to do this we need to extract fields
What I want to extract is the following: The log prefix, chain, in and out interfaces, protocol, source and destination ip and ports
Note that the extraction is done by parsing the log events and look for specific text based on the structure of the message. This means that if you for instance have a different standard for your prefix'es you might need to adjust the following examples
The log prefix will be split in two parts. The first part will be the action, and the second part will be the rule identifier
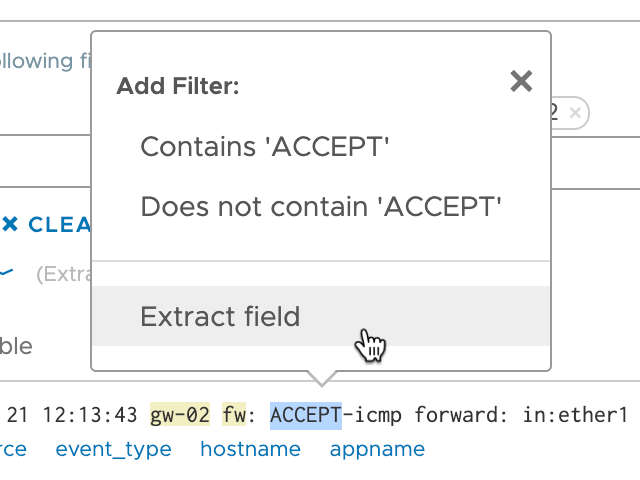
Note that the field extractor will suggest how to extract a field with the specific text and the specific place in the structure based on this very event
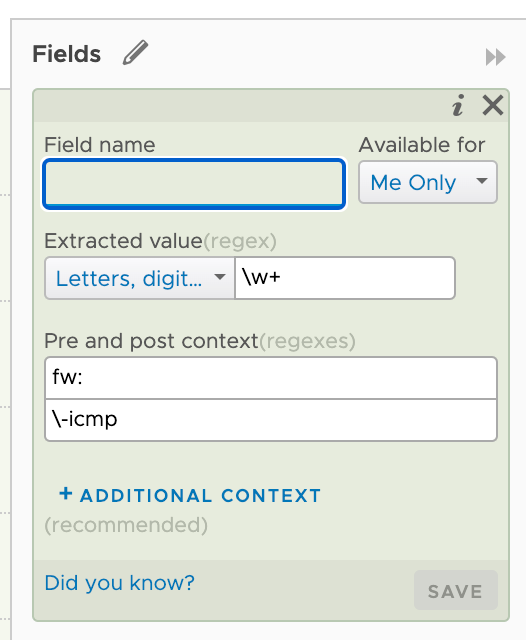
I'll adjust this by doing some regex'ing. I'm specifying that the field can have either the text ACCEPT or DROP as this is what I'll use for my rule prefix. I've also set the post context to accept any word after the dash
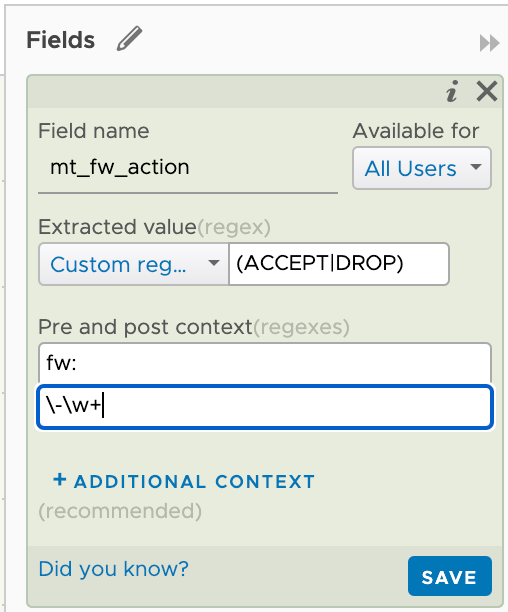
Note that I'm giving the field my custom name and that I'm also setting this to be available for all users.
By hitting Save in the field extractor the field gets created and we can use it in our filter
I'll do the same for extracting the description from the prefix. Here I'll specify again that it's preceded by either ACCEPT or DROP and then a dash. After the field there should be a whitespace character, then a word that should be either input, output or forward. This will map to the chain the traffic is coming from.
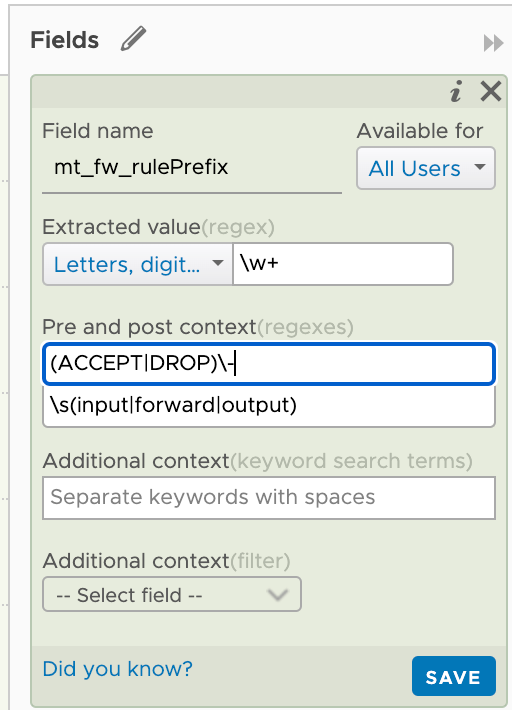
The chain field will match input, output or forward. And should be preceeded by a word separated by a dash and then followed by a whitespace character. The field should be followed by ": in"
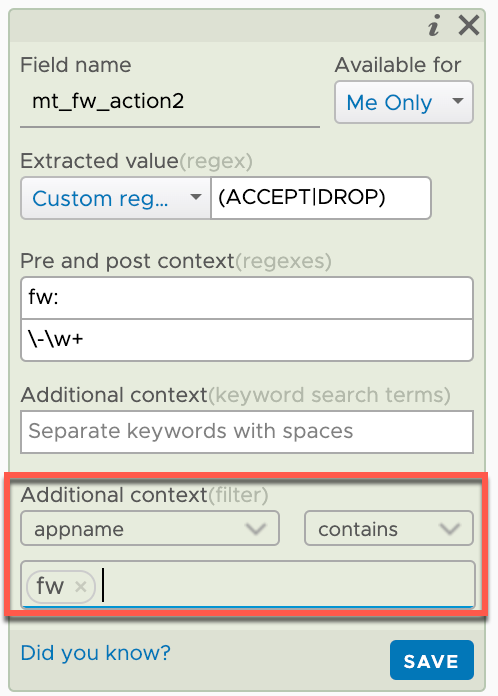
Note that we could also make use of the Additional context to further filter the entries to match by searching for i.e. appname contains fw
We're starting to get a few fields available to us and hopefully you get the point on how to extract them
I won't detail the rest of the fields, but after extracting what I want my list of extracted fields looks like this
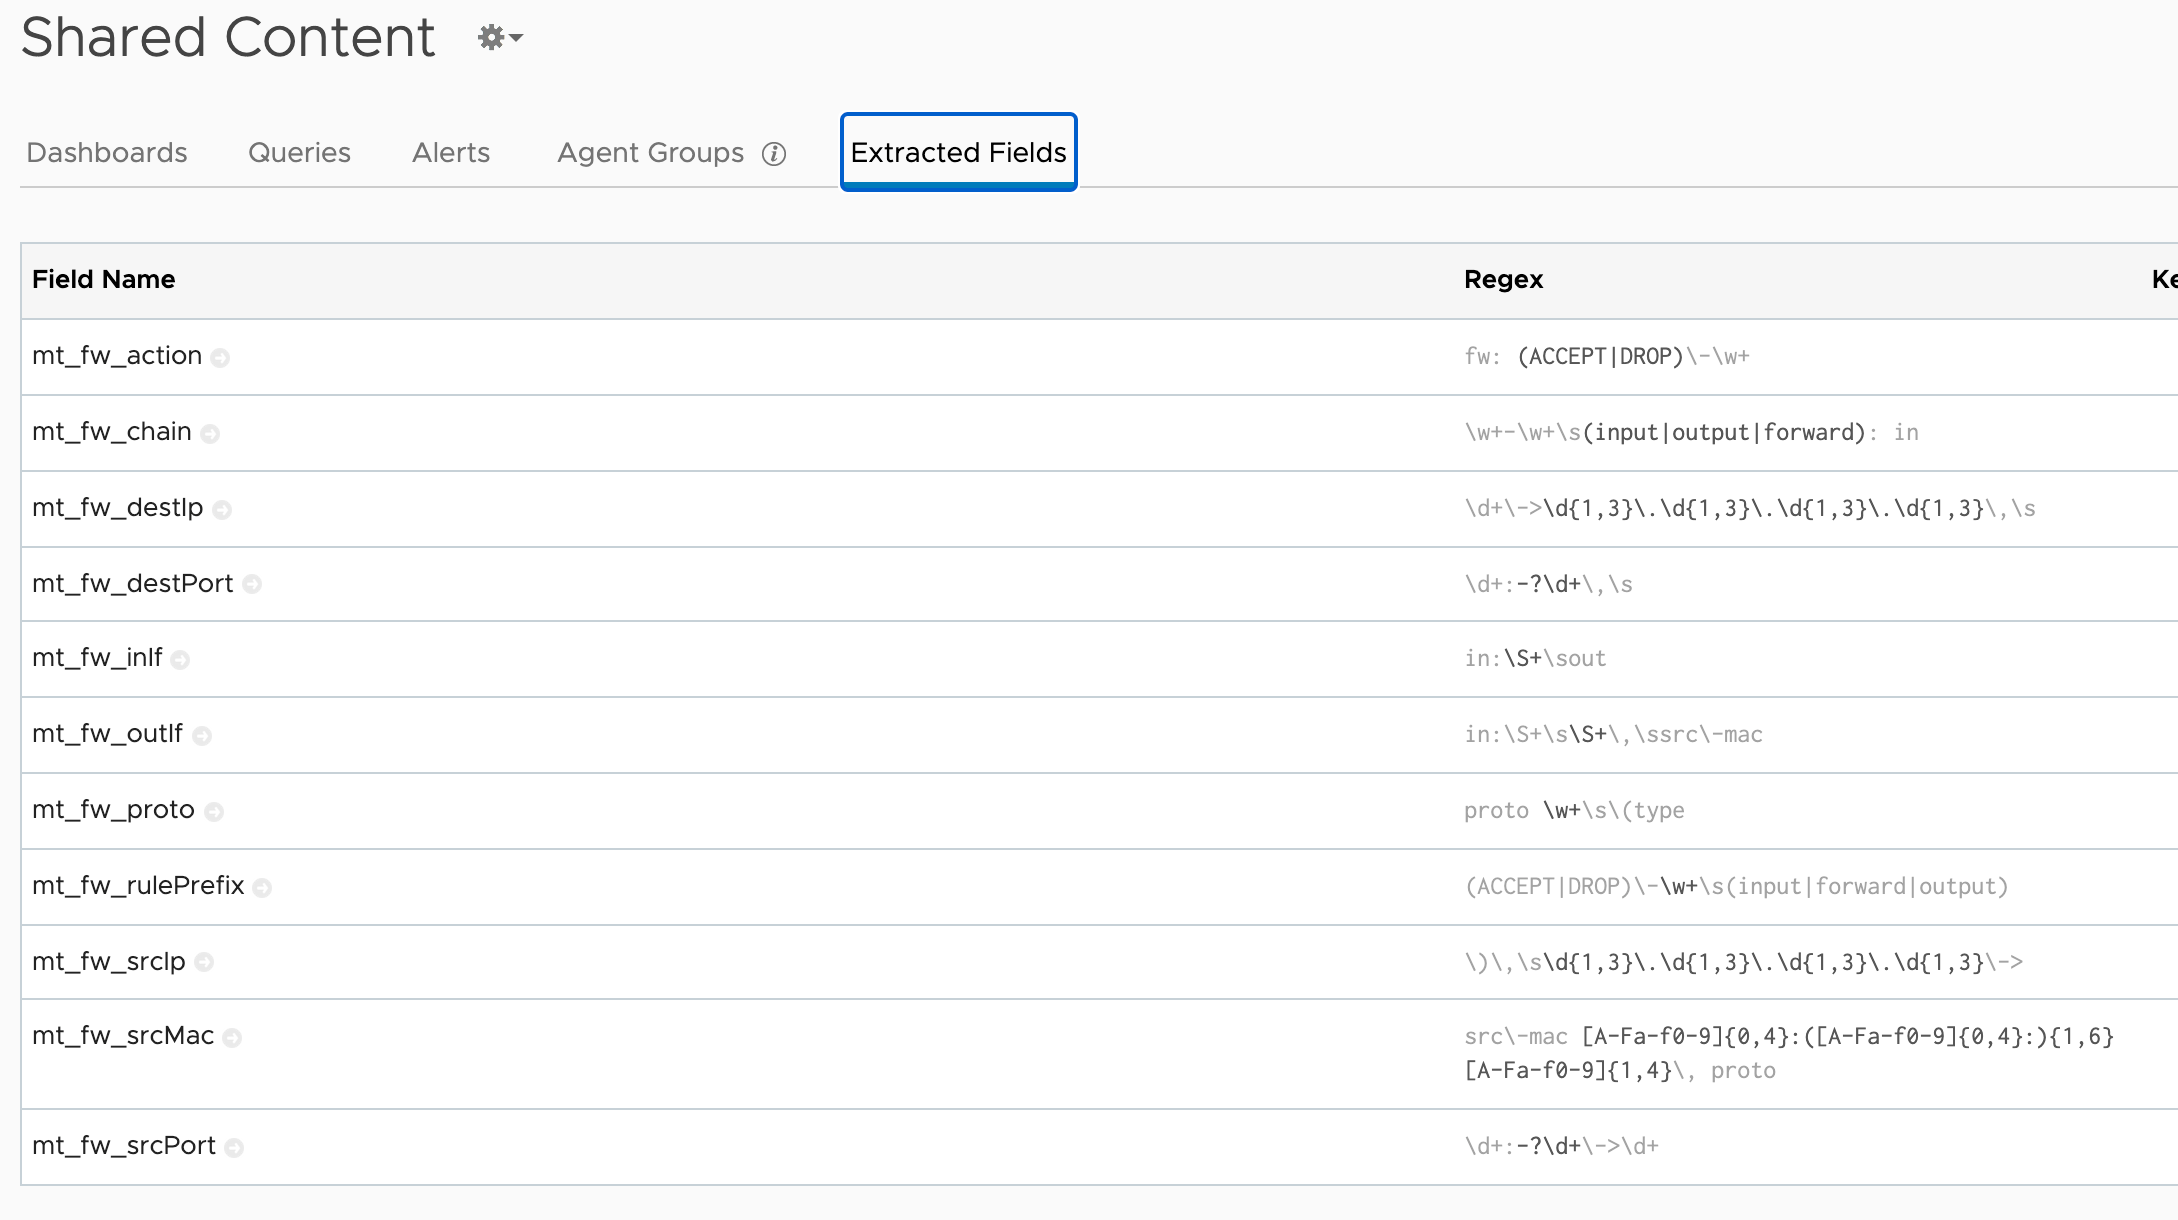
Note that when I grabbed this screenshot I see that I haven't been paying enough attention to the whitespaces in the regex extractions. Even though the queries work I like to specify whitespace with
\s
Charting
Now with the fields in place we can use them to filter the events, but also by building some meaningful charts with them.
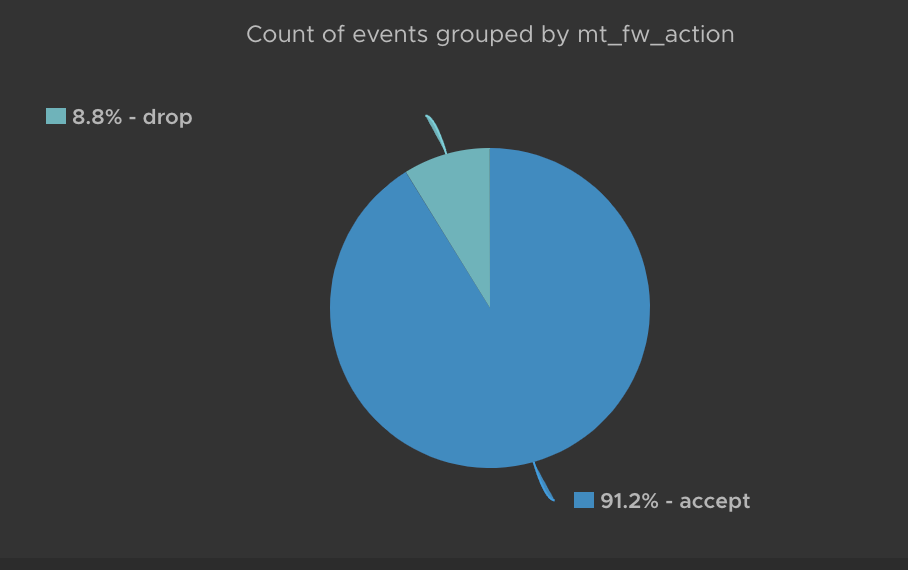
A simple example would be this pie chart that shows Accept rule hits vs Drop rule hits (obviously for logged traffic only)
Going forward I'll build a dashboard based for our Mikrotik firewall messages so stay tuned for an upcoming blog post about that