vSphere Performance - Telegraf, Influxdb and Grafana 7 - Rows and Repeating
Overview
Intro
This is the ninth part of a blog series about Telegraf, InfluxDB and Grafana where we use vSphere performance data as our metric data.
We have seen how we can use different types of panels and how we can use variables to create dynamic and reusable dashboards. In this post we will take a look at a couple of features in Grafana that can help when you build out dynamic dashboards: rows and repeating.
The posts in this series build on each other, but you should hopefully be able to use them as reference if you're just jumping in to a specific post. I am using vSphere performance data from an InfluxDB database pulled by Telegraf for my examples.
The sample dashboard
To help us make use of rows and repeating in this post I've created a sample dashboard that shows some utilization metrics for an ESXi host.
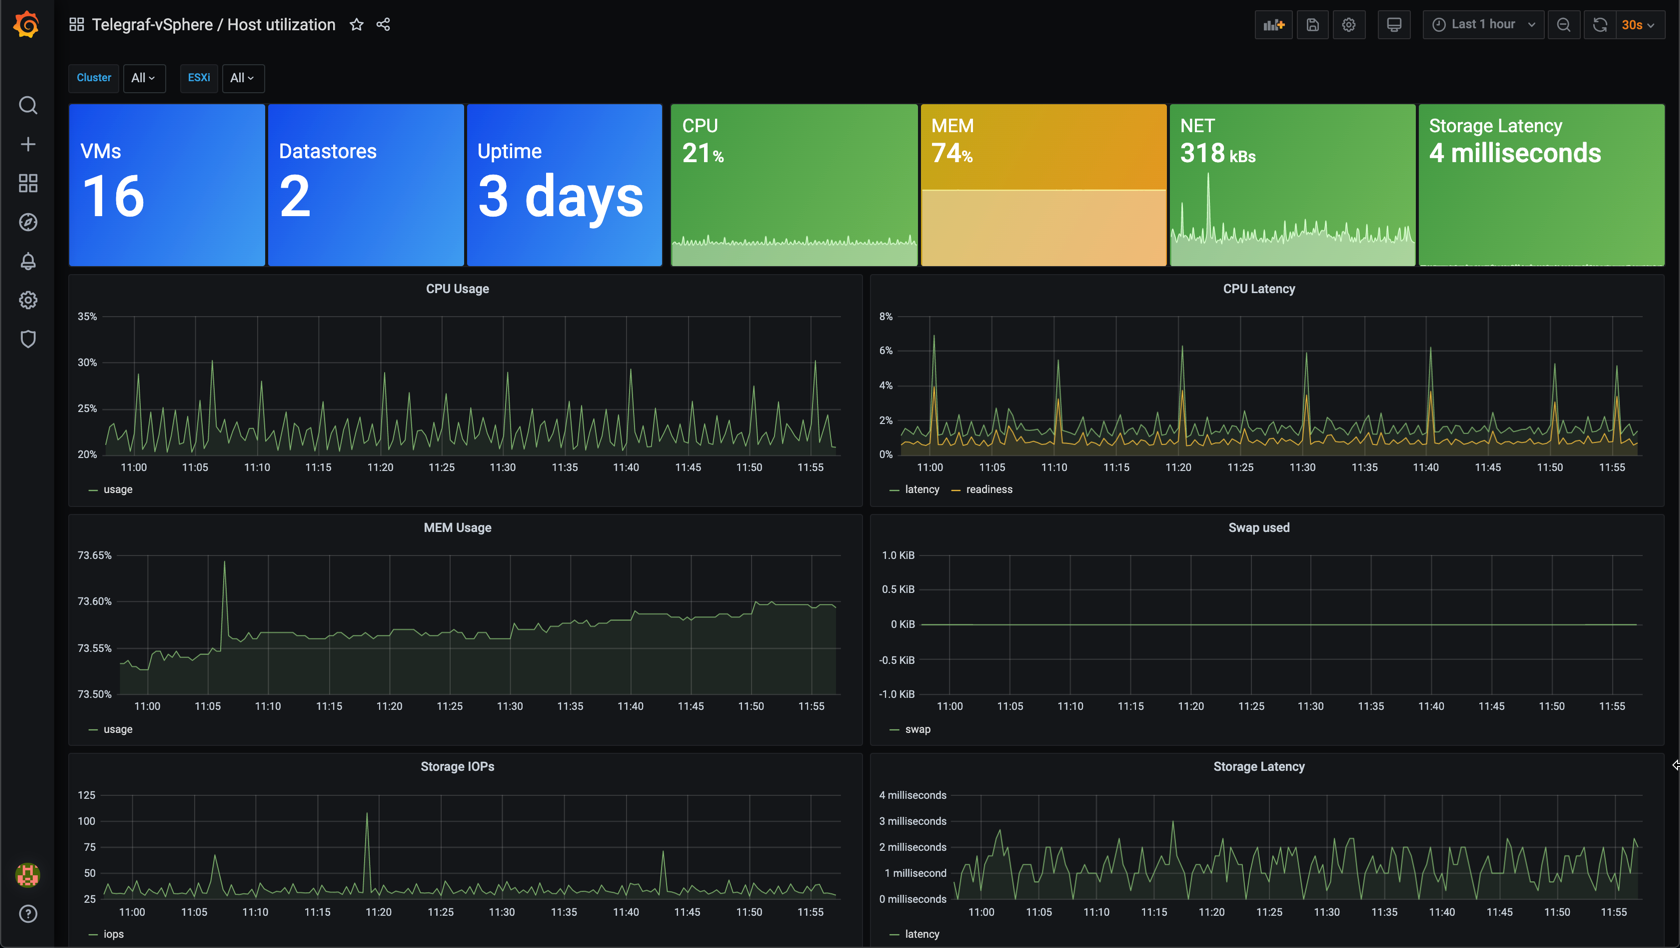
The dashboard looks alright and gives us a great deal of information about the utilization on this host. We also have variables set up on this dashboard so we can change to a different host and get the details for that host.
One possible issue with this dashboard is that there's no room for more panels without scrolling. This might be more of a cosmetic issue, but with more panels there's more queries and the dashboard might load slower.
More graphs can also clutter up the dashboard. When it comes to dashboards I think less is more, in my opinion it's better to have less panels on a dashboard and rather more specific dashboards. This will of course depend on the use case for the dashboard you're working with. What is the purpose of the dashboard? Who is this dashboard for? Will the dashboard be presenting on a monitoring screen? These are some of the questions that you should ask yourself when creating your dashboard.
Rows
One way of cleaning up your dashboard is to combine panels with rows. With that you can collapse rows and the panels within which both can make the dashboard more readable and less confusing, but also more performant as Grafana won't load the query before the row is expanded.
To create a row you use the Add panel button, and select the Convert to row option

This will add a row at the top of your dashboard
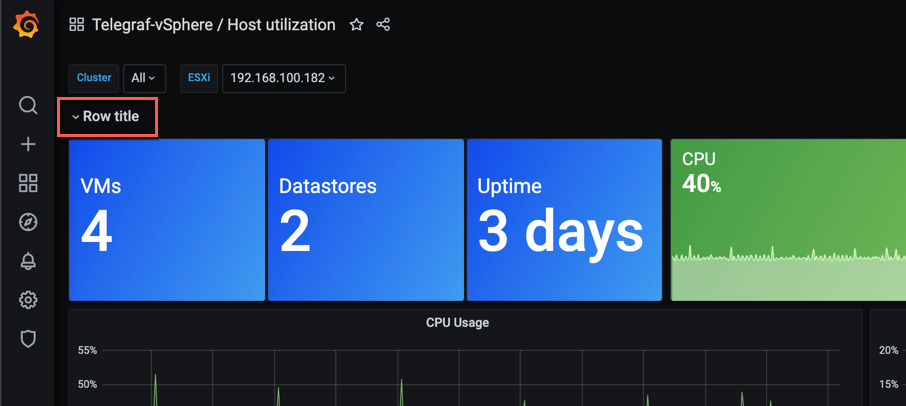
We'll click the Row options to see what we can do with the row
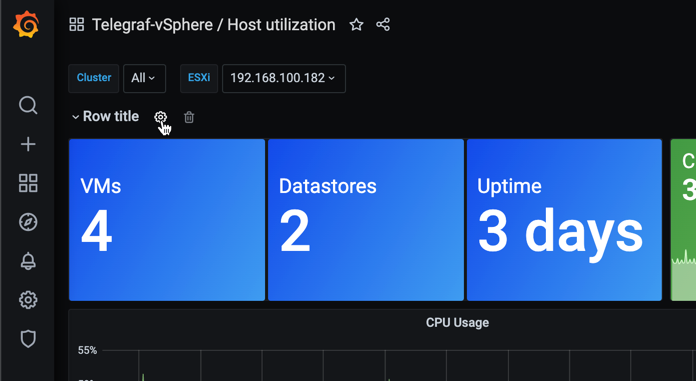
The options include the row title and the repeating options. We'll look at repeating later on.
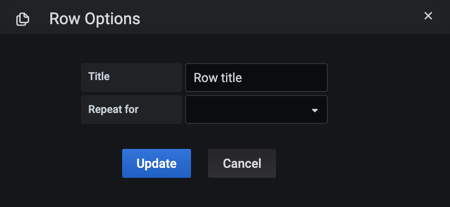
For now we'll only give this row a title

If we collapse the row now the following happens

This happens because all panels will by default be grouped under that first row.
Let's add a few more rows which we'll use to group different panels.

Rearrange rows
We can move the rows up or down by clicking and holding on the right side of the row and drag it to where you want it.

Now let's expand the first row and place the new rows where they belong
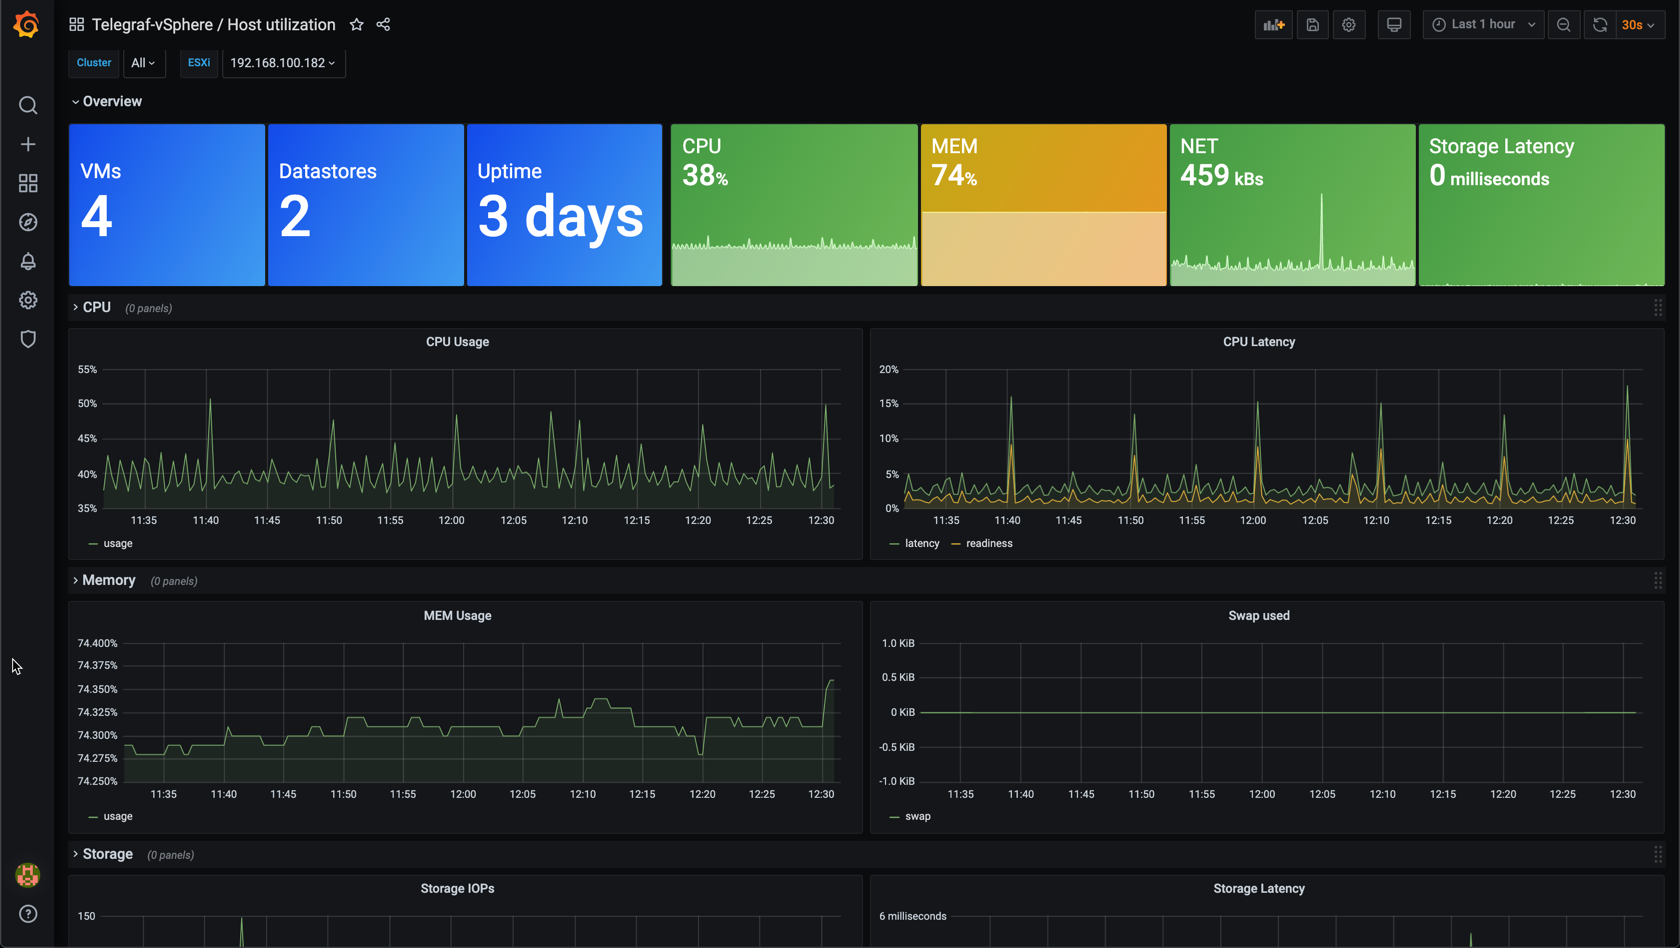
It seems that the panels are not grouped inside the rows, but if we expand each of the rows the panels will be linked to their respective row. Now we can collapse individual rows if we want
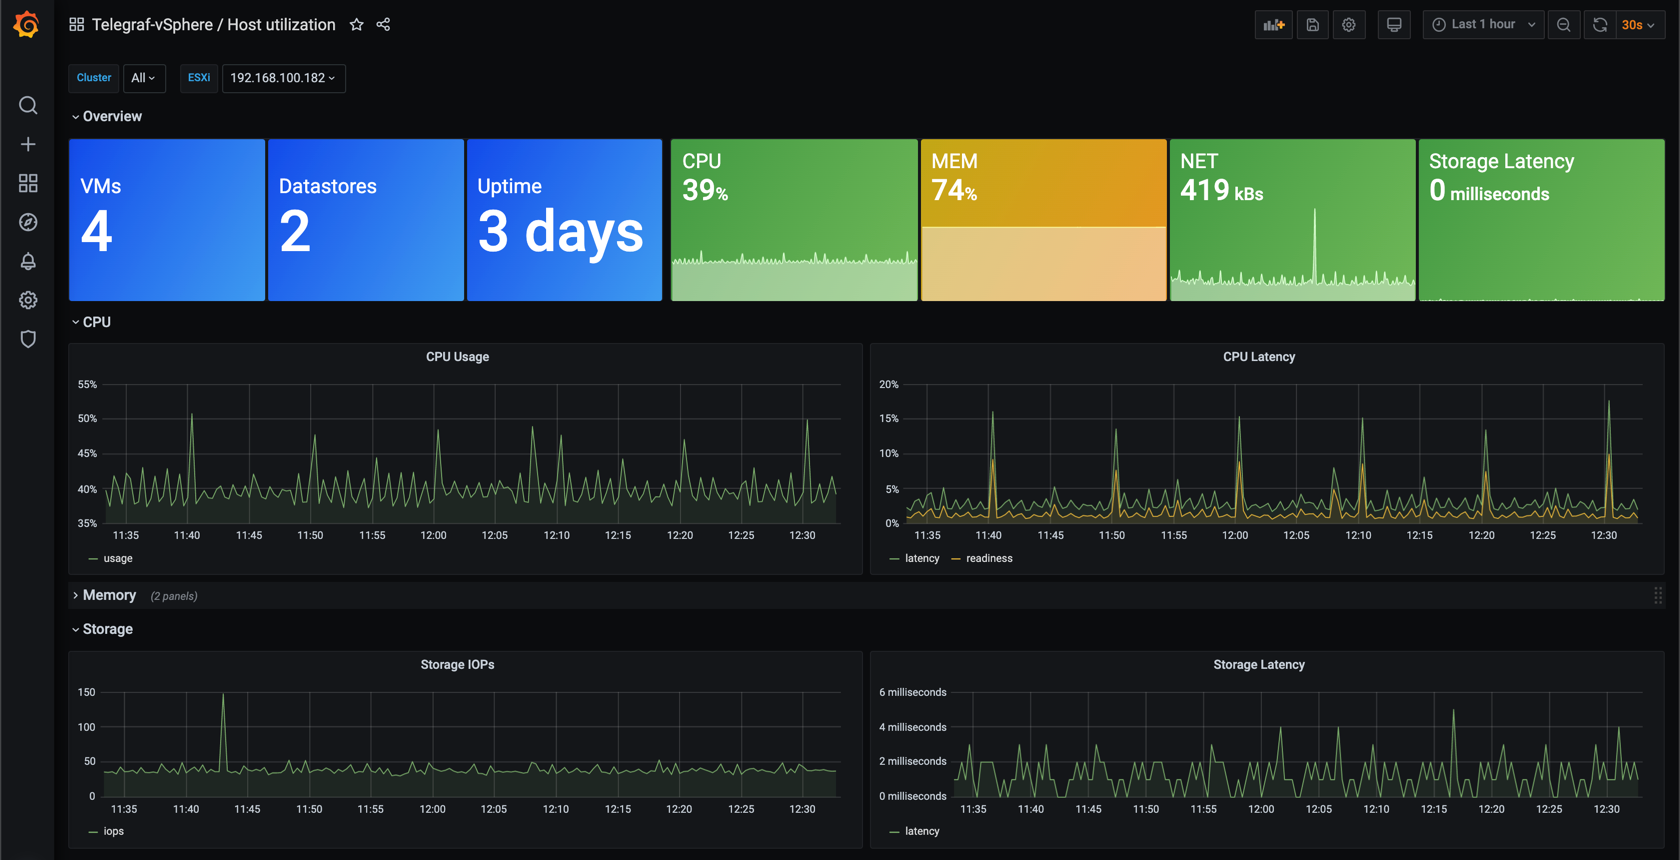
This allows us to create more panels with details for this host if we want, but not clutter up the dashboard because we can collapse rows. If we save a dashboard with rows collapsed they'll stay that way next time we open the dashboard.
Delete rows
We can also delete rows. There's two delete options when it comes to rows
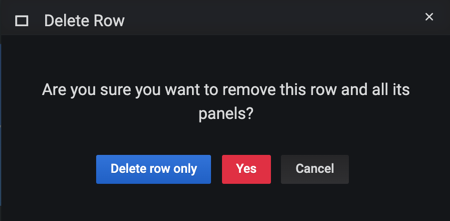
The Delete row only option will just remove the row. The panels will then be linked to the row above if it exists. The second option Yes will delete both the row and the panels grouped with it
Rows Use case
Remember that, depending on the use case for the dashboard, collapsed rows might not be the way to go as this requires a user to use it interactively to make sense of the feature.
Repeating
We've seen how to use rows to group and divide things logically on a dashbaord. Now let's see another interesting feature available to us when using rows, repeating.
We'll use the same dashboard as an example when we look at repeating, but we'll remove the Memory and Storage graphs
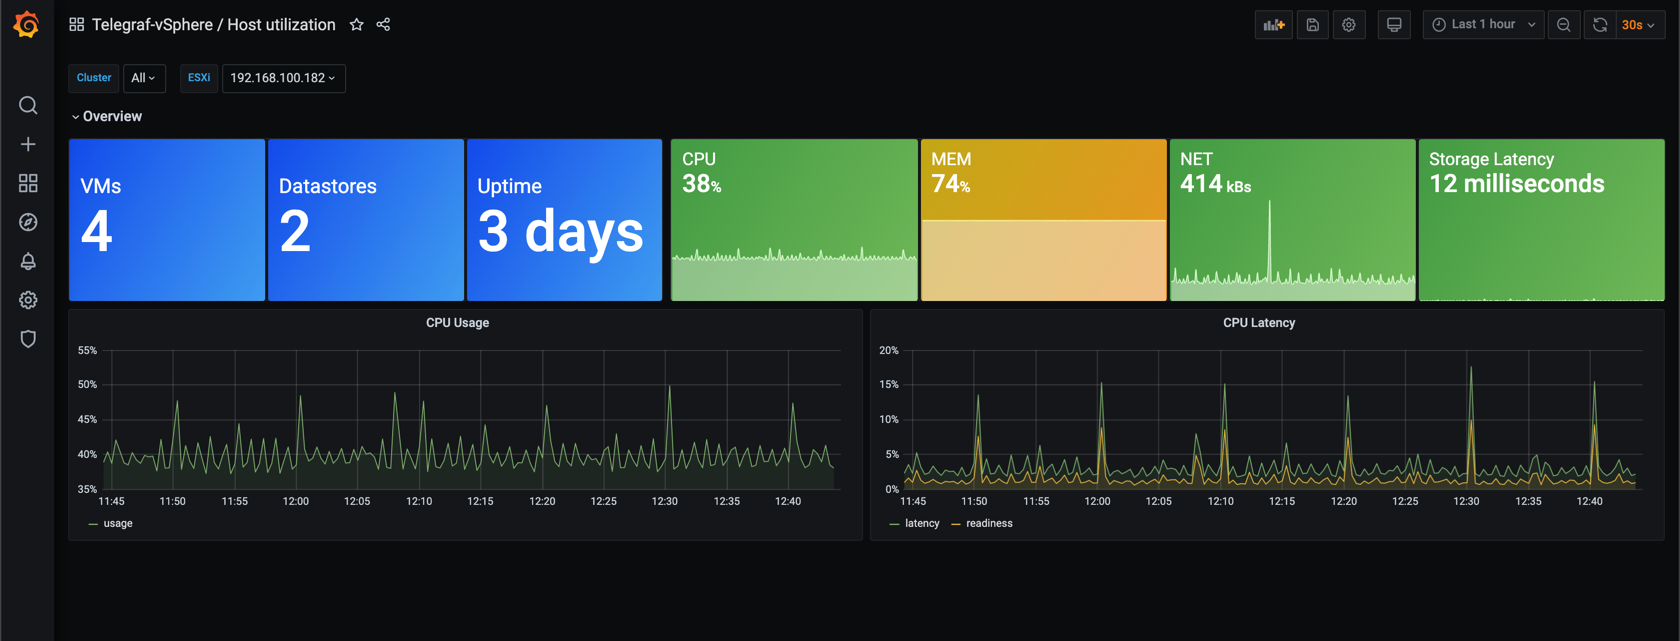
First we'll look at Repeating panels
Repeating panels
We'll go in to Edit mode of one of the existing panels, and all the way down in the Panel options we find the Repeat options. Note that the GUI options might be different in earlier Grafana versions
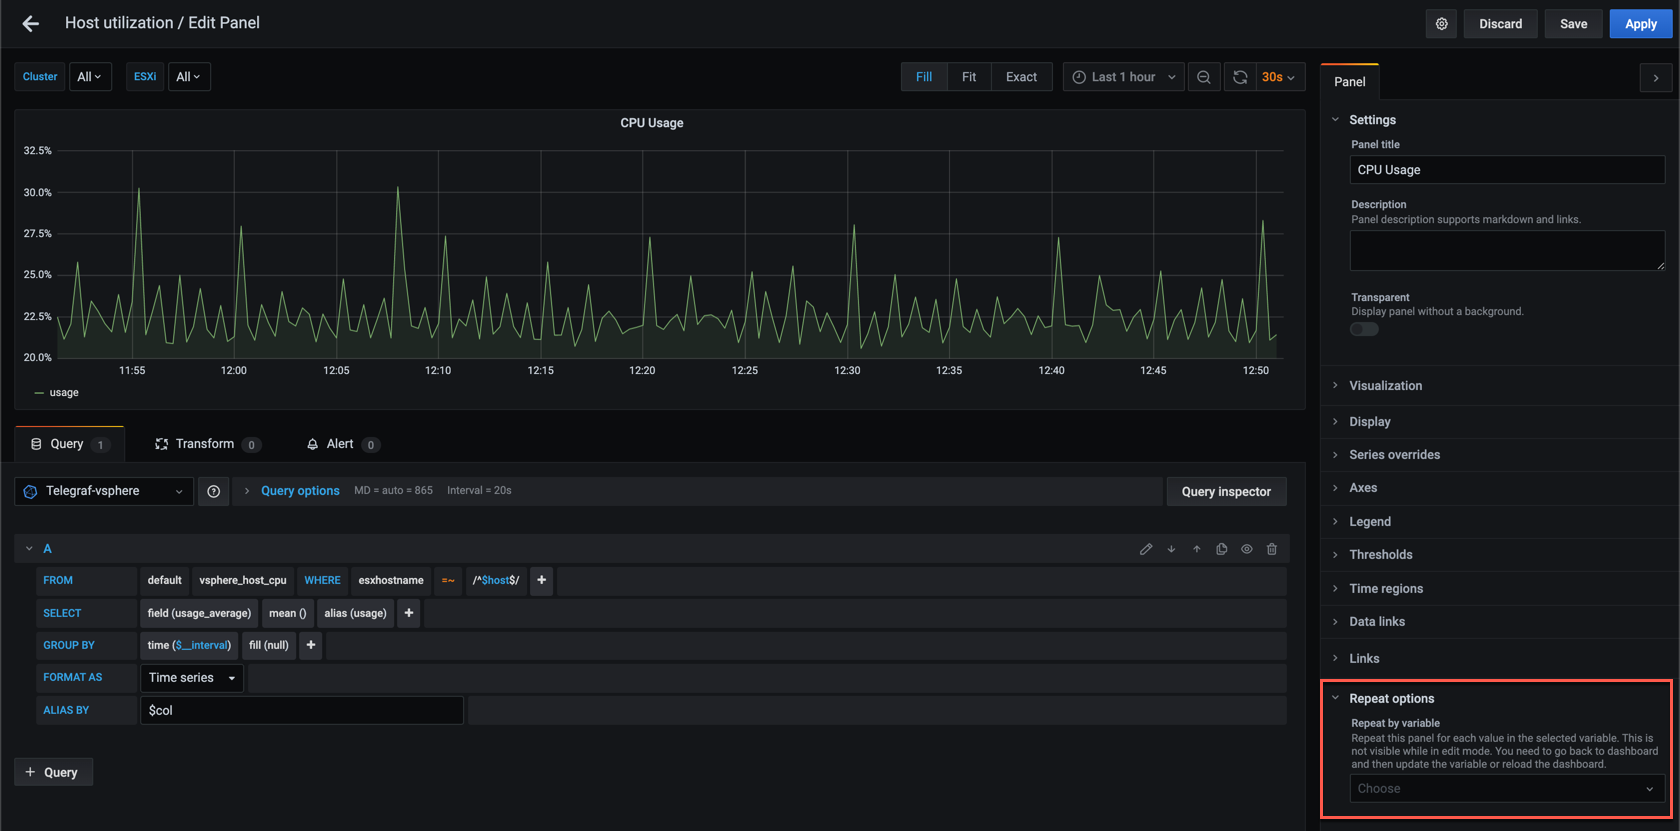
The first option when it comes to repeating is to choose which variable to repeat over, without variables you have nothing to repeat over. We discussed variables in a previous post.
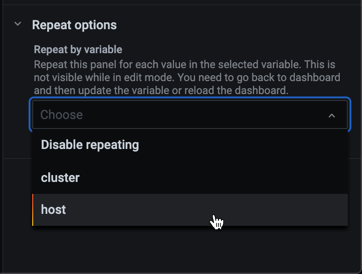
In this case we'll select to repeat on host which is a variable in our dashboard. The next thing to select is the direction
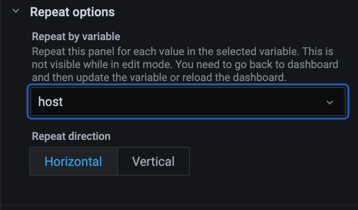
We can select horizontal or vertical. The horizontal option will also let you specify the maximal number of panels on a single row. Note that there's a slight bug in the GUI that won't show this option before you have selected vertical and then go back to horizontal. The vertical option has no more options
In this first example we'll select the horizontal option and set the Max per row to 3. Note that we've also added the $host variable to the Alias by field in the query editor so we can have the corresponding host name visible in the legend
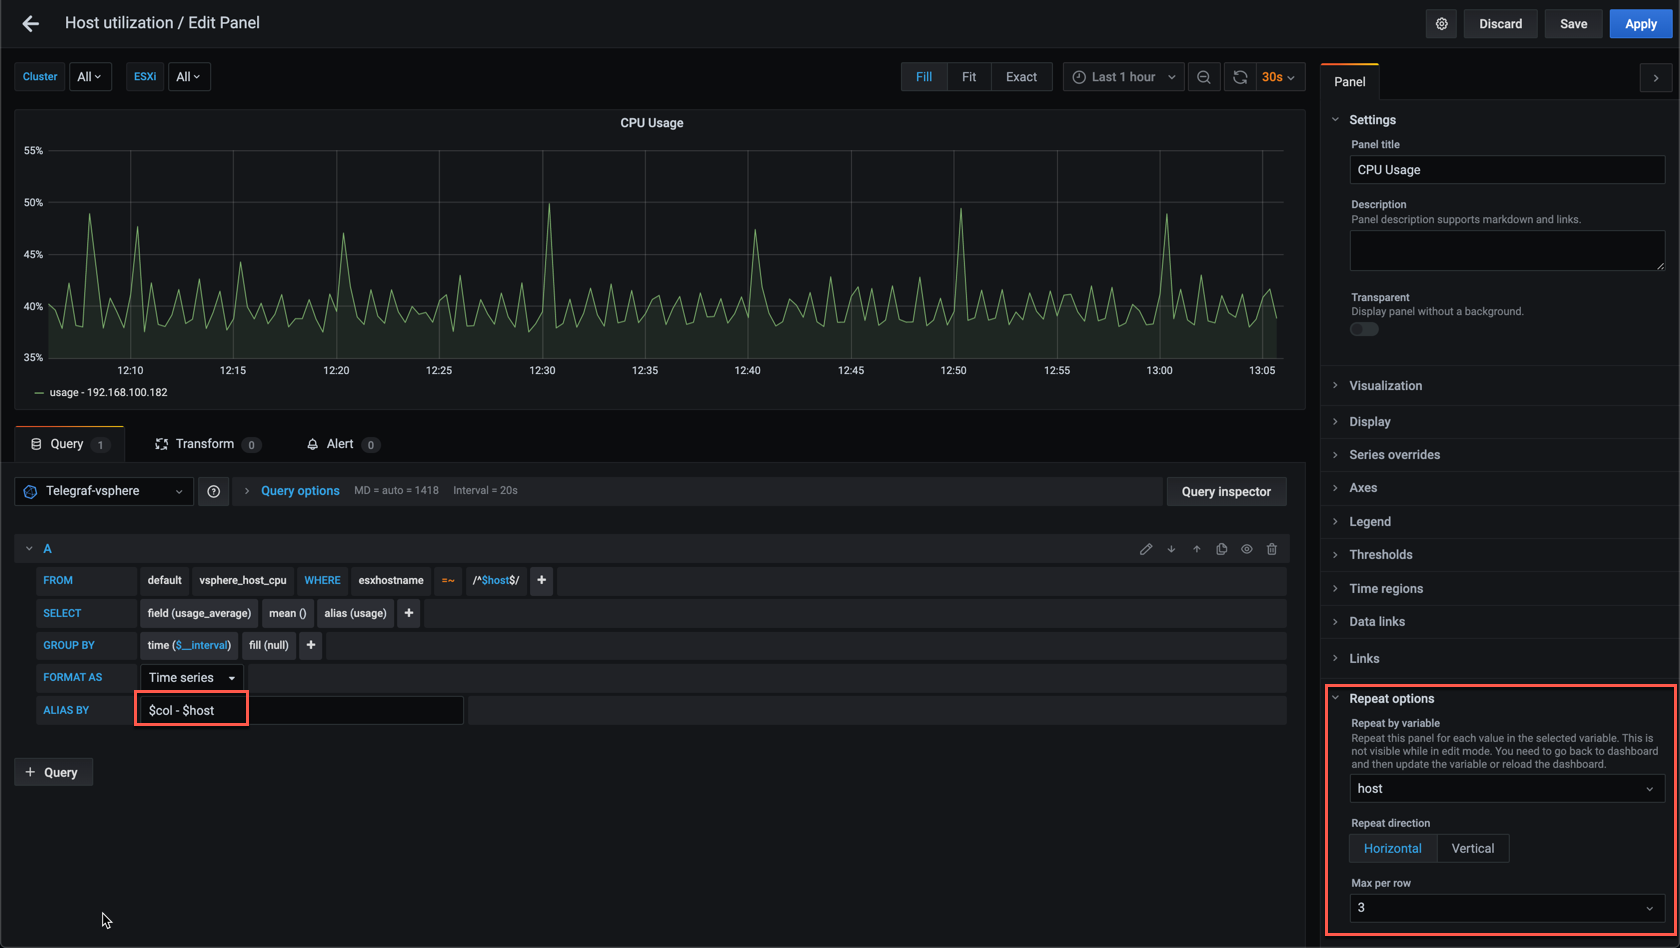
After we hit apply there might not be a difference on the dashboard. But if we refresh, or make a selection in the host variable the panel should change.
Let's select only one of the hosts
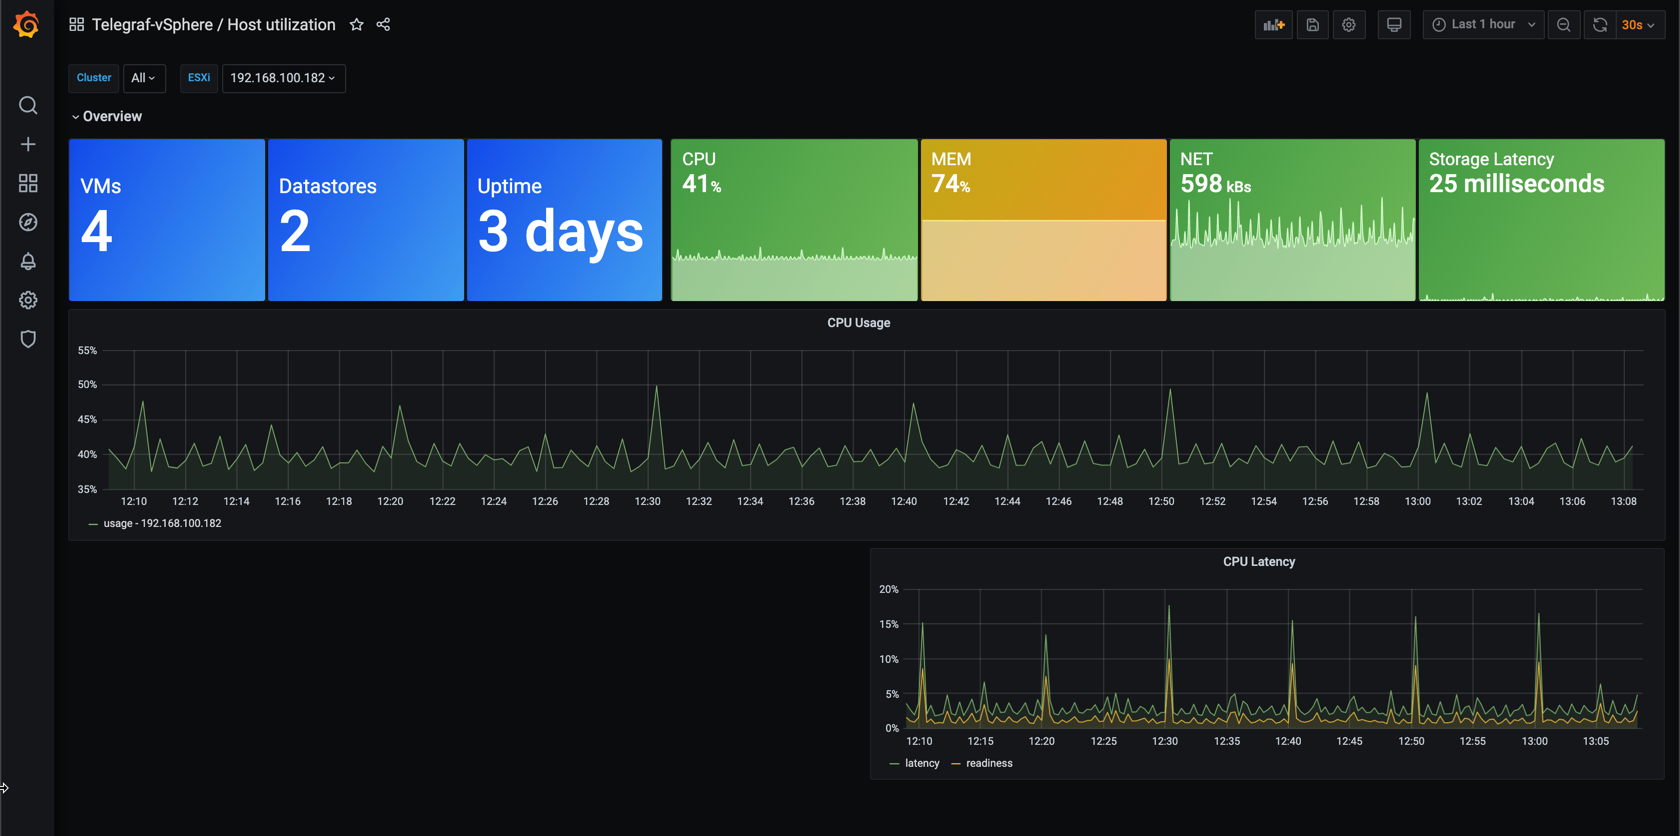
We can see that the panel has now expanded to use the whole row. If we now change our selection in the hosts variable the panel should duplicate with the corresponing hosts
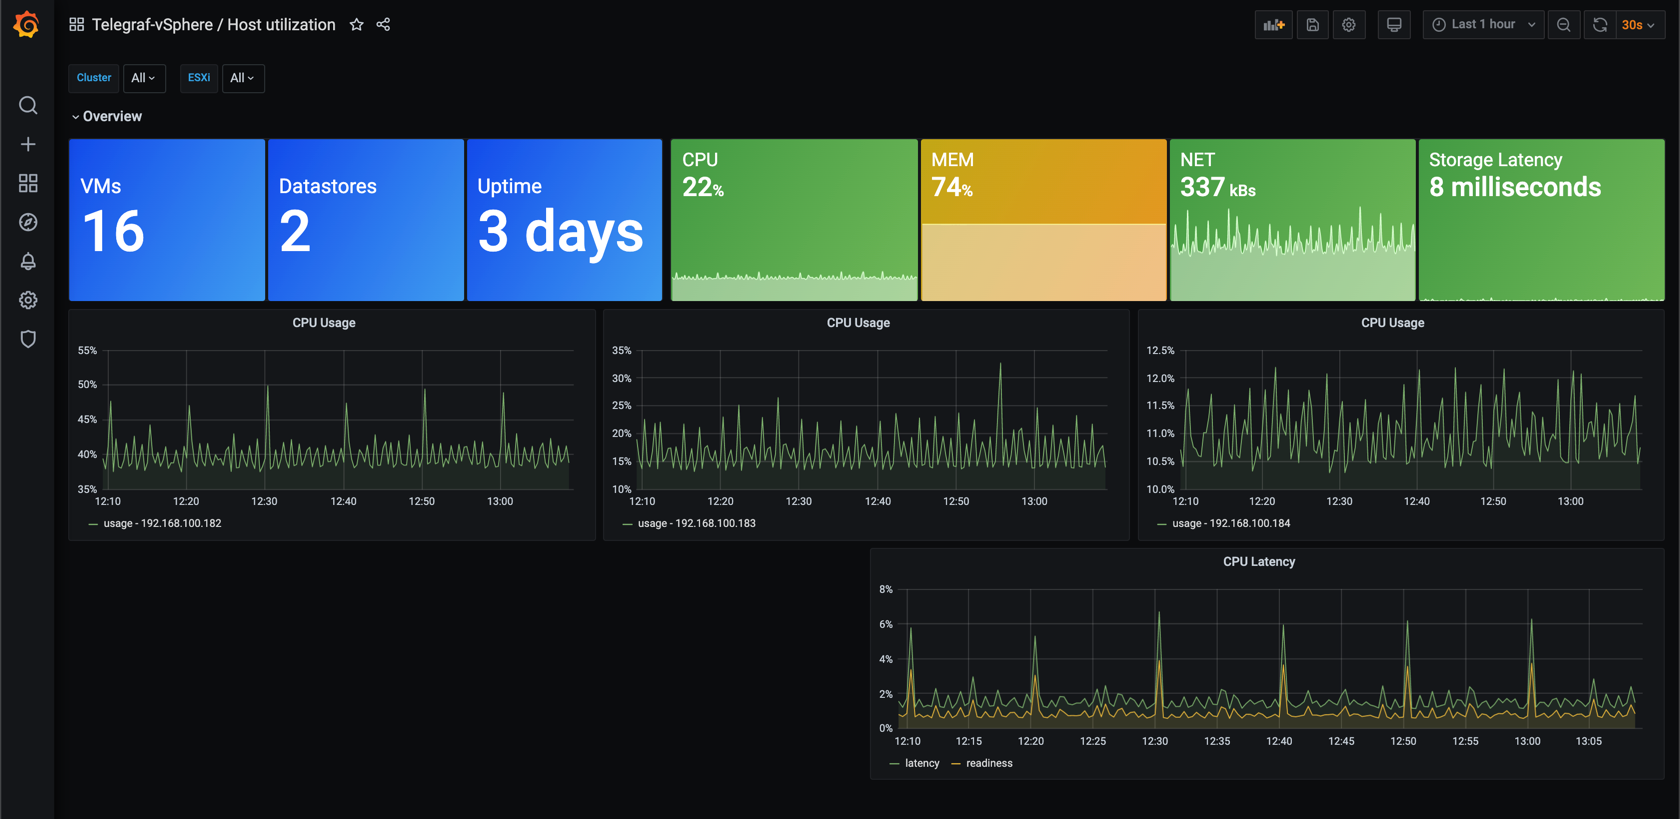
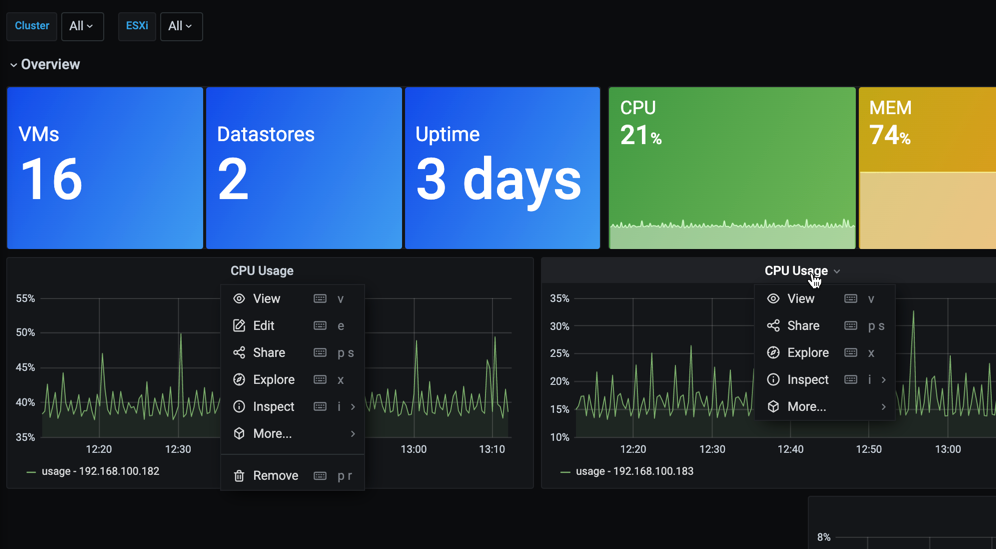
One thing to note when working with repeating panels is that all changes must be done on the panel you've chosen for repeating. The edit option is not available on one of the repeated panels
While repeating panels in it self is interesting and helpful, we can also do repeating on rows.
Repeating rows
To see how we can repeat rows I've disabled the repeating on the panel we've used so far. You can combine both repeating on panels and rows, but that doesn't make any sense in the following examples. You should repeat over different variables for combining to be useful (i.e. repeat rows over Hosts, panels over services/nics etc)
Now, let's access the row options as we did previously and now select to repeat it. Again we'll select host as the variable to repeat over. Note that I've also added $host to the row title so we can get the hostname on the rows
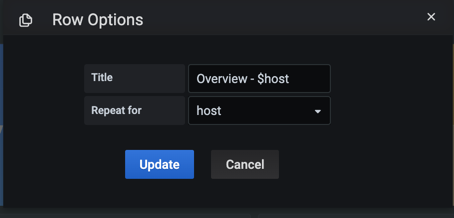
After you click Update you might note that nothing will change until you either refresh the dashboard (remember to save first) or change the selection in the host variable
Let's see how it looks with one host selected
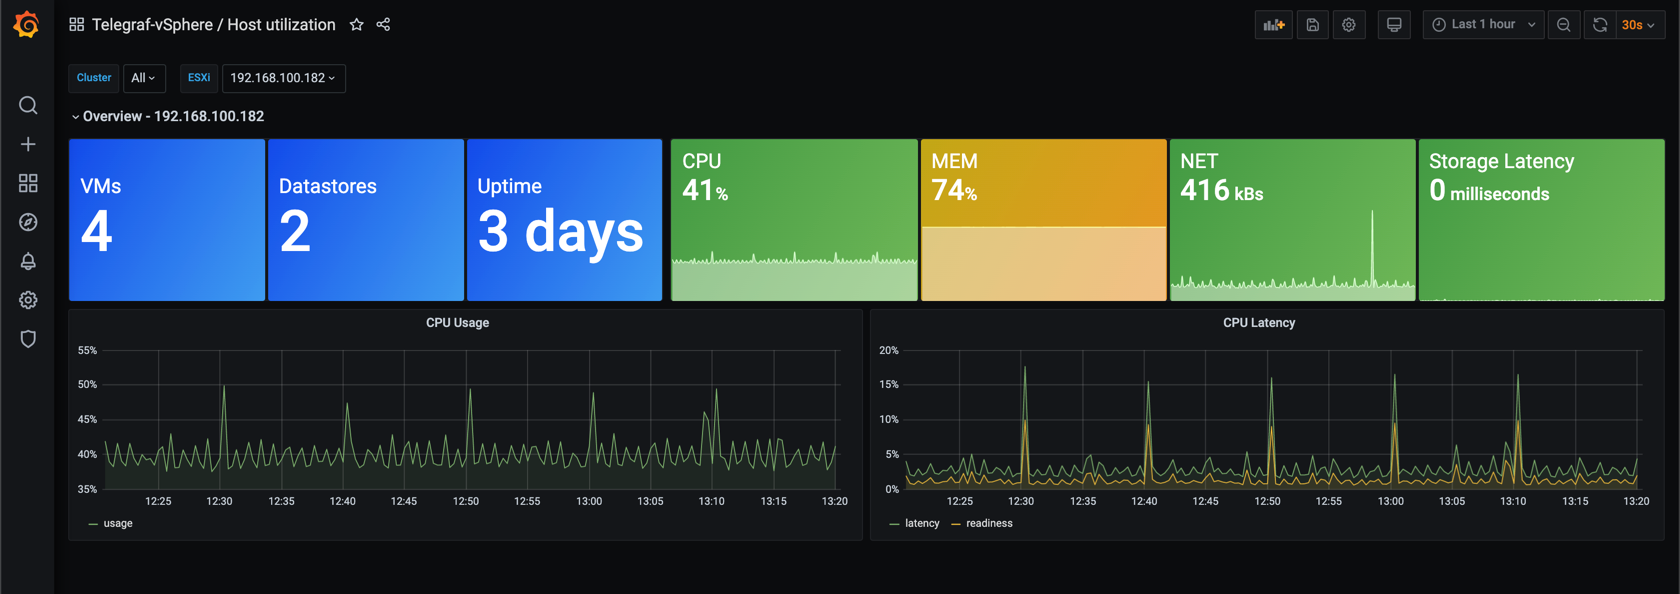
The only change is that the host name is displayed in the row title.
Now let's switch to All for the hosts variable
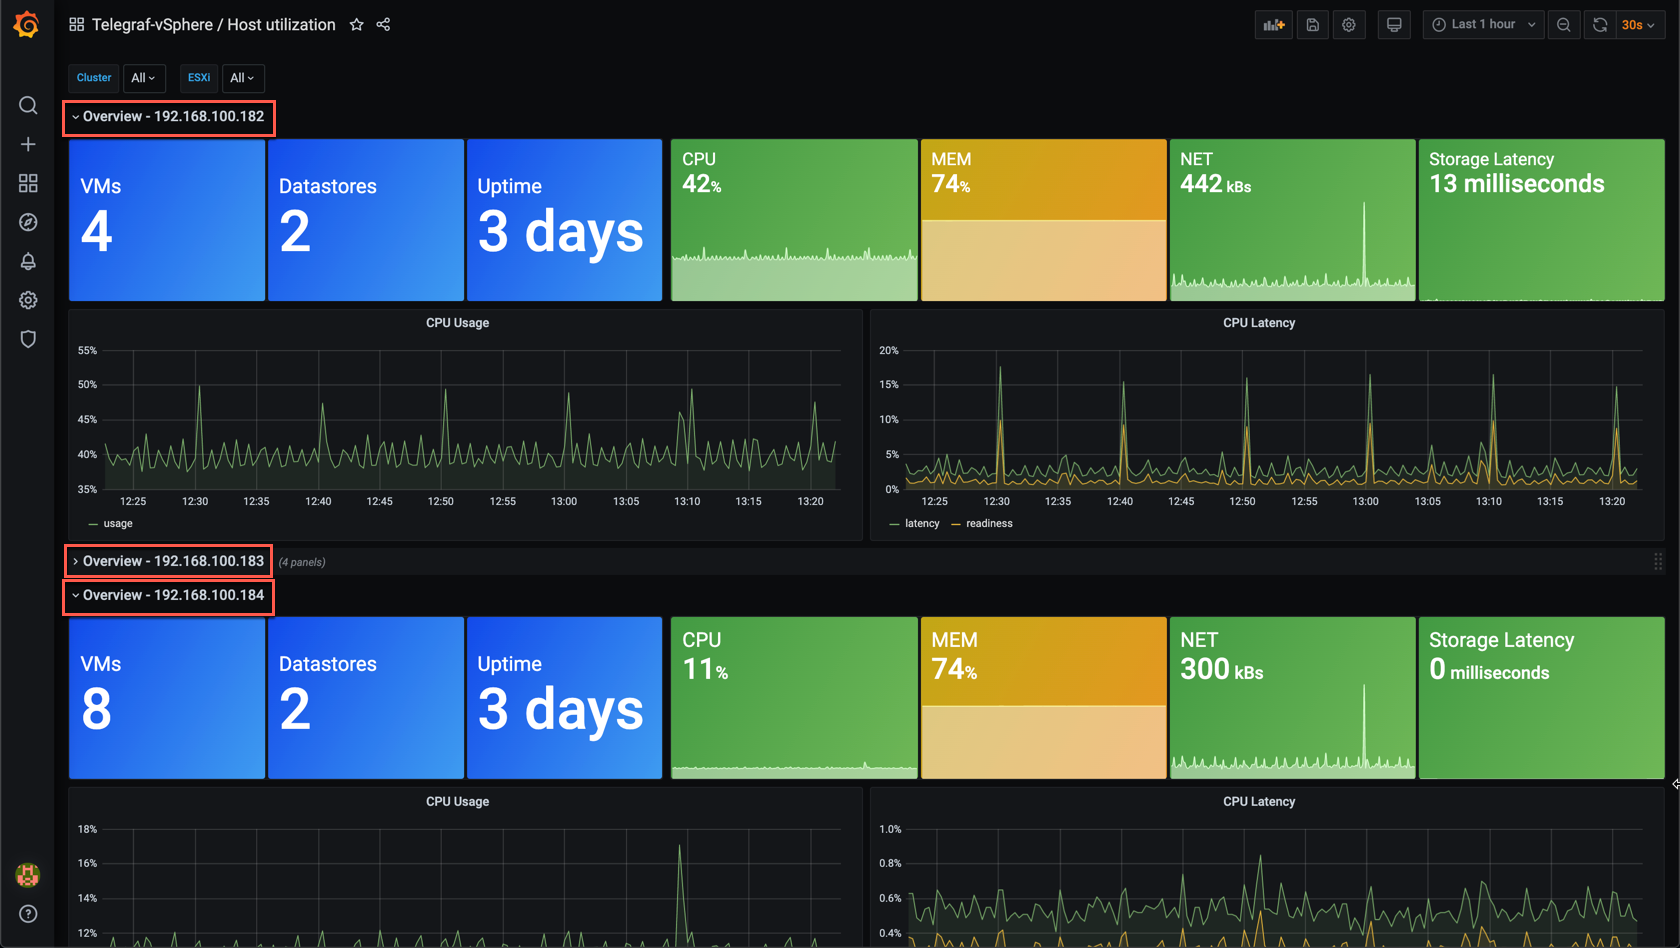
I've deliberately collapsed the middle row so we can see that all three hosts have it's row with it's individual panels
Repeating pitfall
Although repeating is a great feature in dashboards and panels, and I do use it a lot, there is something to be aware of. As we've seen if we repeat on a variable that has an All option the dashboard will repeat your panel and/or rows for All the values in that variable.
While that's fine in my environment with three hosts, that might not be wise in an environment with hundreds of hosts.
Summary
This post has been all about how we can make use of rows for create logical groupings of our panels in a dashboard to clean it up a little, and to help with performance as collapsed panels are not loaded by Grafana.
We've also looked at repeating which is a great way of displaying similar panels for multiple selected values
Thanks for reading, and as always, feel free to reach out if you have any questions or comments