Grafana Treemap and XY chart
In this post we'll take a look at how to use a few different panel types at least I'm using quite rarely. Especially the Treemap and the XY chart.
The Treemap chart is a plugin originally developed by Marcus Olsson, but now maintaned by Grafana Labs. Note that it must be installed specifically, it's not part of Grafana out of the box.
The dashboard used in this example is a Portfolio tracker detailing investments in different stocks. The datasource used for the dashboard is a PostgreSQL database where the different portfolios, stocks and the stock history is stored. Most of the data is fetched from different stock market APIs and stored daily. There's currently no realtime data in the dashboard. Since this is not the focus of this post we'll not go into details in the backend.
The top of the dashboard details the totals of the Portfolios, value, deposits, dividends etc, as well as the change last day, last week and last month.
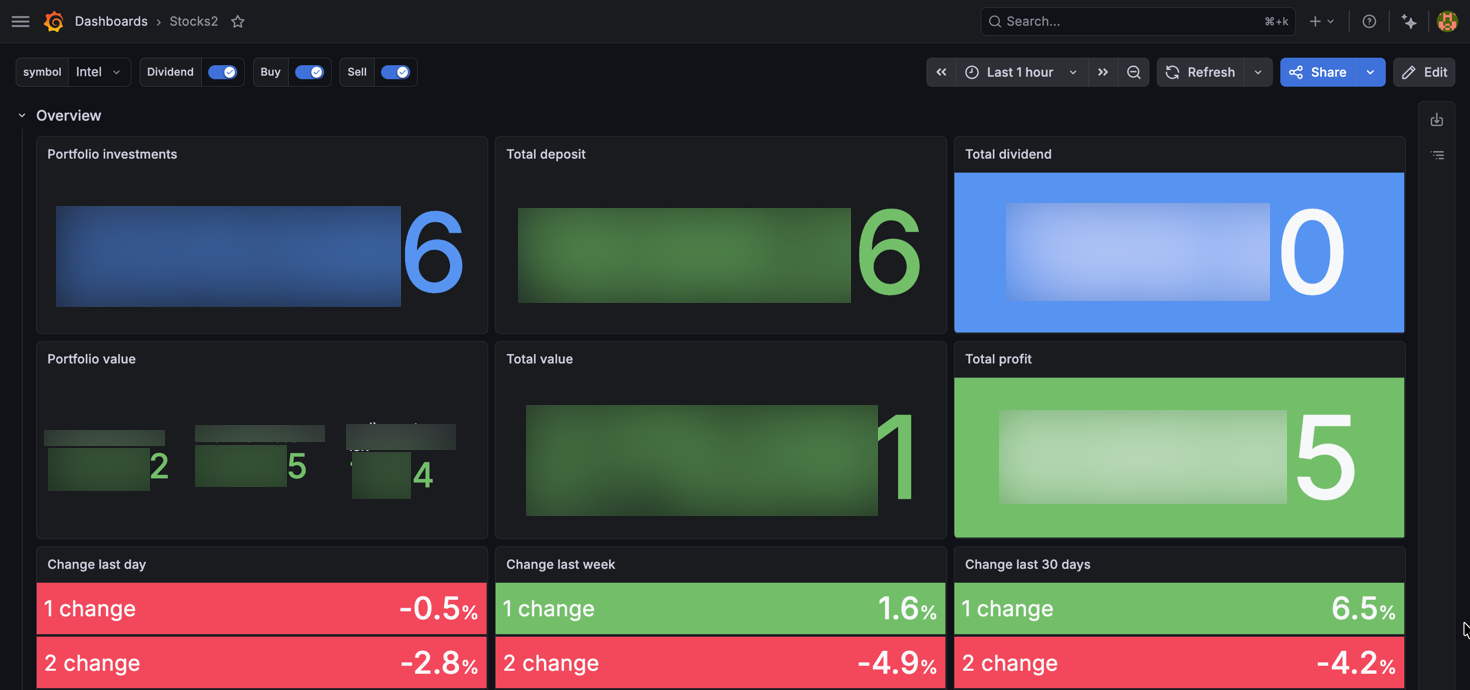
For visualizing the change in portfolios we're using standard threshold values
Next we have a panel detailing the latest stock price for tracked symbols
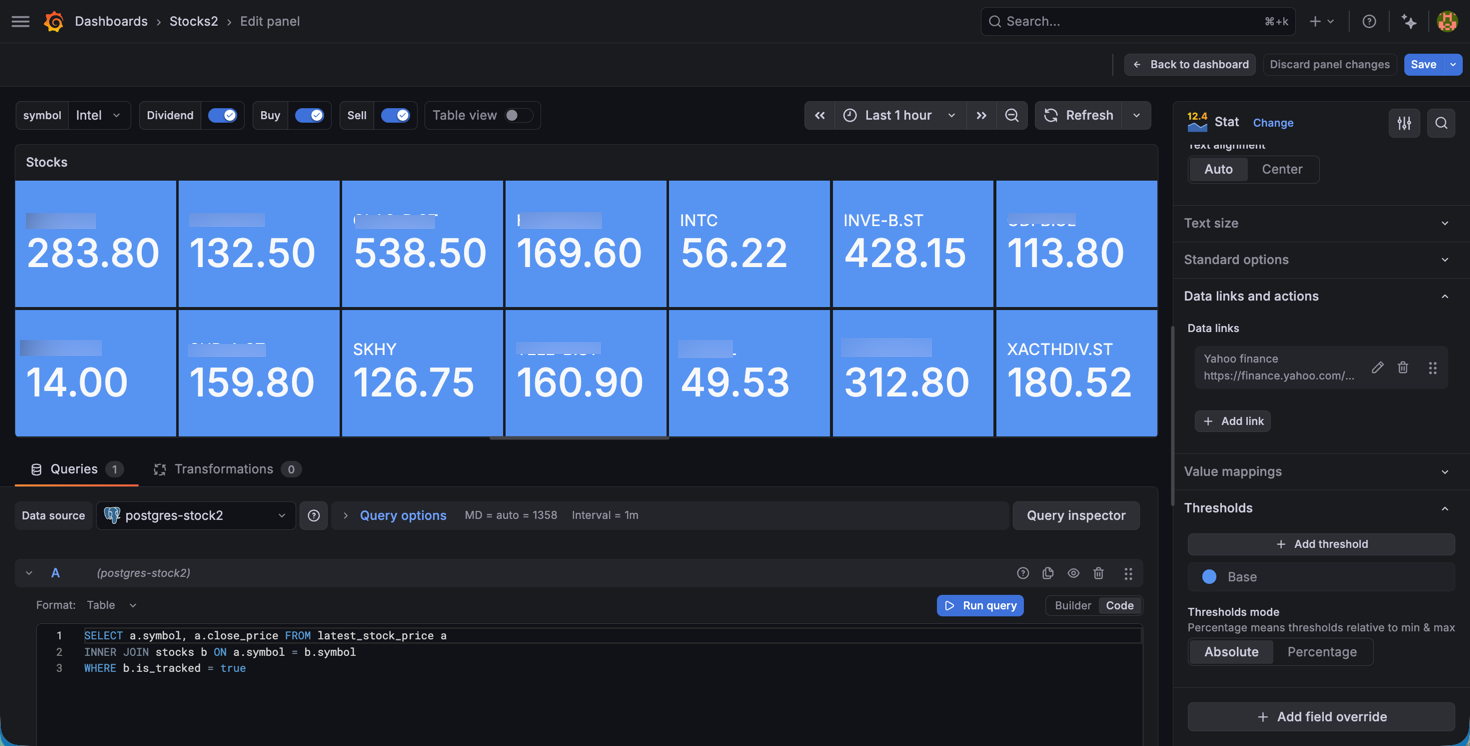
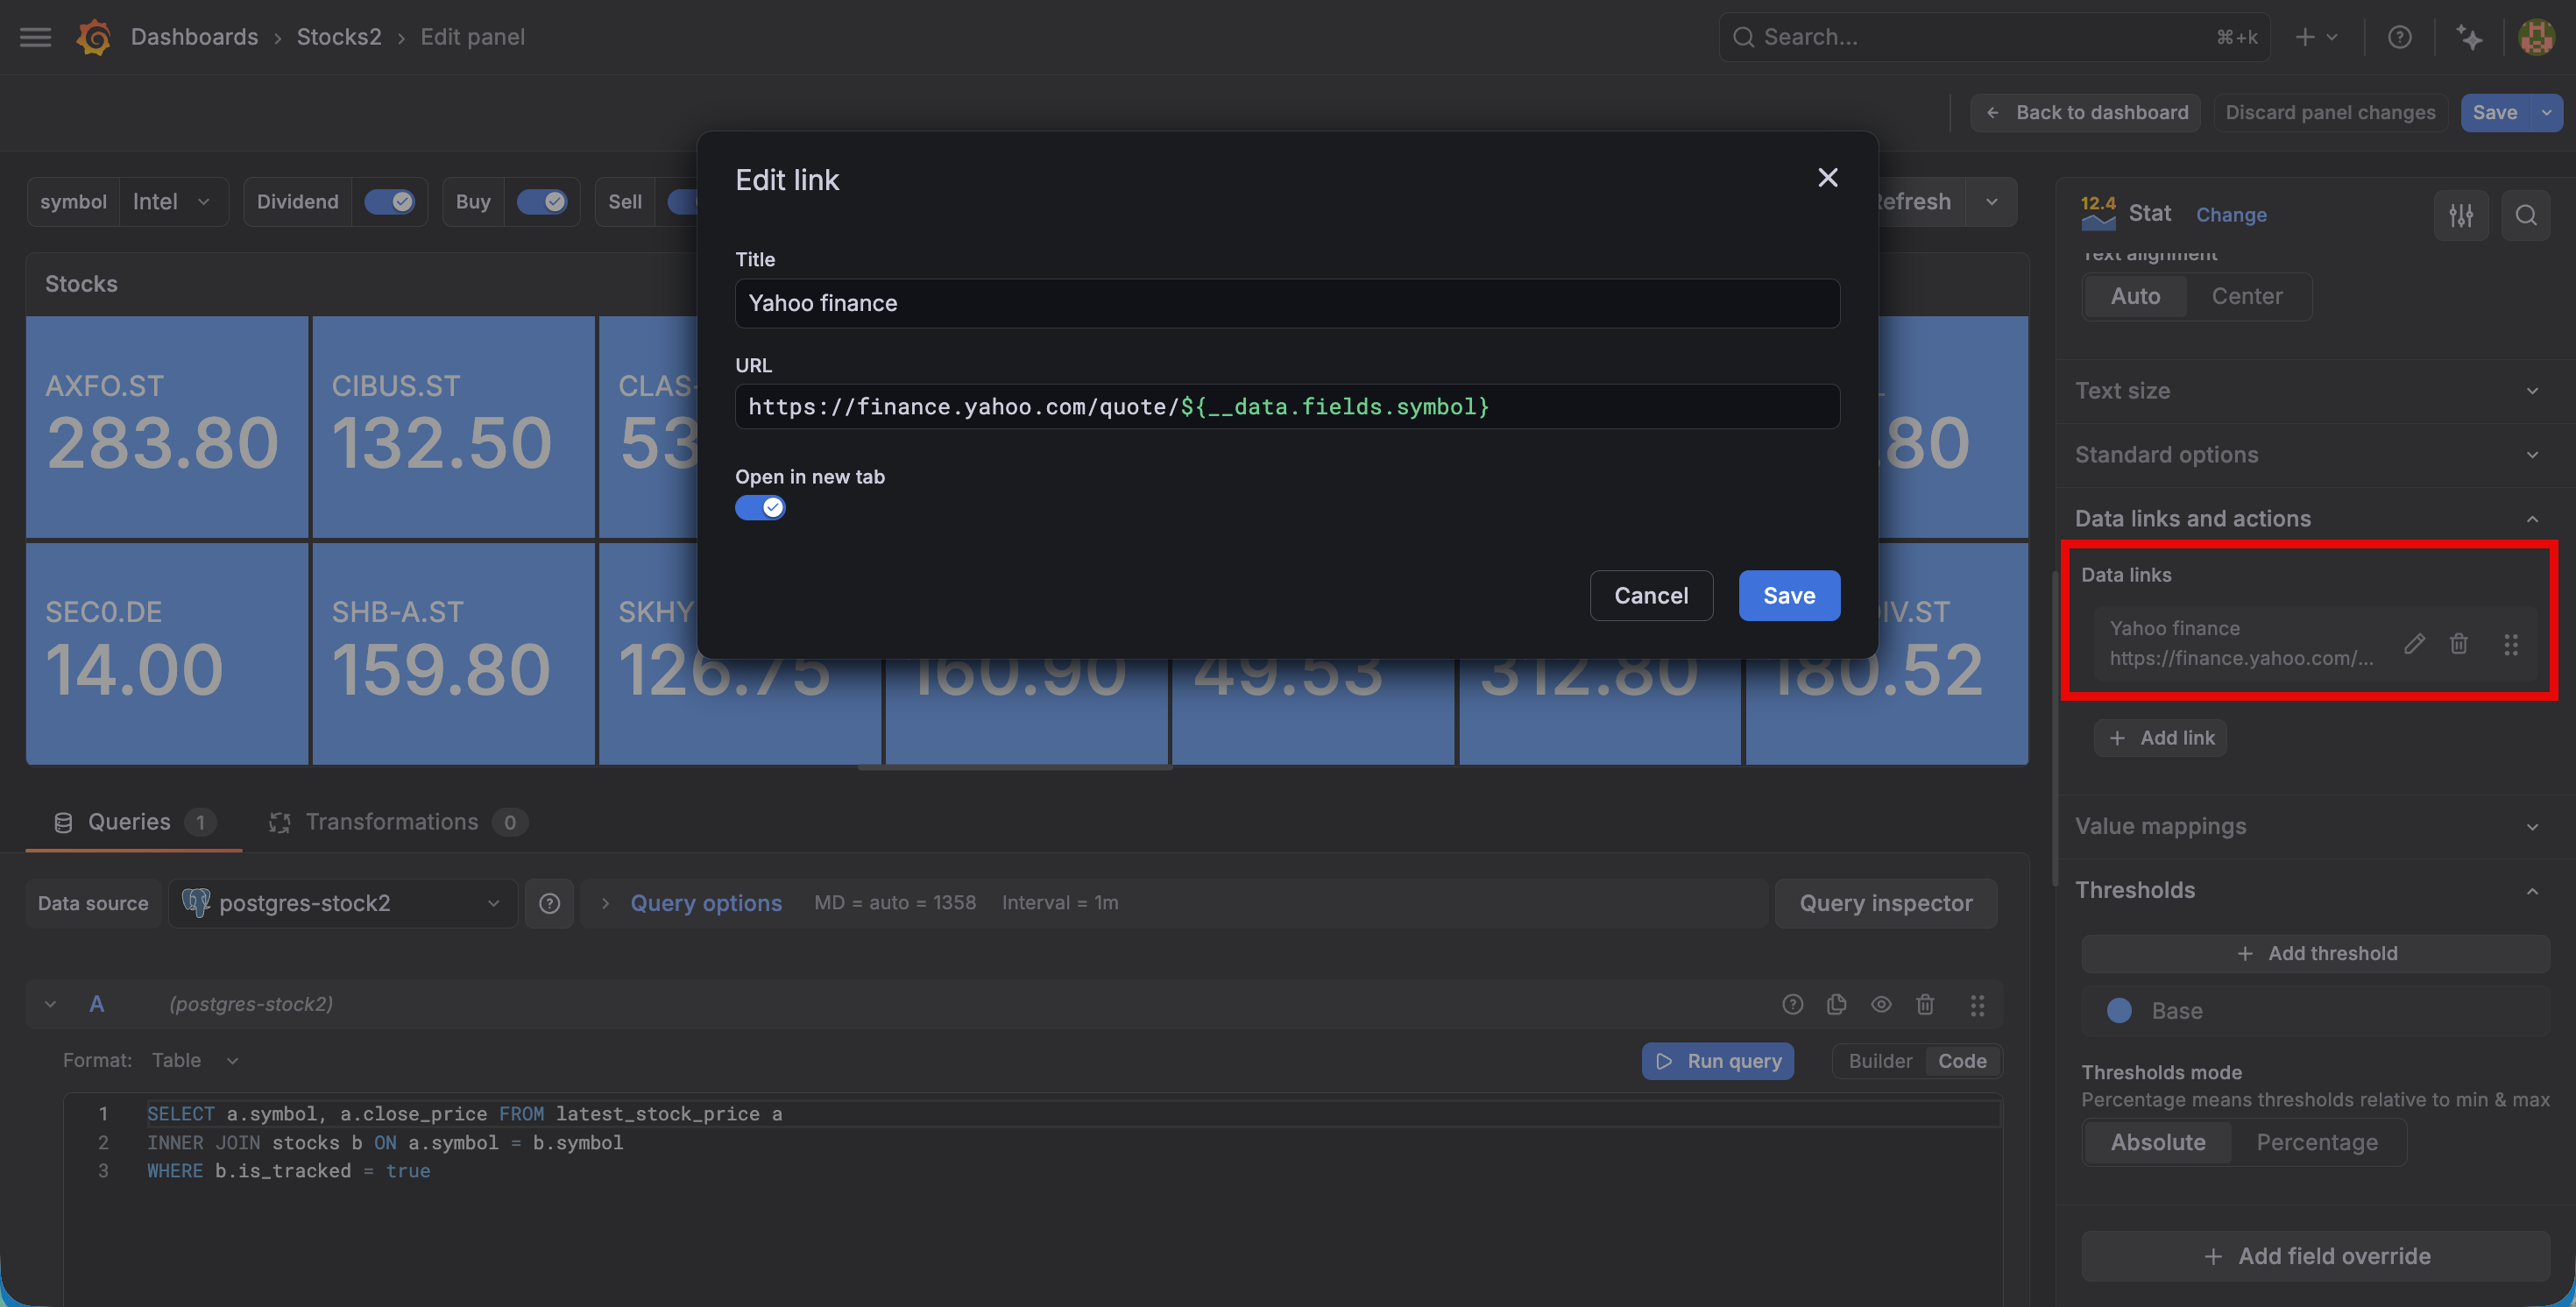
Each symbol also has a link to Yahoo finance to allow the user to get more details of a symbol.
Treemap chart
So far we've seen mostly standard panels and functionality. Next up is a treemap that visualizes the different symbols by value (size) in combination with the profit (color) which represents the color of the stock. The tooltip shows the name of the symbol, the value and the profit.
This visualization is a neat way of showing the relationship between entities, in this case the stocks in a portfolio.
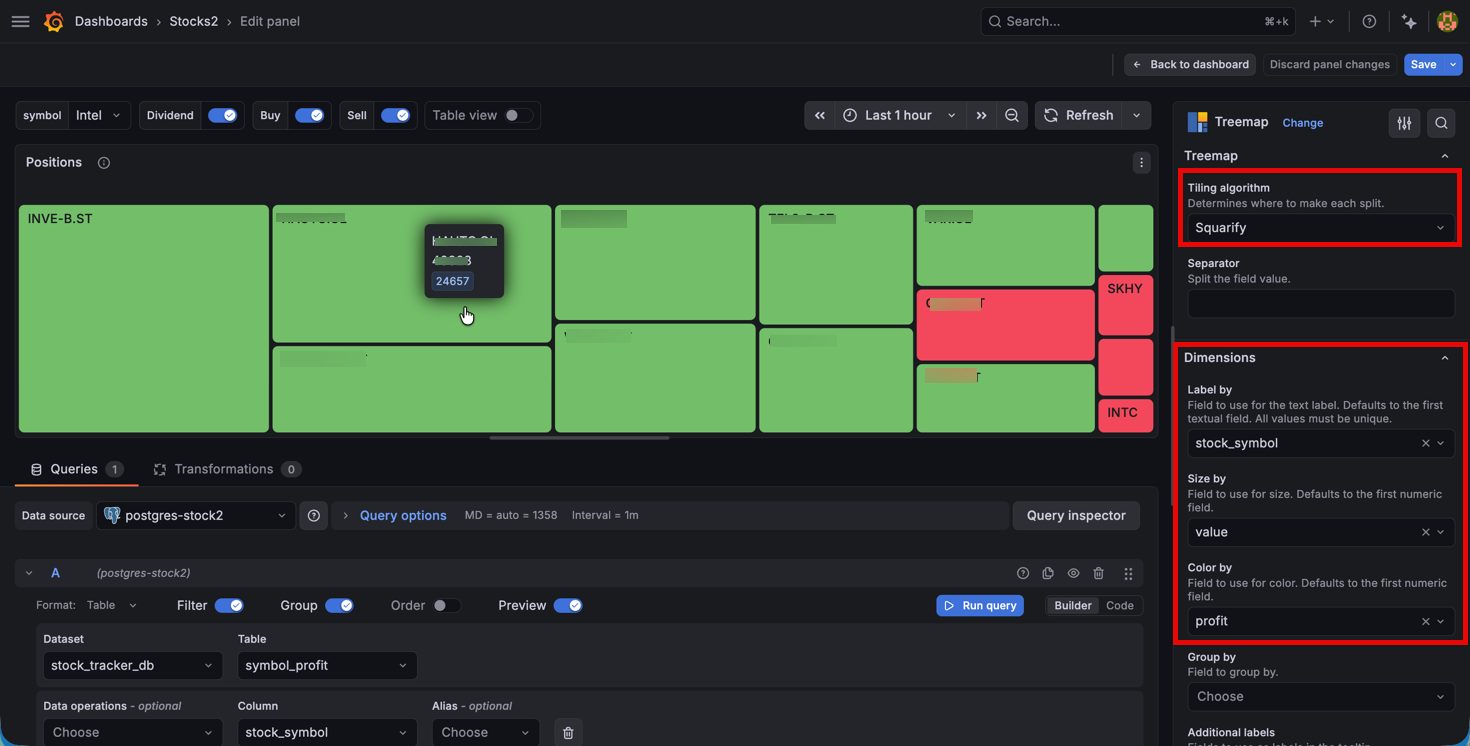
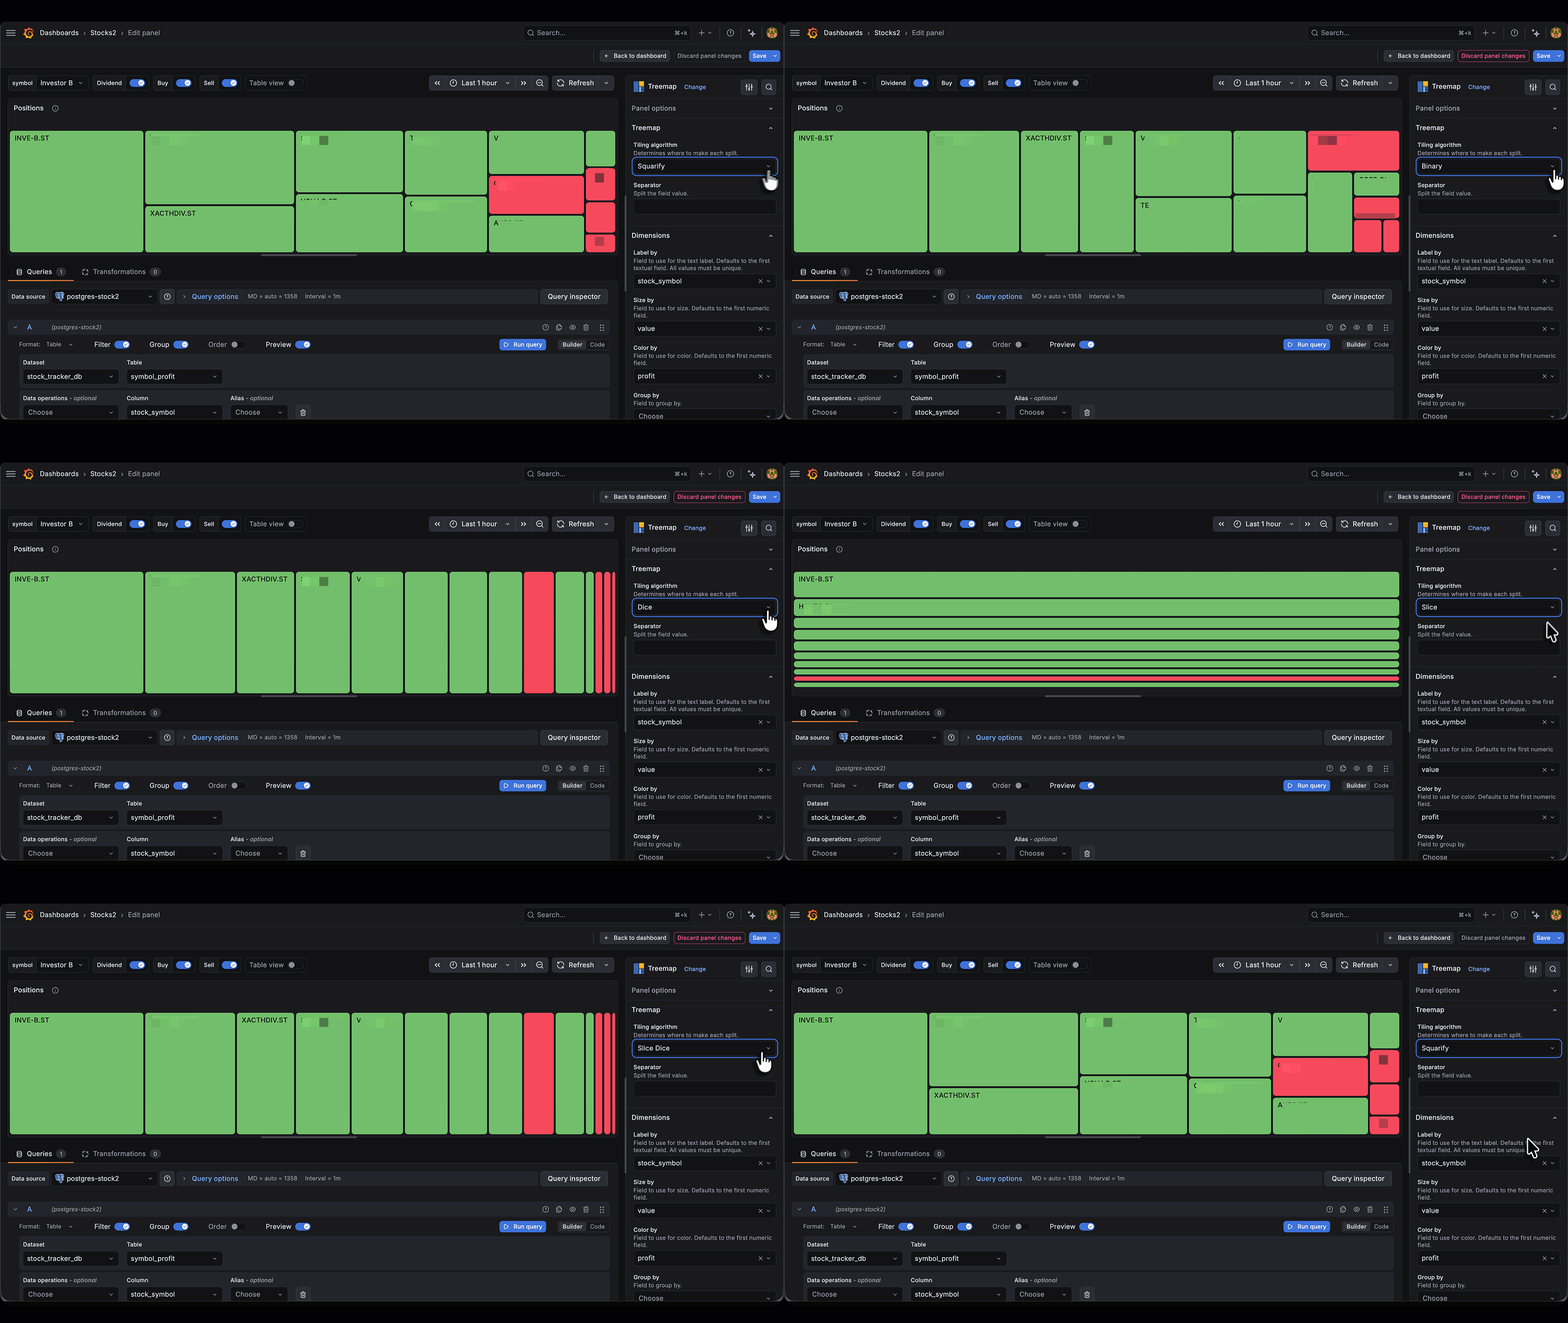
The treemap tiling algorithm used in the dashboard is squarify, but there's more to choose from
XY chart
Next we have four different panels visualizing profits against invested amount, the share of positions in the portfolio, the value history of the portfolios and finally the top 10 stocks by the dividends received
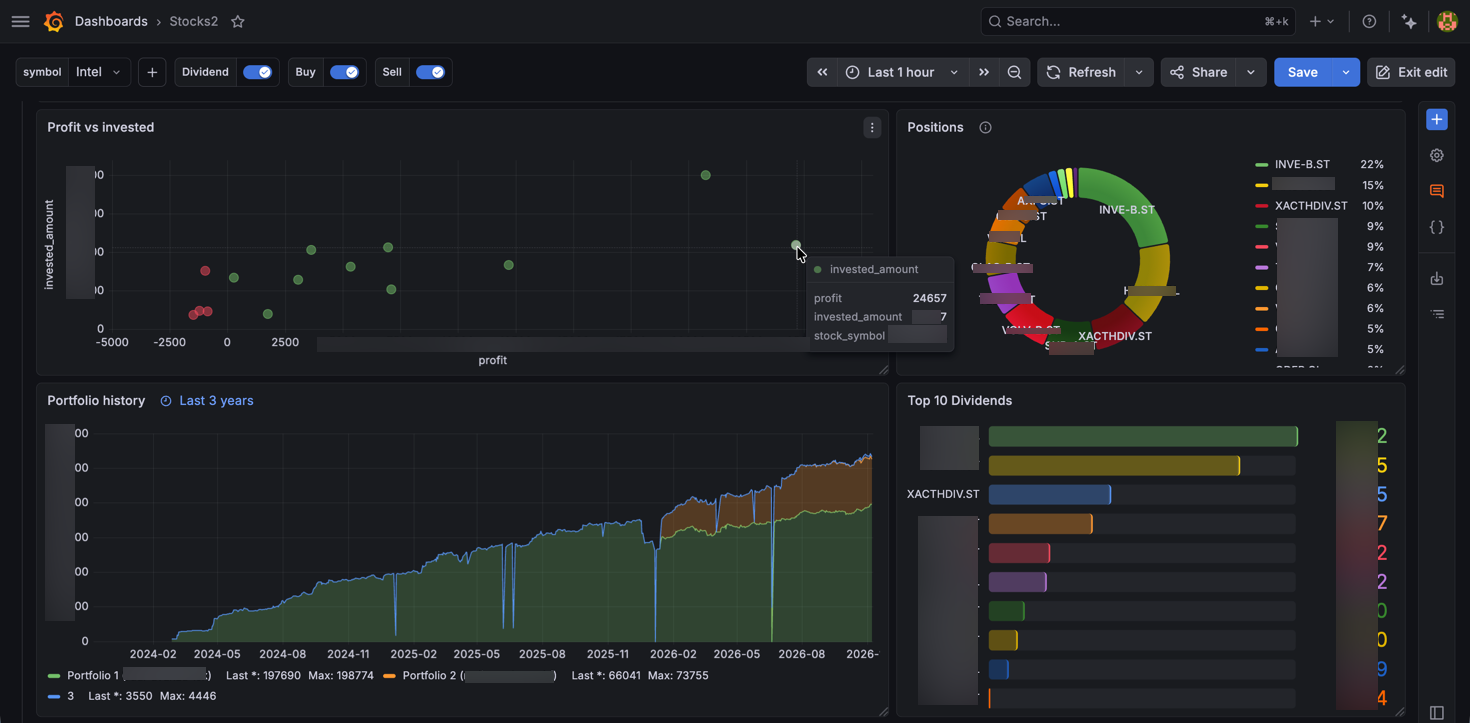
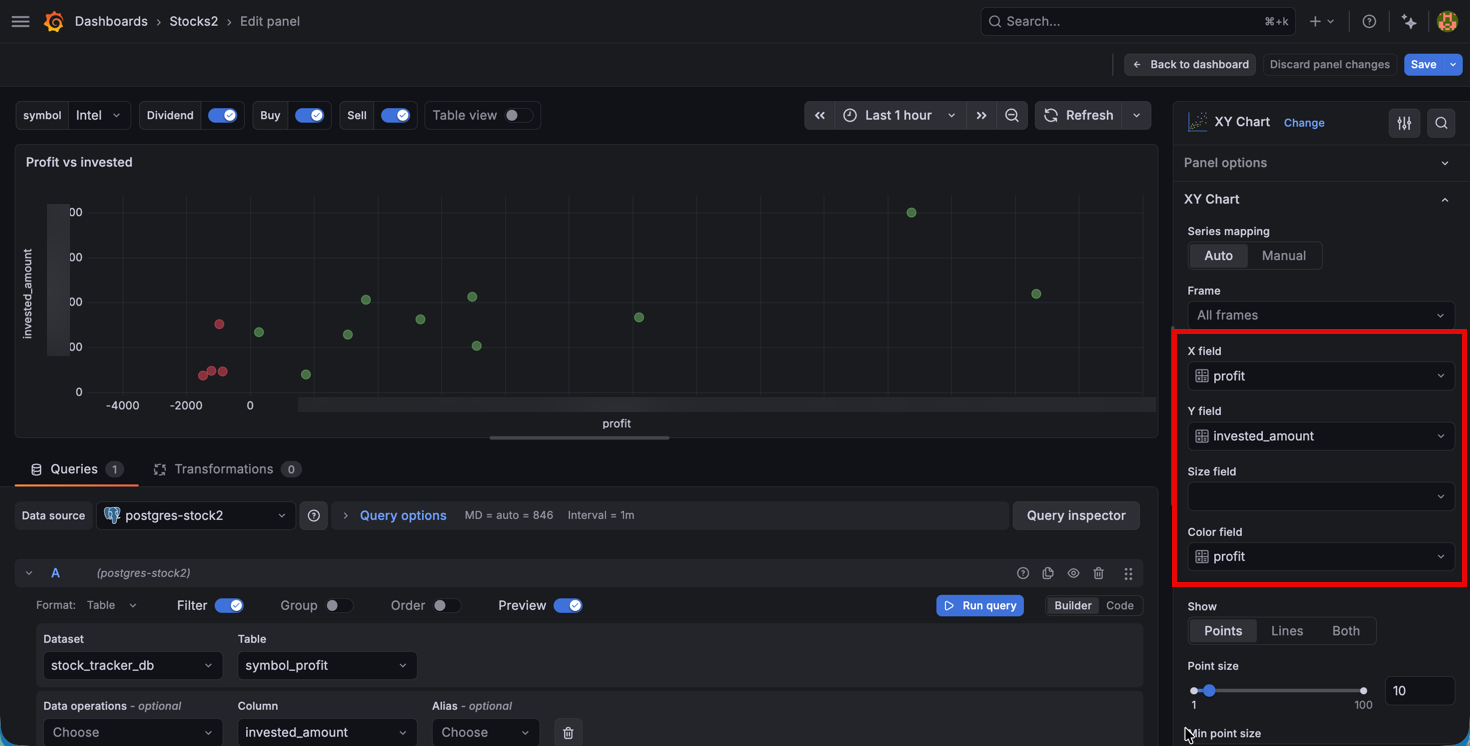
The most interesting of these are the profit vs invested panel where we're using a two-dimensional XY chart. The chart shows each position as a point. It's placed on the X axis by the profit made, and on the Y axis by it's value. The color of the point is devised by the profit and we're coloring based on normal thresholds.
Again a visualization that shows how entities relate to specific values, in this case the profit seen against the invested amount.
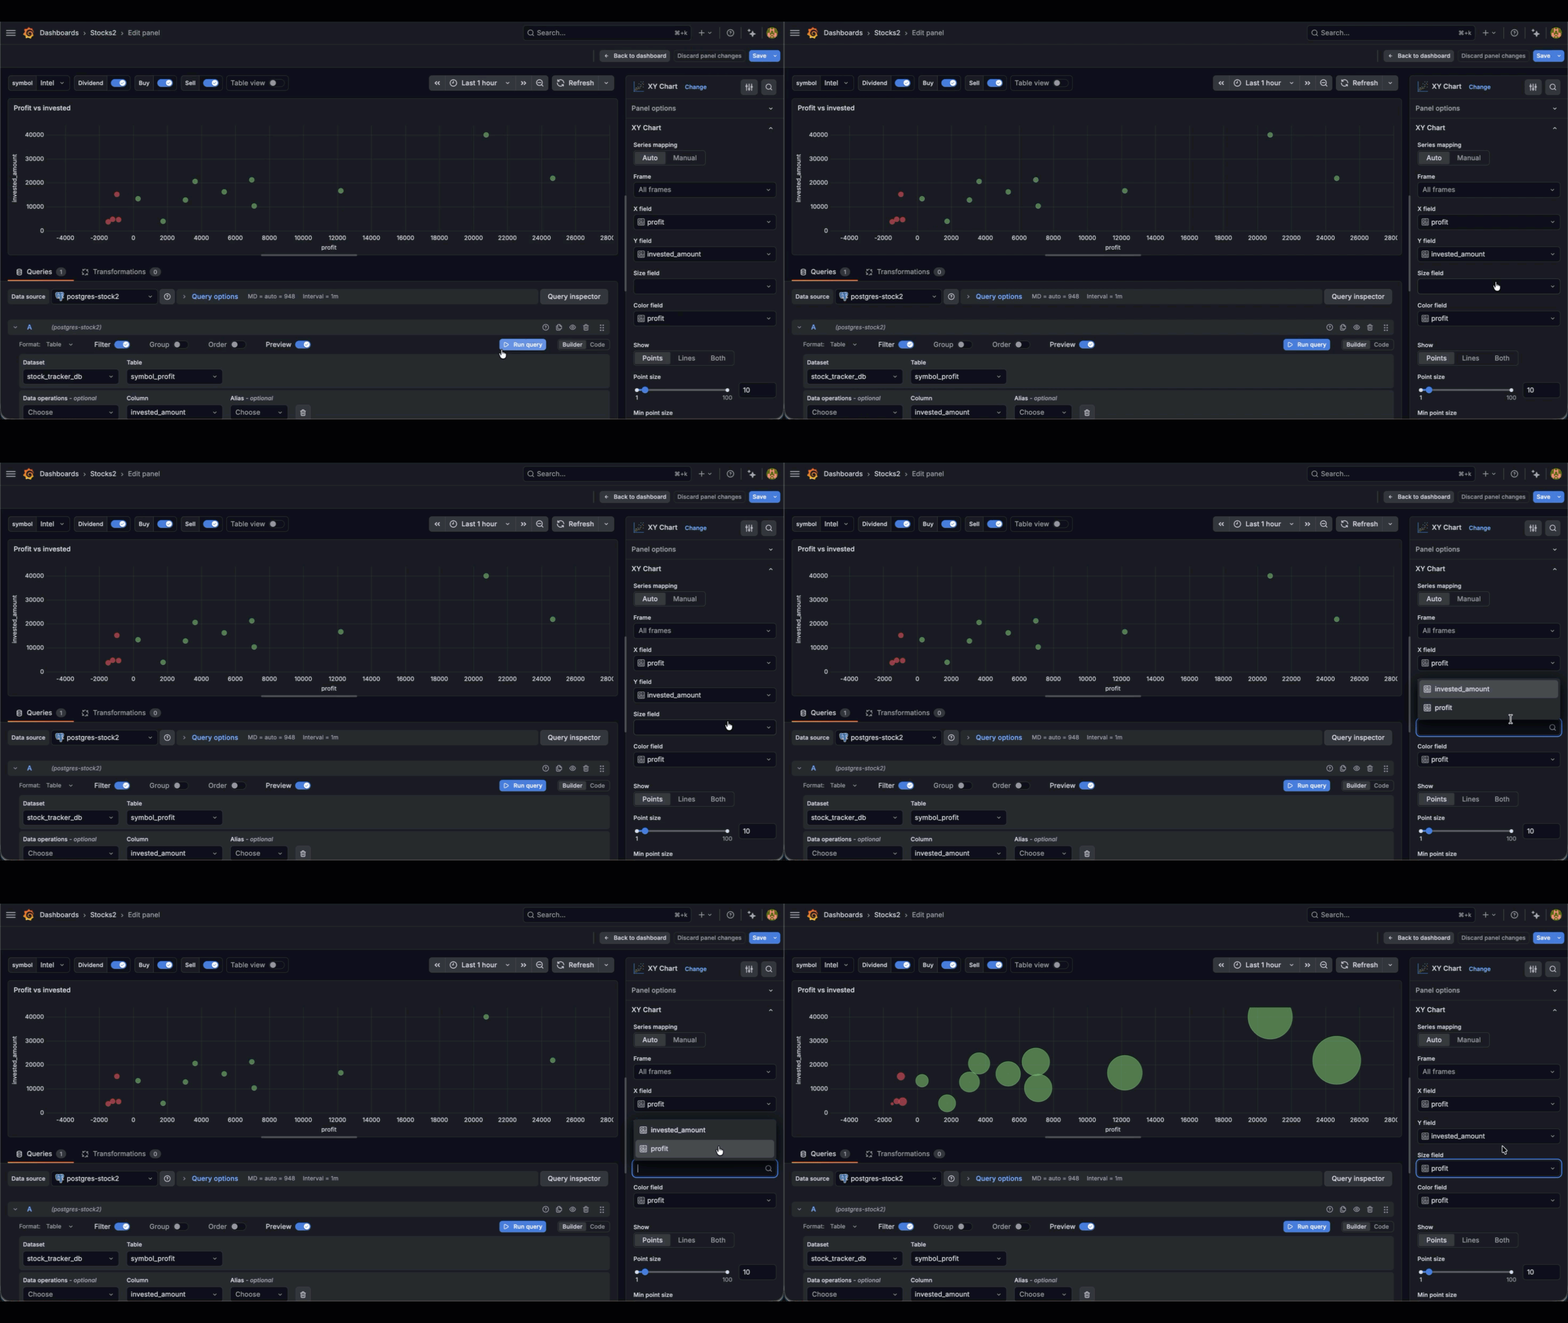
Other options to explore in the XY chart might be size of the points based on value
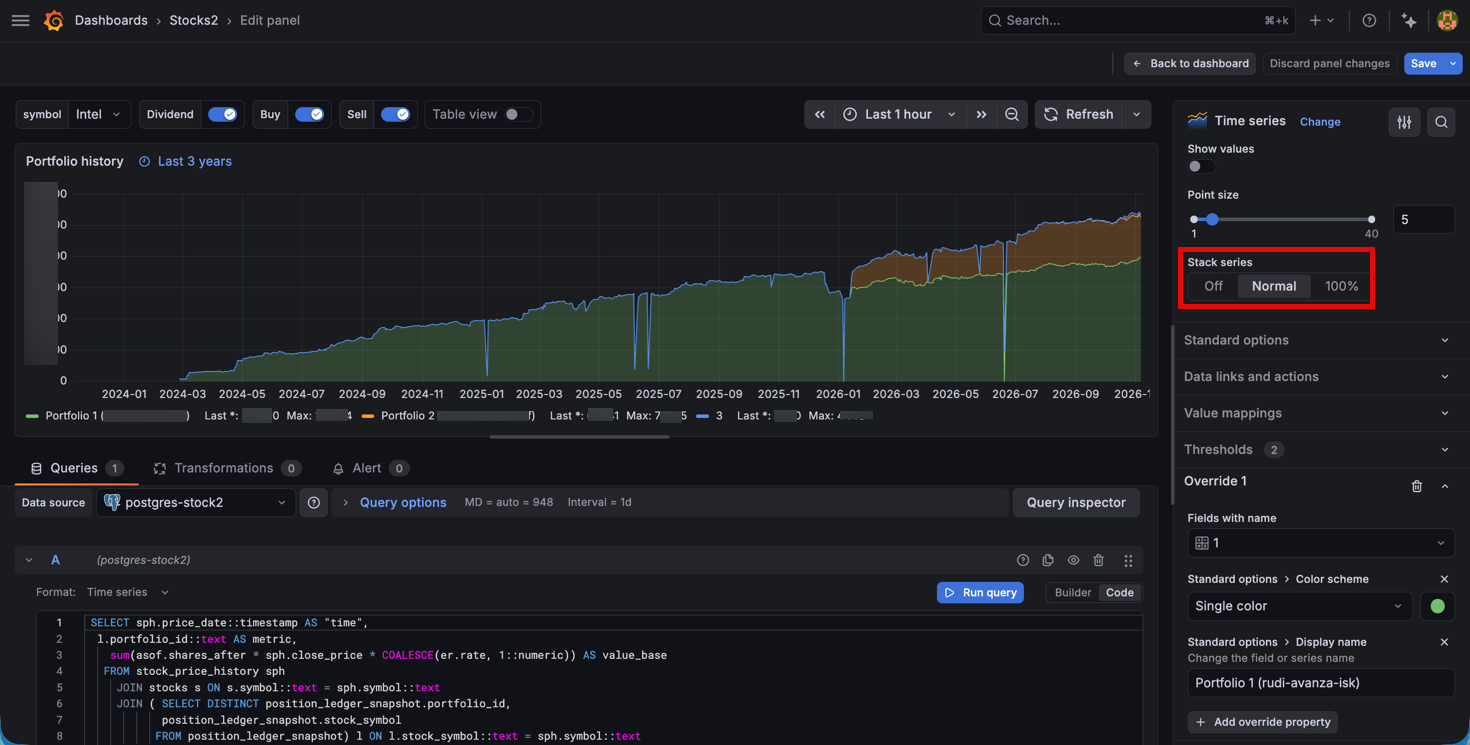
The history chart is a normal time series panel where we've stacked the series to show the total, and we're overriding the color and display name per portfolio
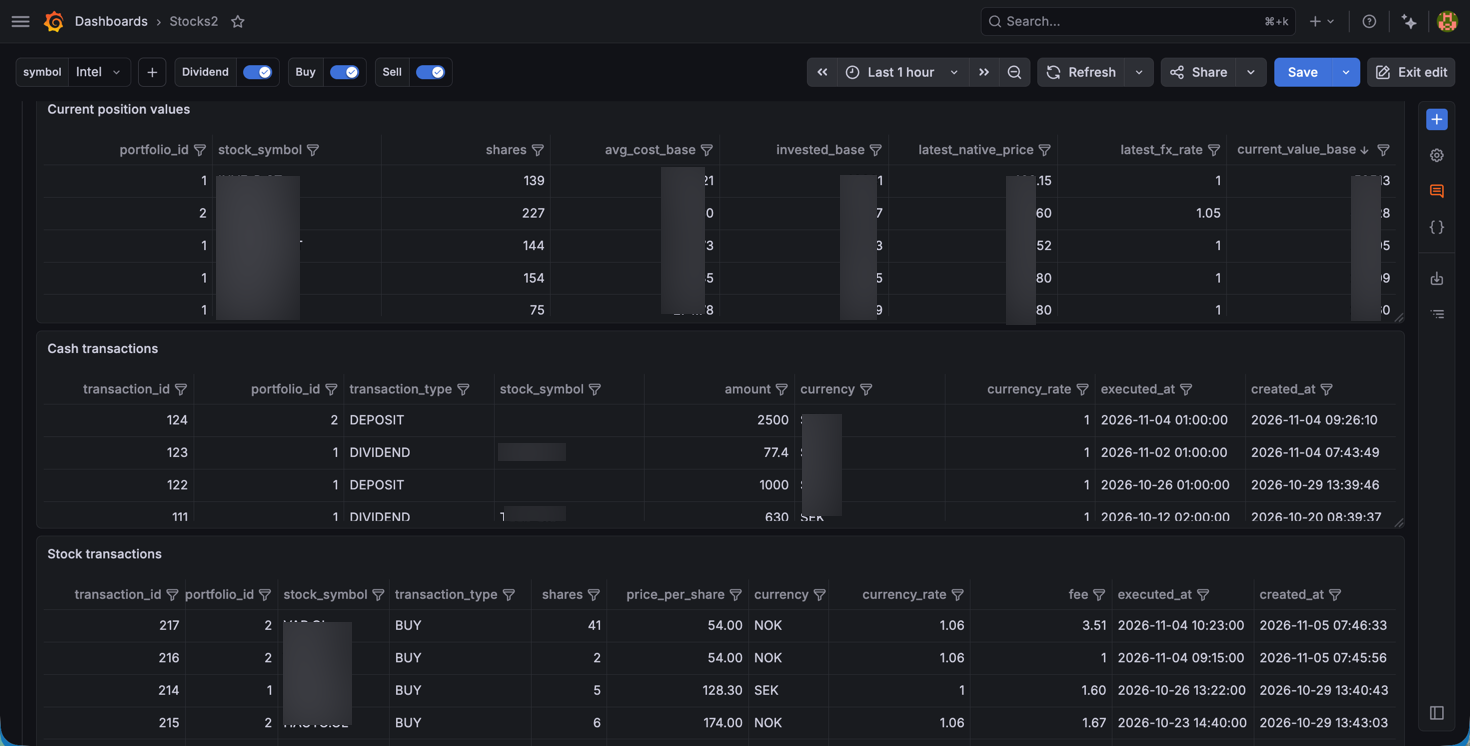
Next we have some tables where we list the current positions with more details, like the number of shares, the gav, etc. We have two tables visualizing cash and stock transactions respectively
Following these we have a row where we've combined panels that visualizes a specific stock. The panels are using the symbol variable.
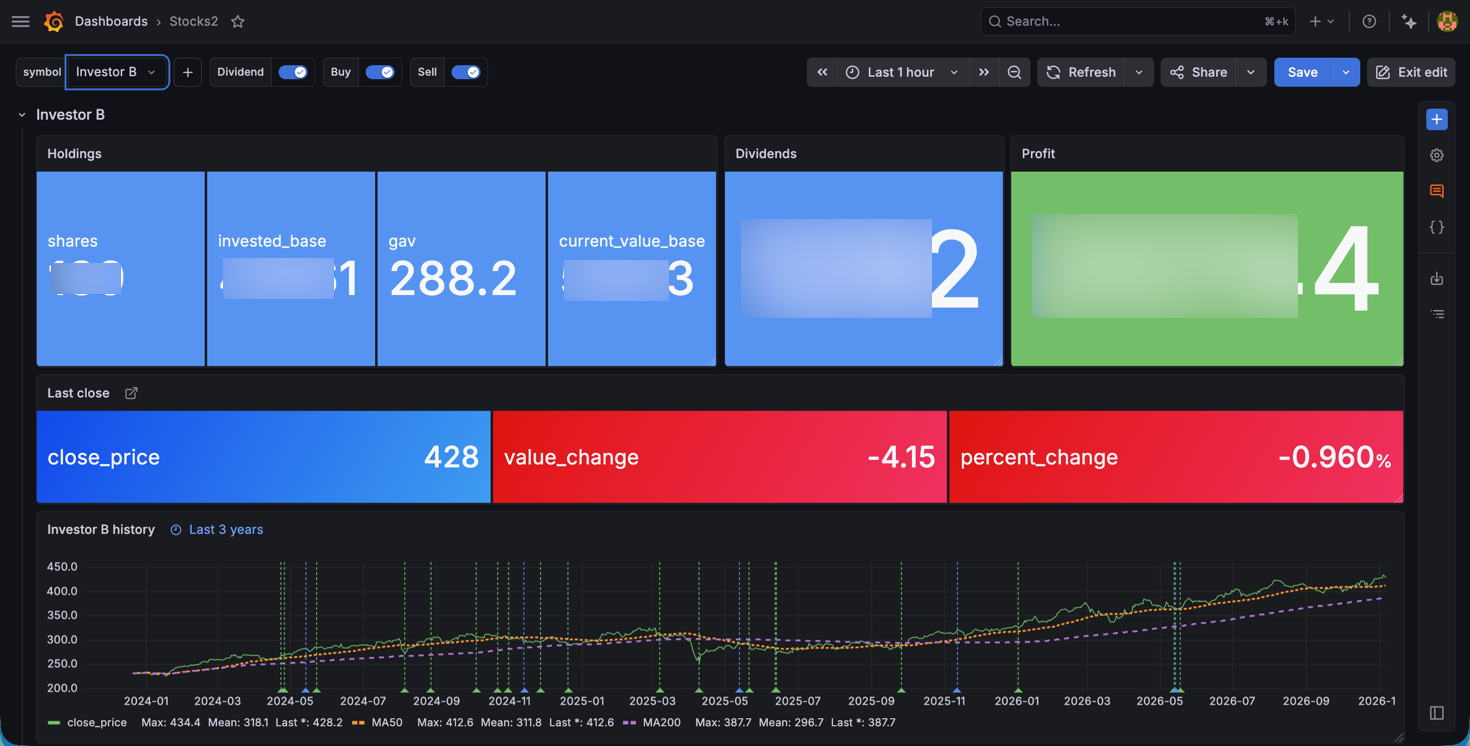
We're using mostly standard stat panels to show the holdings, based on number of shares, the invested amount, the current gav and the value. Next there's a panel to show the toalt dividend received as well as the profit. The profit panel uses color thresholds to show positive or negative profit.
The Last close panel is one Stat panel showing the last close price and the difference with the previous close. The values are all fetched from the database so nothing special happening in the panel. Again using standard coloring threshold.
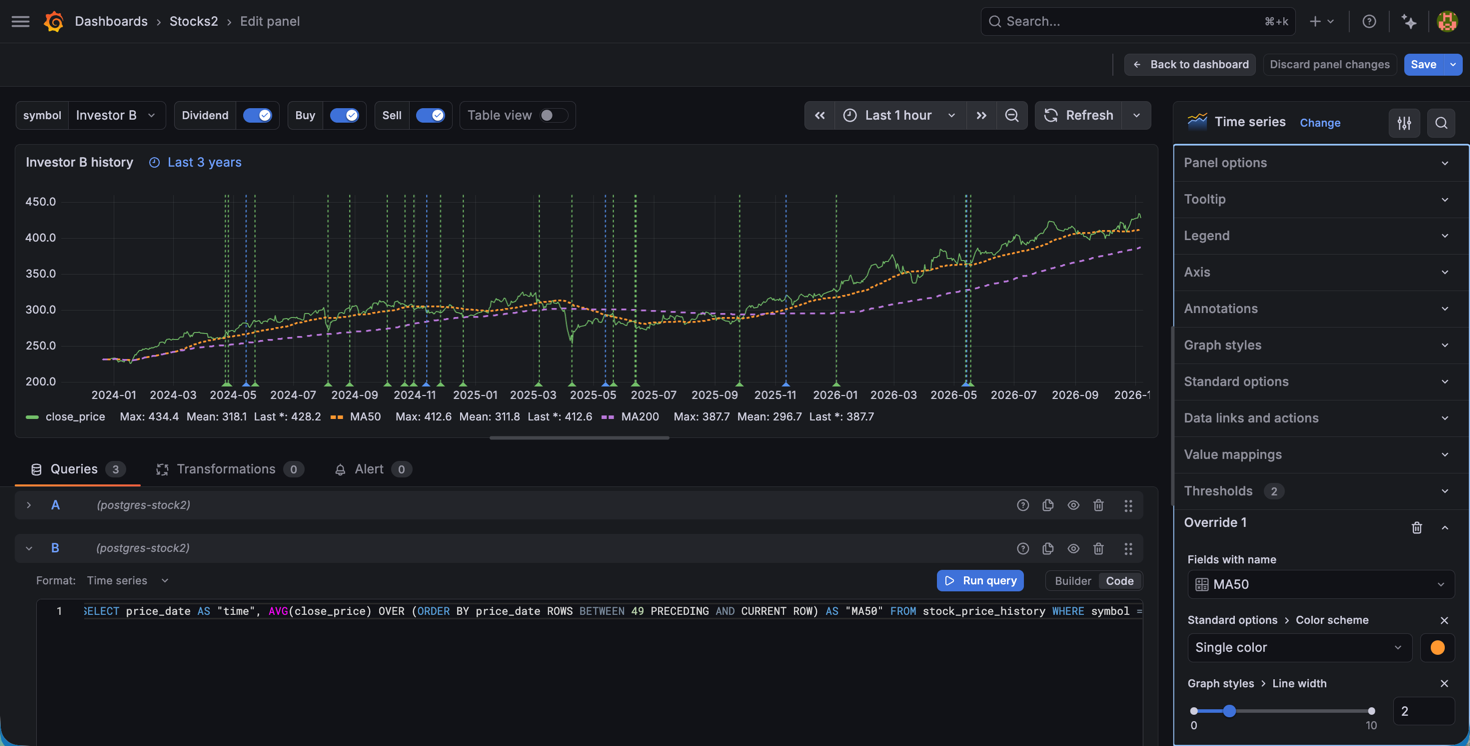
The history panel in this row is a time series panel where we show the historic price of the share combined with two queries to calculate MA50 and MA200 values.
Annotations
In this panel we're also visualizing annotations. These are also fetched from the database and matched on the symbol name. We're pulling these from a table storing transactions, dividends as well as buy and sell transactions.
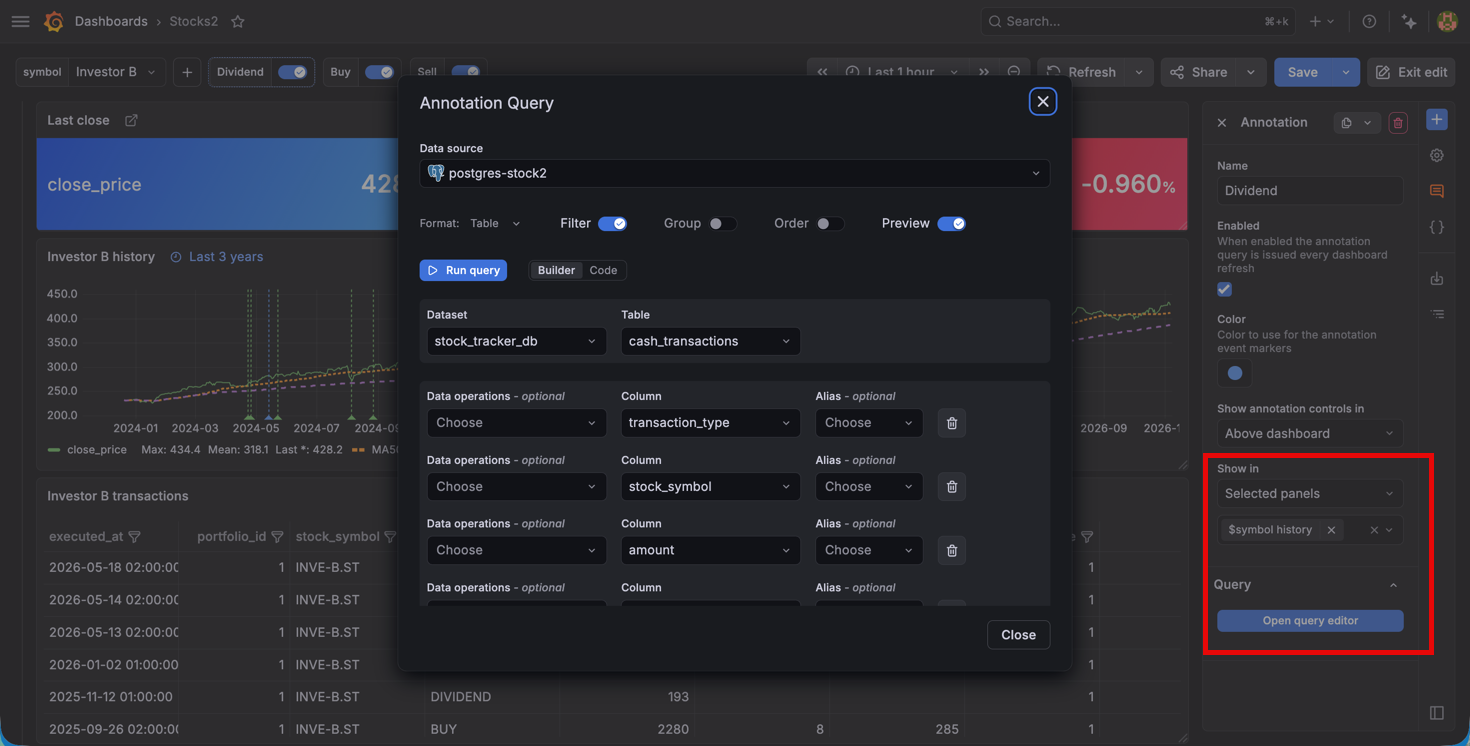
Annotations is a dashboad component, but as we can see from the options they can be tied to a specific panel. Annotations is a great feature to visualize when something might have happened, in this case a dividend or when we've done a stock transaction.
Finally we have a time series panel for showing the currency exchange rate history where we in the database track a few different currencies. And we have a table for the latest updates of stock prices, mostly to have a quick way of knowing if a stock price hasn't been updated
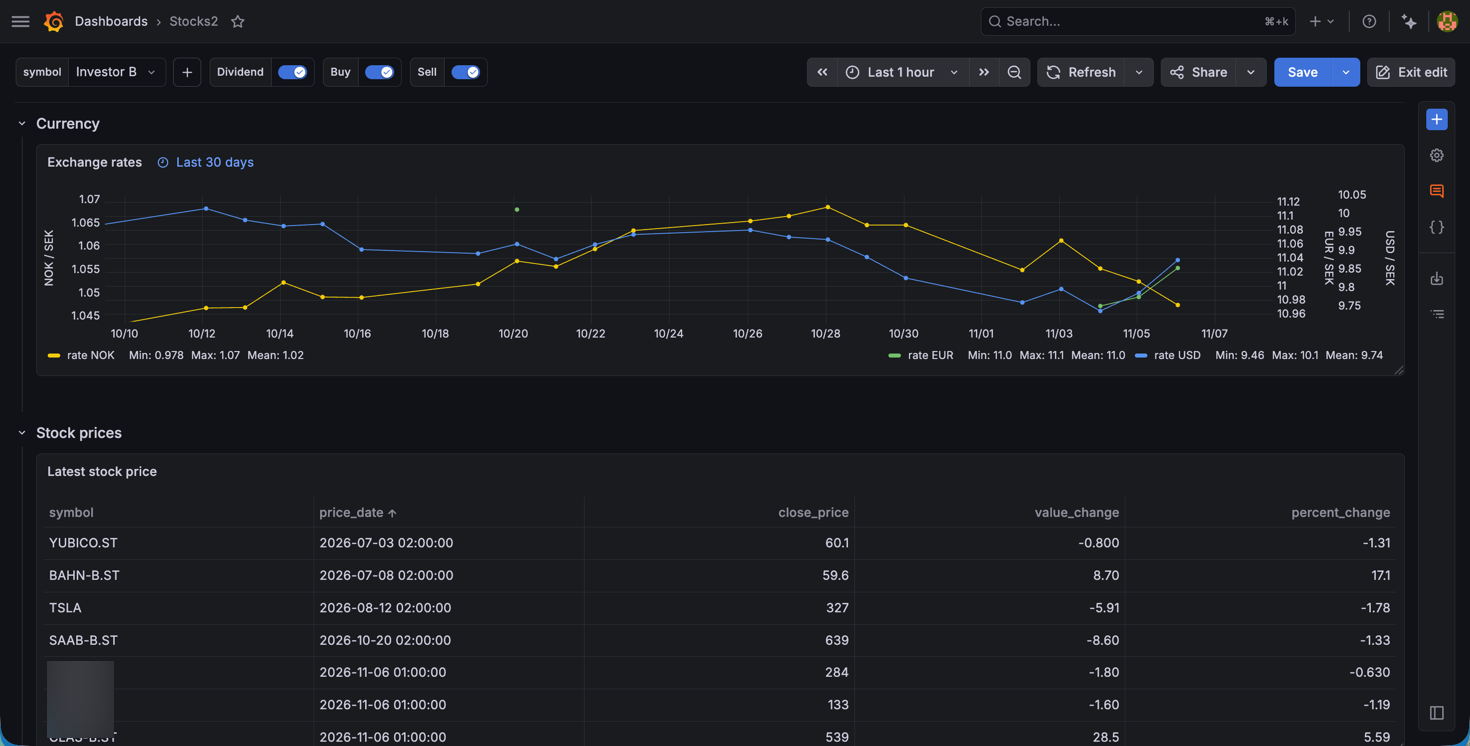
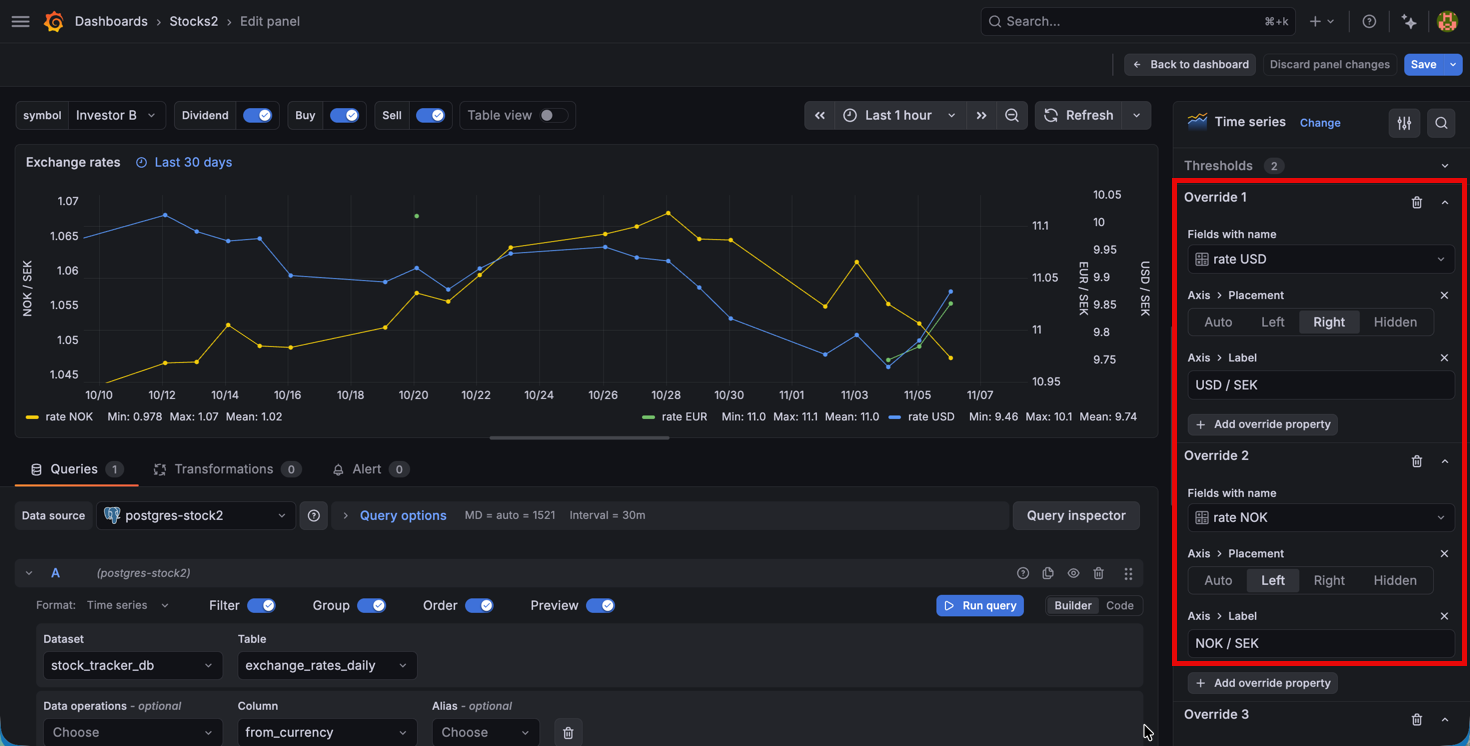
Since currencies can be based on different scales (i.e. 1 SEK vs 100 SEK), we use overrides to show them on different axises so we can get the level of detail
Summary
This post has been about taking a look at a few panels, and options, I've more rarely used in dashboards. The portfolio/stock tracking of it is just an example and the datasource and fetching of data is highly customized to fit my own needs.
Grafana has a lot of ways of customizing dashboards and with the new capabilities in Grafana Assistant you can also get help with it in the context of your own data. An example of how I've used it with the XY chart can be found here