Enable Grafana Assistant in a local instance
One of the announcements of this year's GrafanaCON in Barcelona was the availability of Grafana Assistant also on self-hosted deployments. In this post we'll take a look at how to enable it and test it against a dashboard in my local Grafana instance.
Note that at the time of writing there's still a need for a Grafana Cloud connection since the AI magic is performed in the cloud, with Grafana's LLMs. The local Assistant plugin will forward the LLM requests to Grafana cloud and act on the response in the local instance.
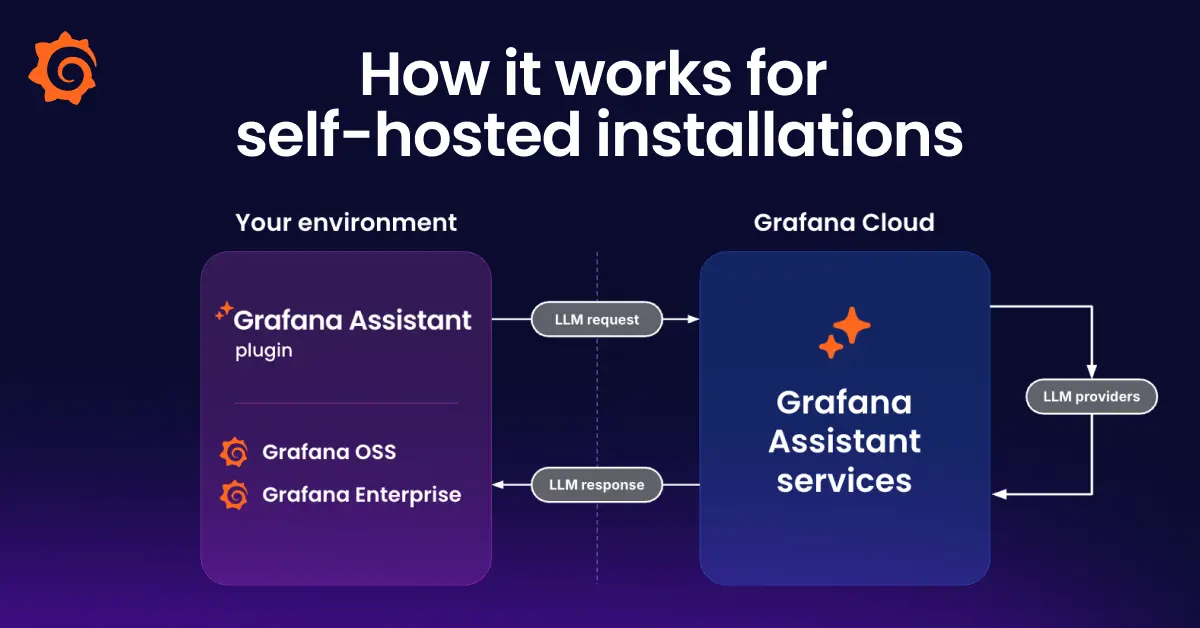
The documentation for the Grafana Assistant setup in a local/on-premises deployment details how to set it up, but we'll take a quick look at how easy it is to get started.
Enable Assistant in Grafana Cloud
First you'll need a Grafana Cloud account. Even free accounts gets usage credits for Assistant which is quite nice, and everything shown in this post is done with a free account.
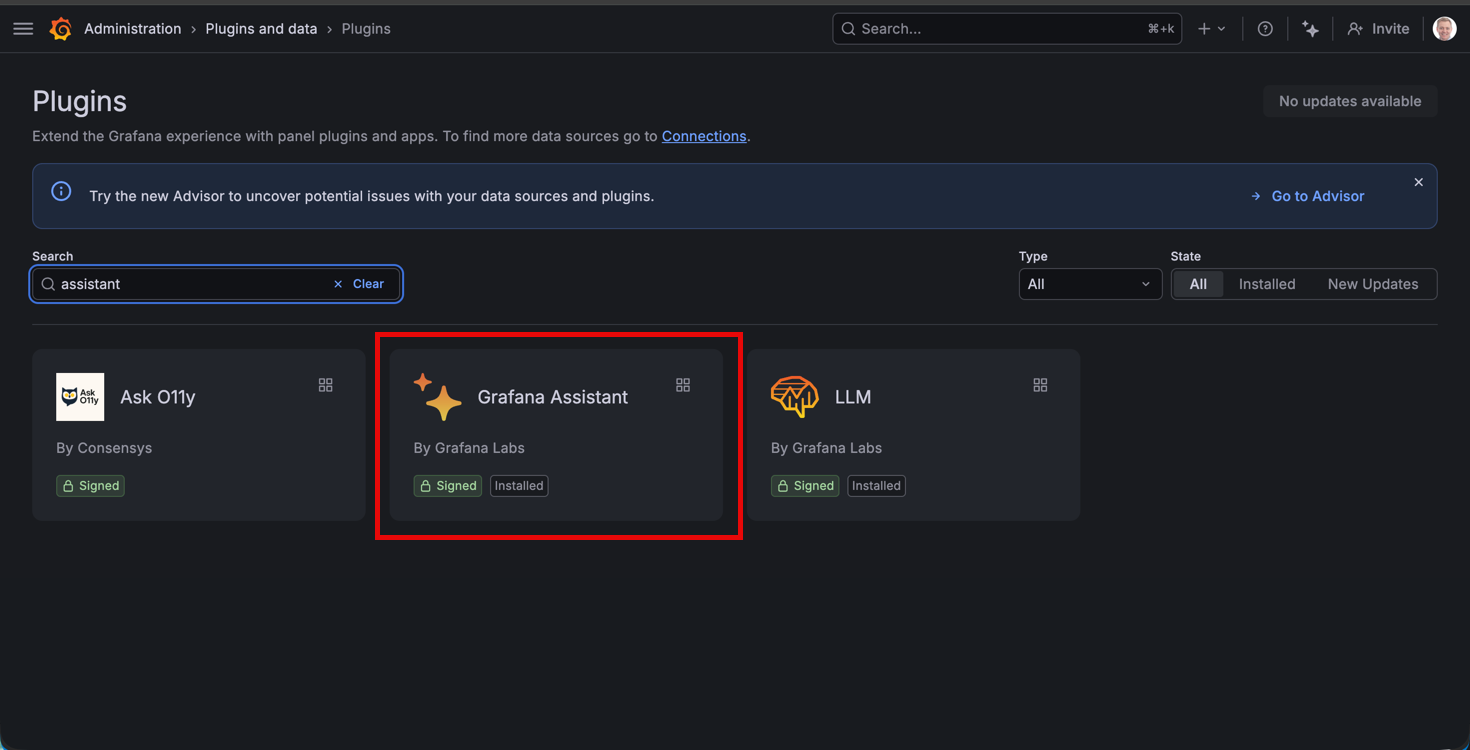
In your Grafana Cloud instance ensure that Assistant is enabled. Go to the Plugins page and find Grafana Assistant
Now let's enable the plugin
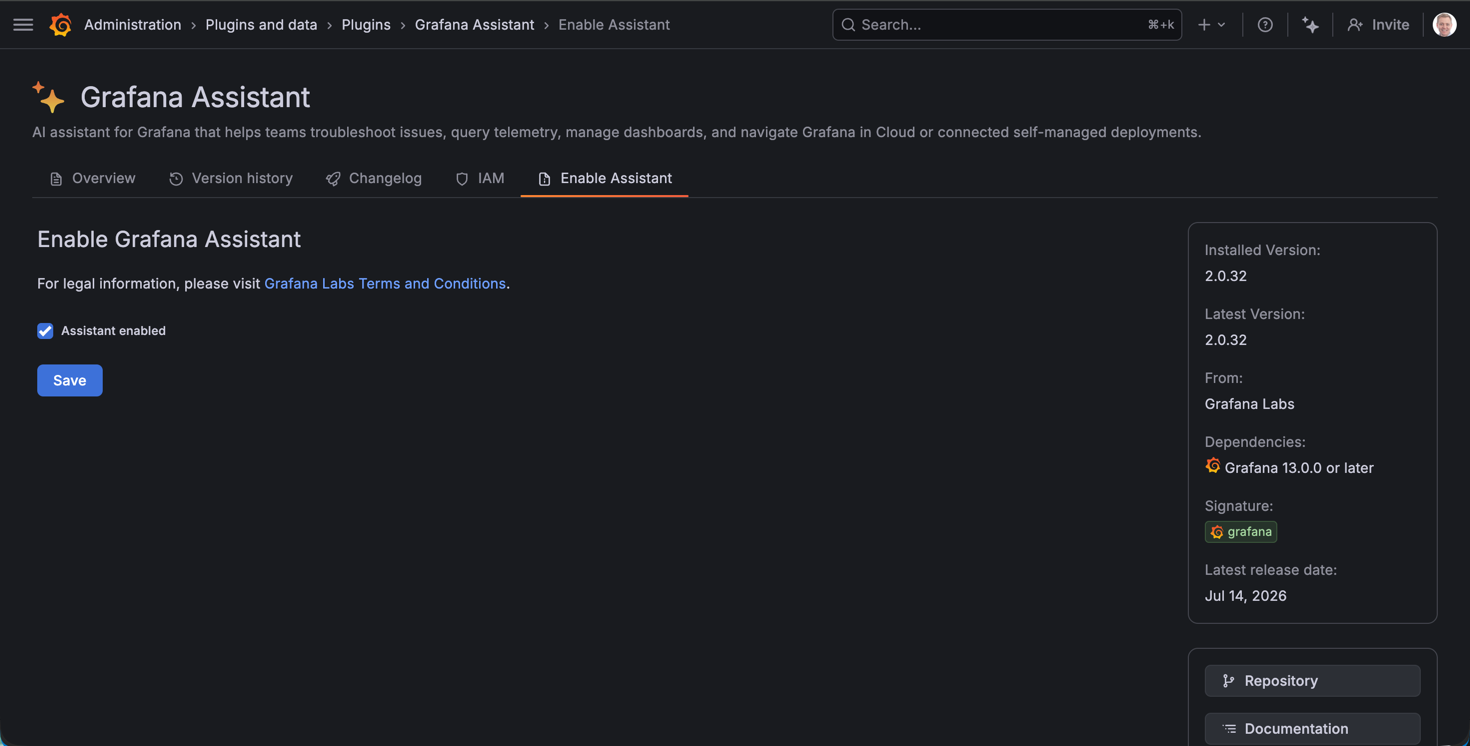
After hitting Save we'll get redirected to the Grafana Assistant page where we can start prompting
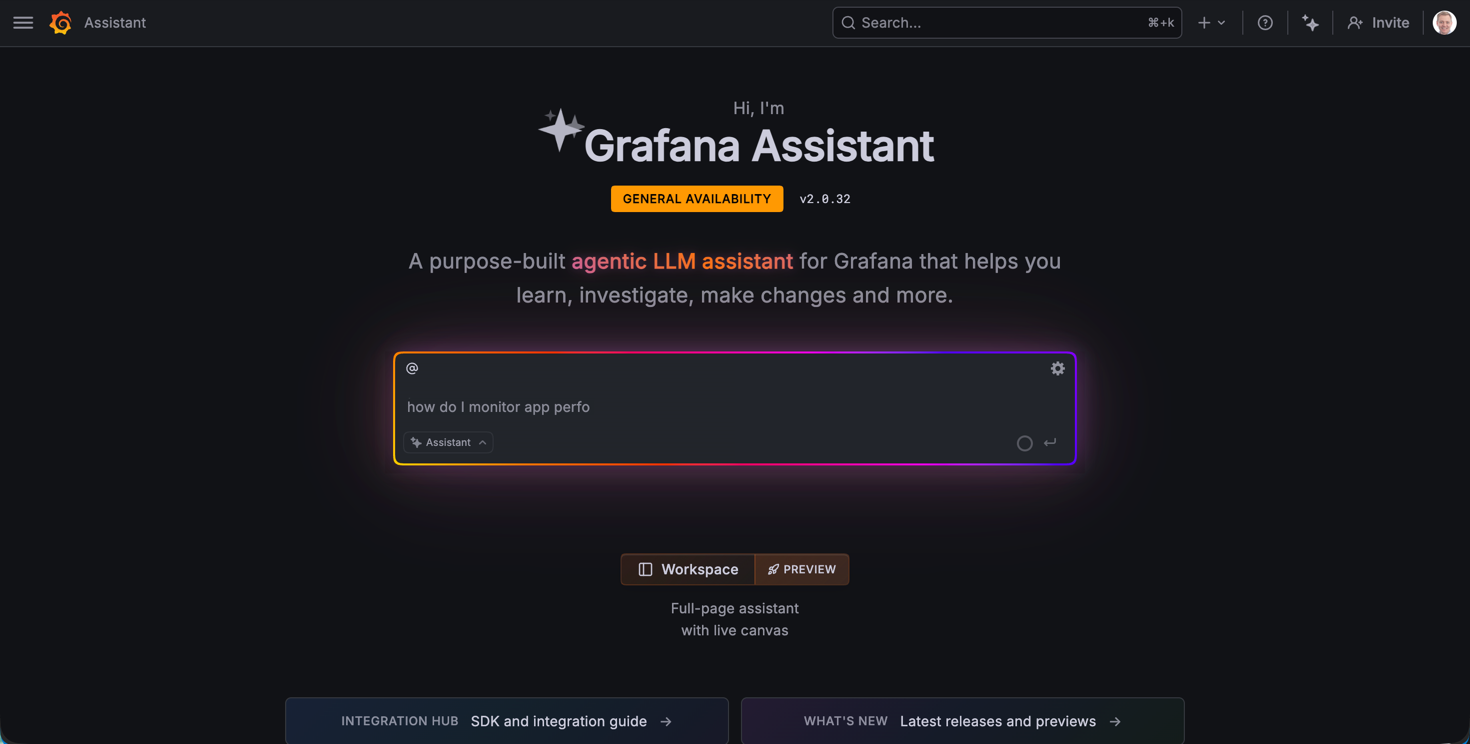
We'll not run any prompts from here, but instead we'll switch over to our local instance and enable Grafana Assistant.
Install and enable Grafana Assistant plugin on local instance
Again, let's find the Grafana Assistant plugin
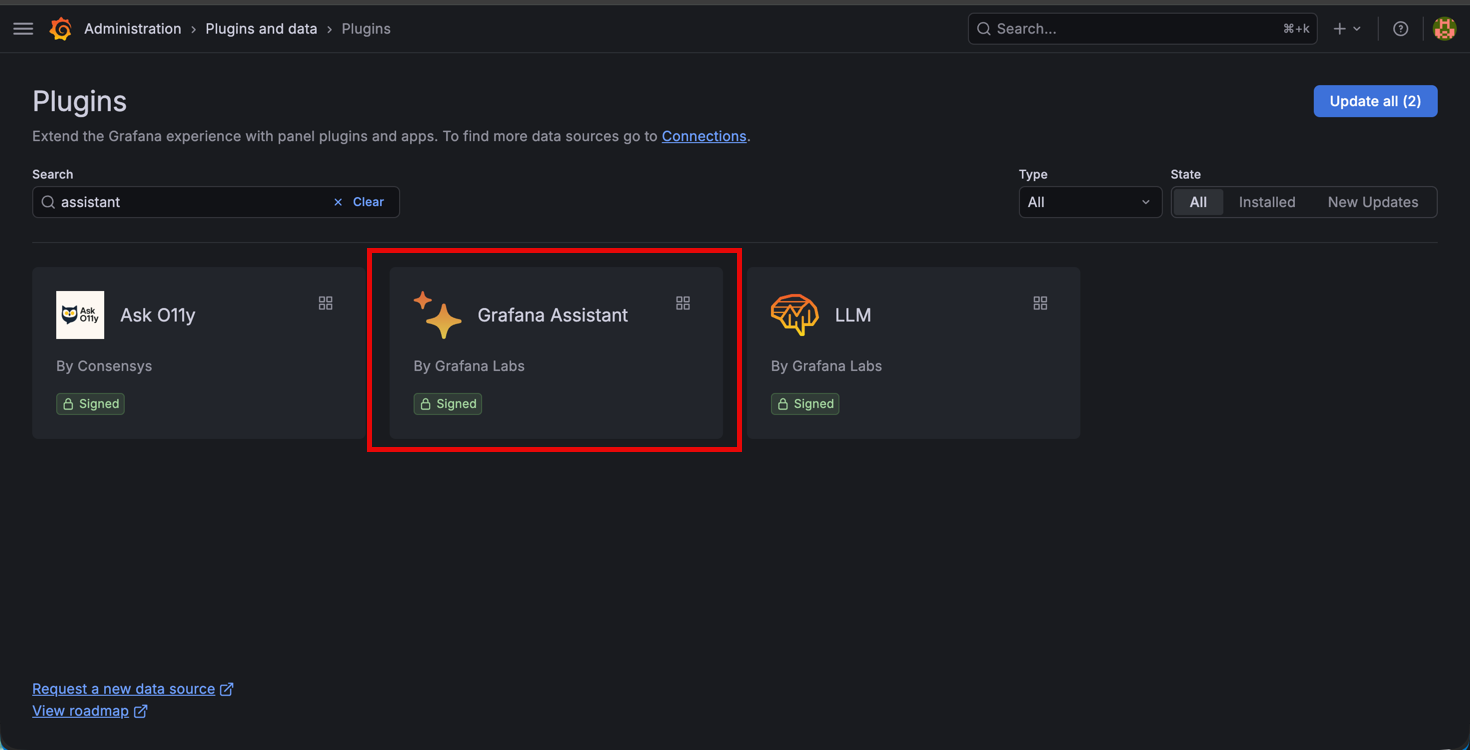
We'll hit Install in the top right corner
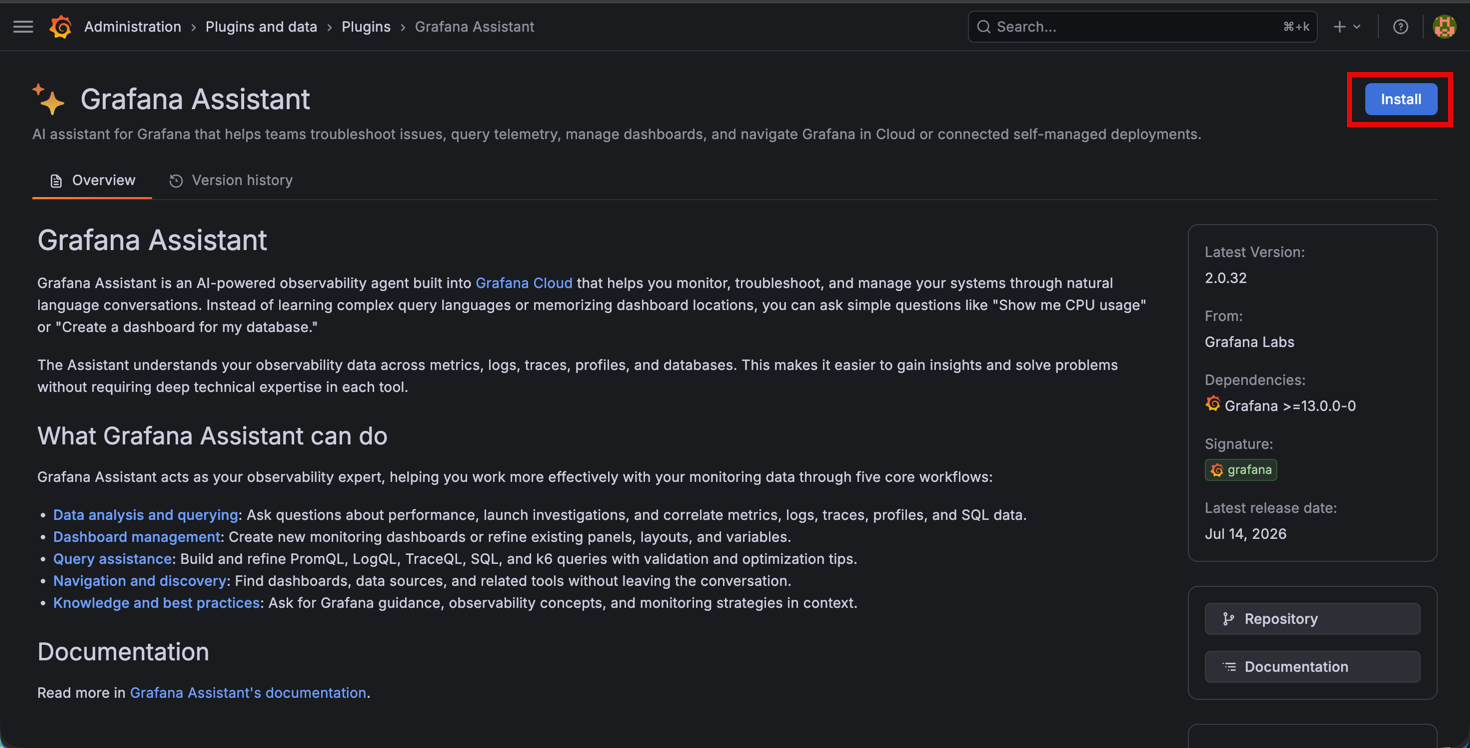
After installing the plugin we'll go to the Connection tab. Note that you might have to refresh the page after installing the plugin before the tab is available
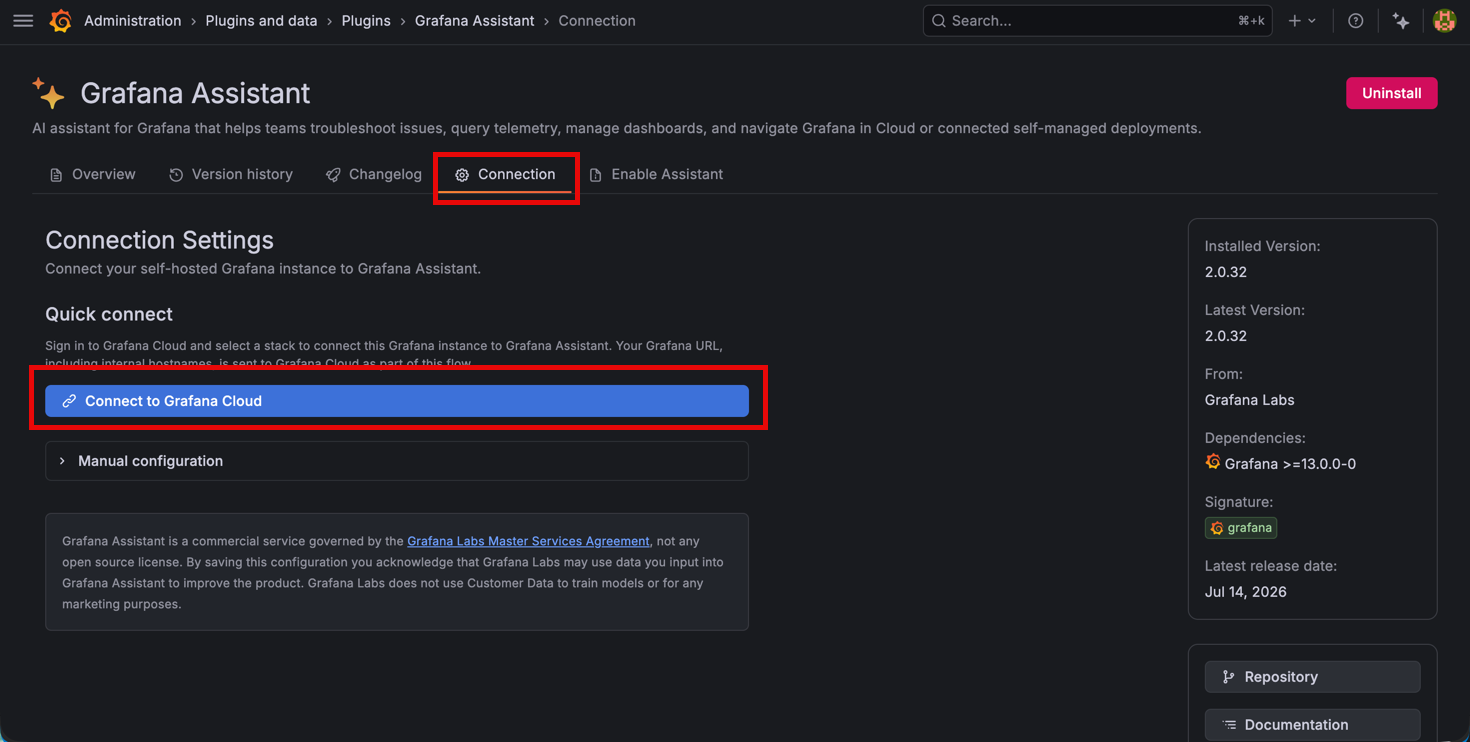
Now we'll hit the Connect to Grafana Cloud button to connect our local instance to our Grafana Cloud org
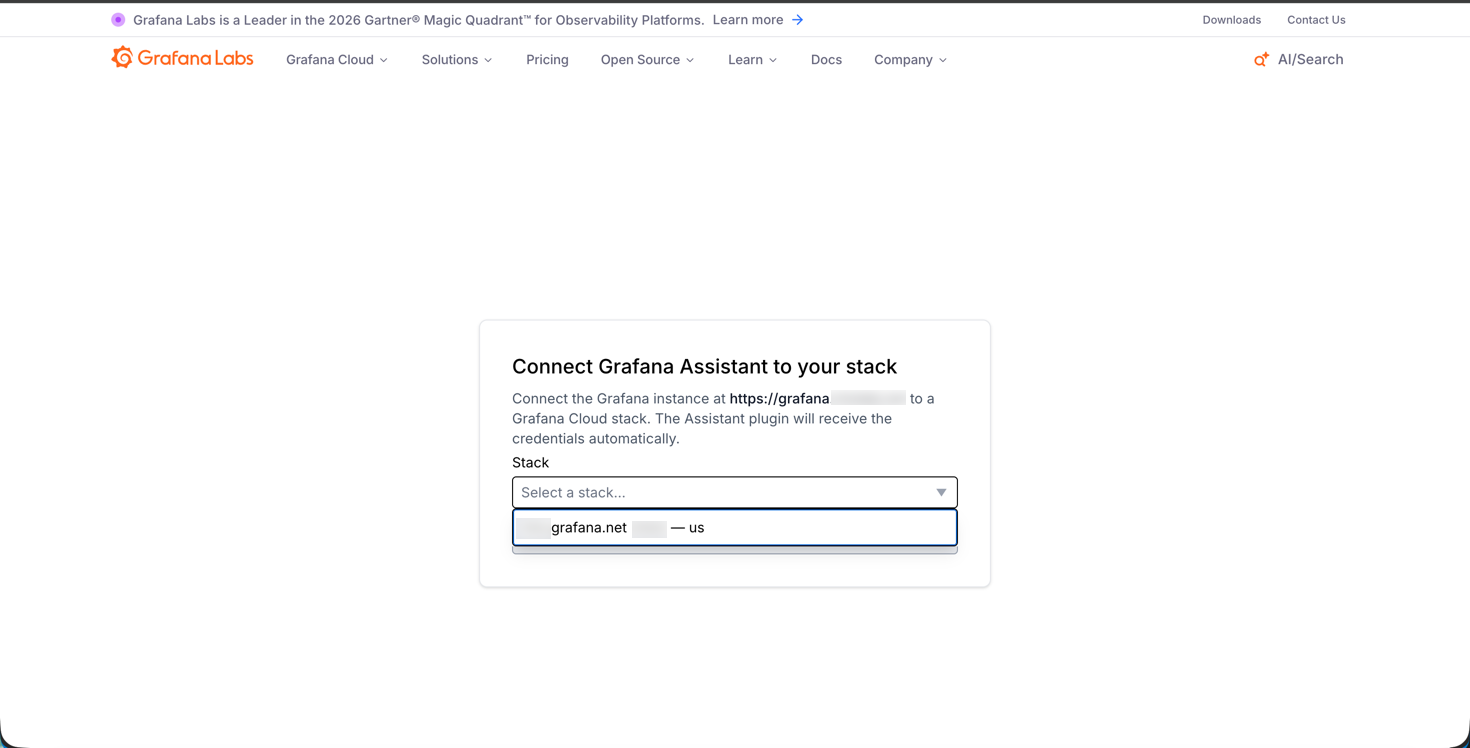
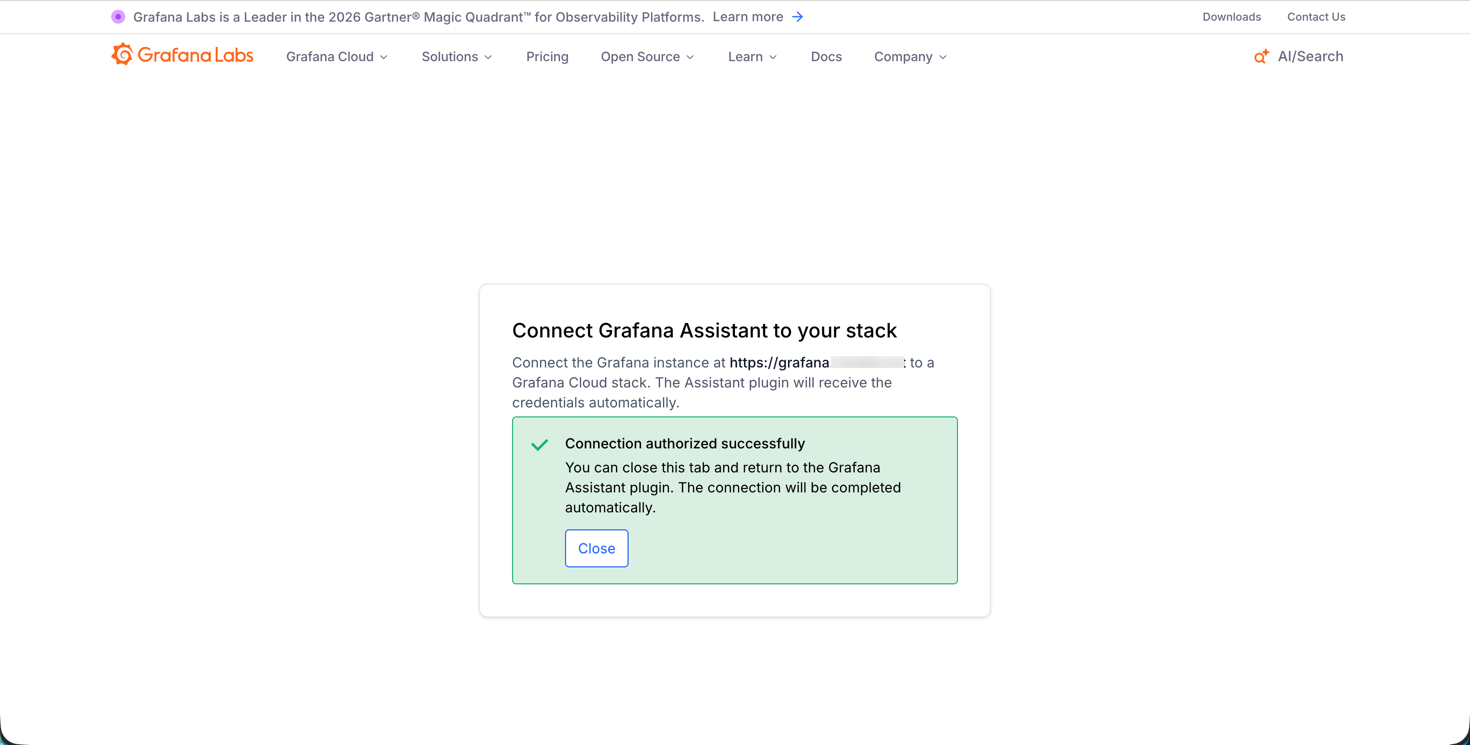
After successful connection you'll get the green confirmation box
And your plugin page will show the Connected status
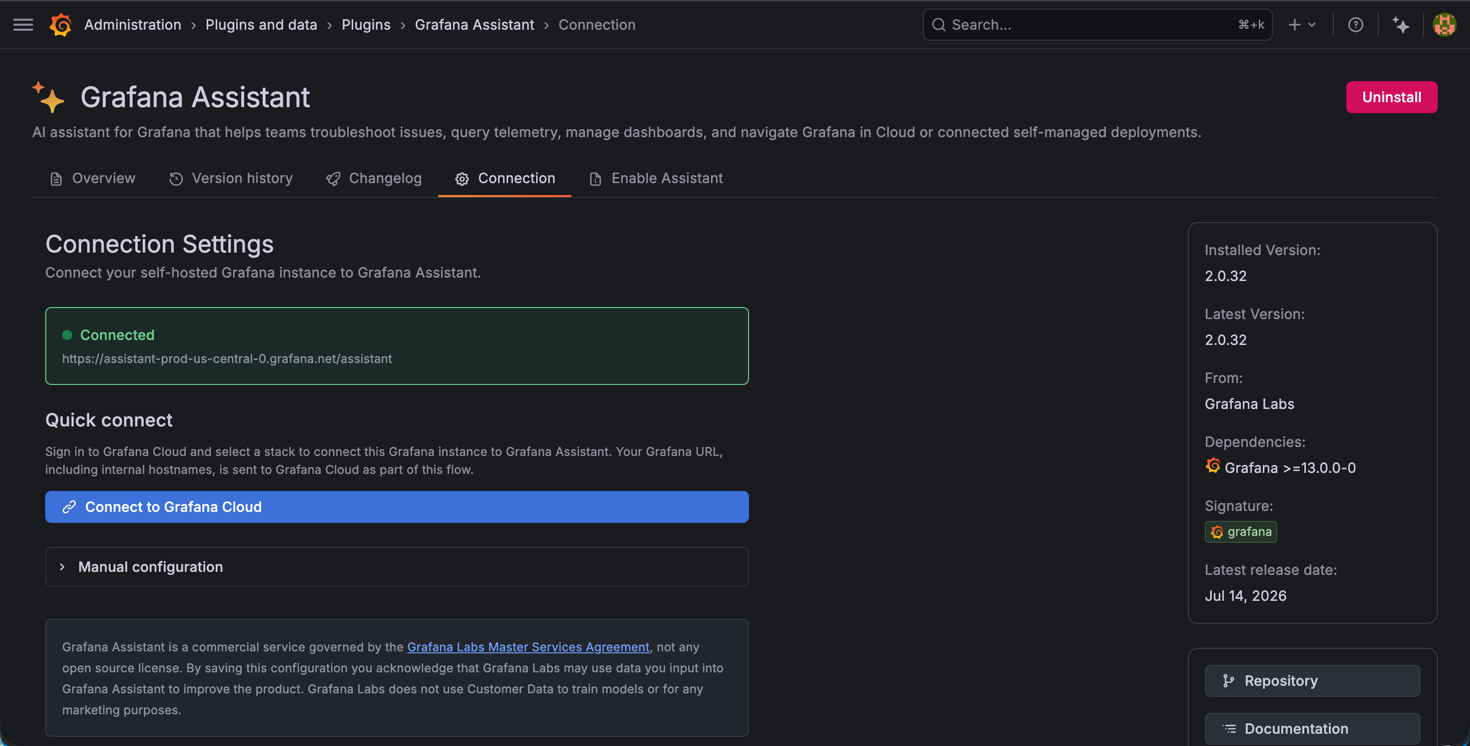
That's it for connecting Grafana Assistant locally to the Cloud. Now let's test it
Edit panel with Grafana Assistant
In a Dashboard I have an XY Chart that shows the correlation of invested amount and profits for stocks. Since XY charts have a lot of different configuration options and multiple fields and options for each field, it can be difficult to get it right.
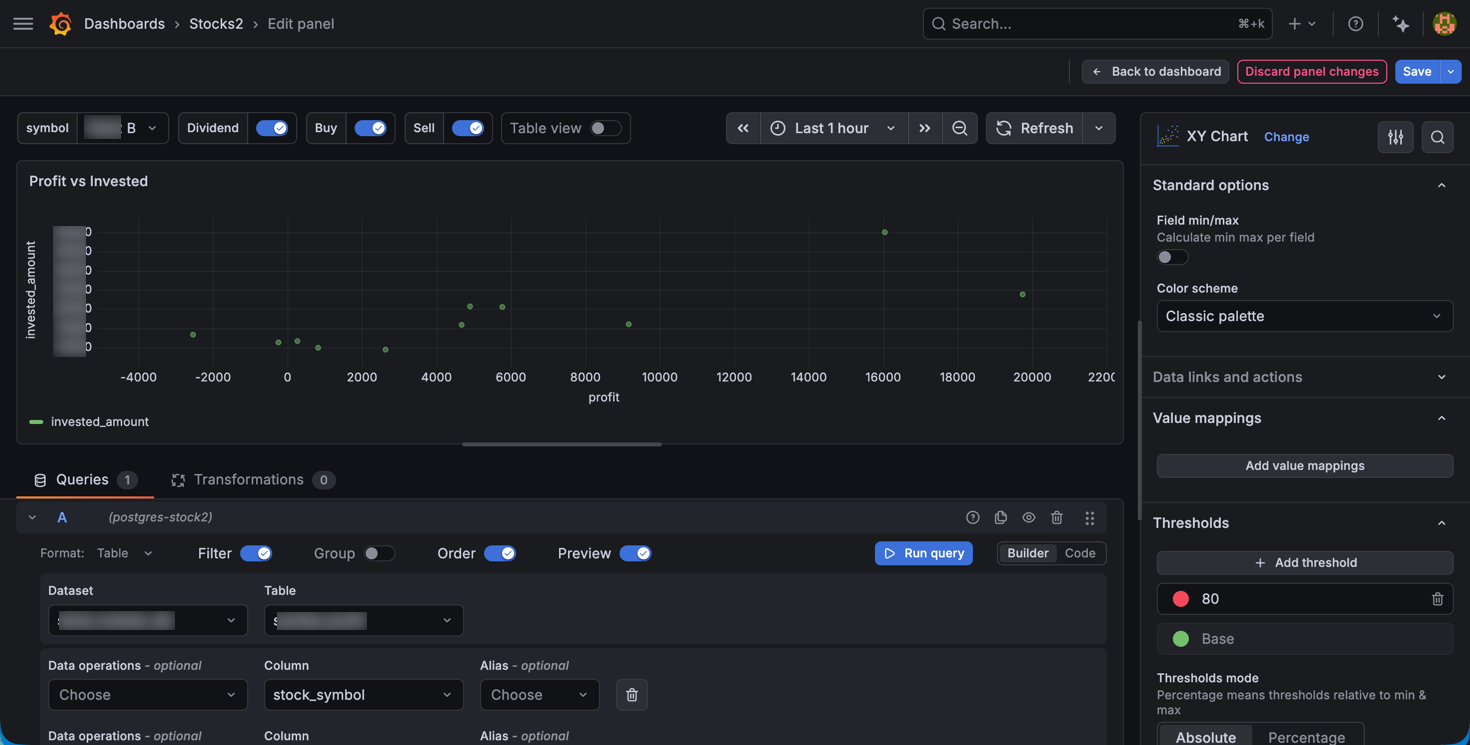
Here's the chart after setting up the query, using the default Classic palette for color.
If we change the color to From threshold each point goes black even though the color scheme is set to thresholds. (Hint: The solution would be to set the color field in the chart options)
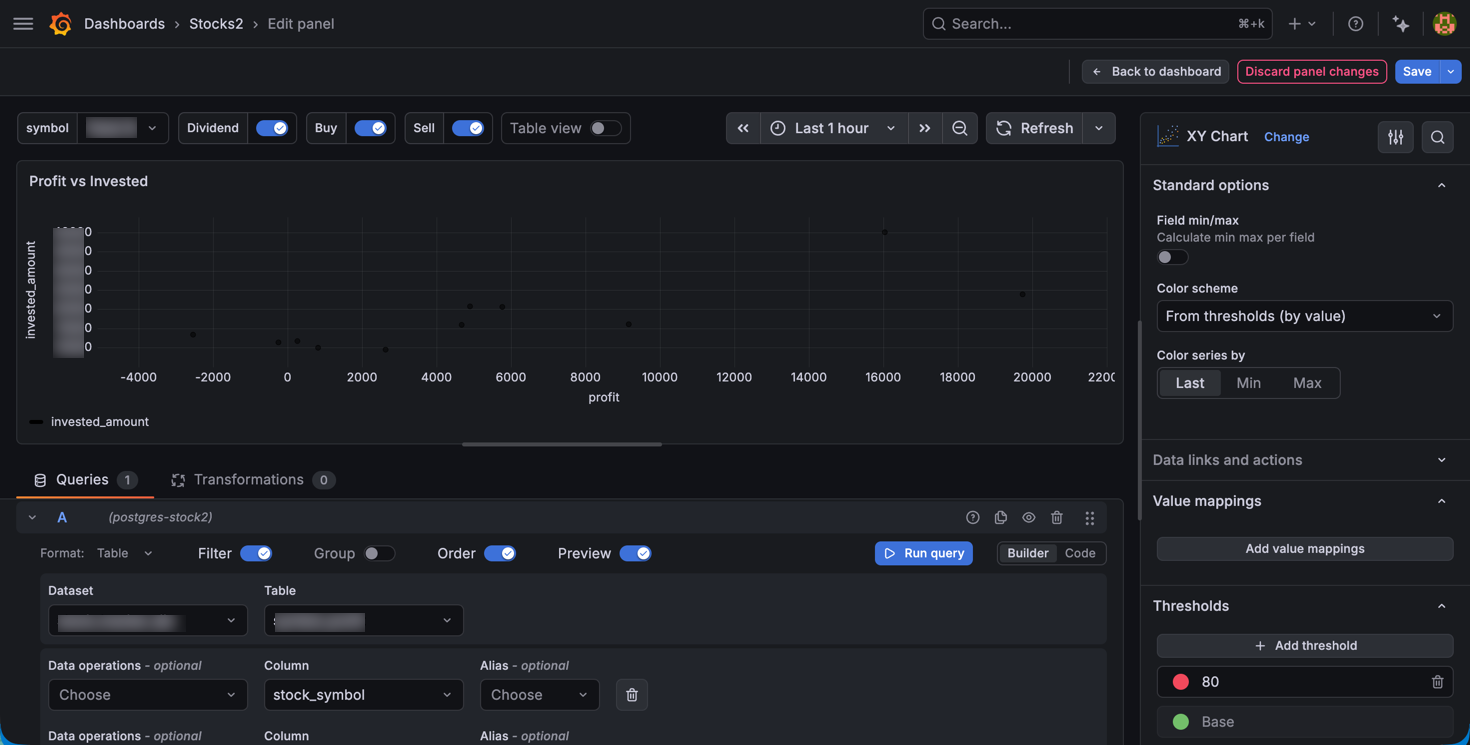
We could switch to single color green (or back to classic)
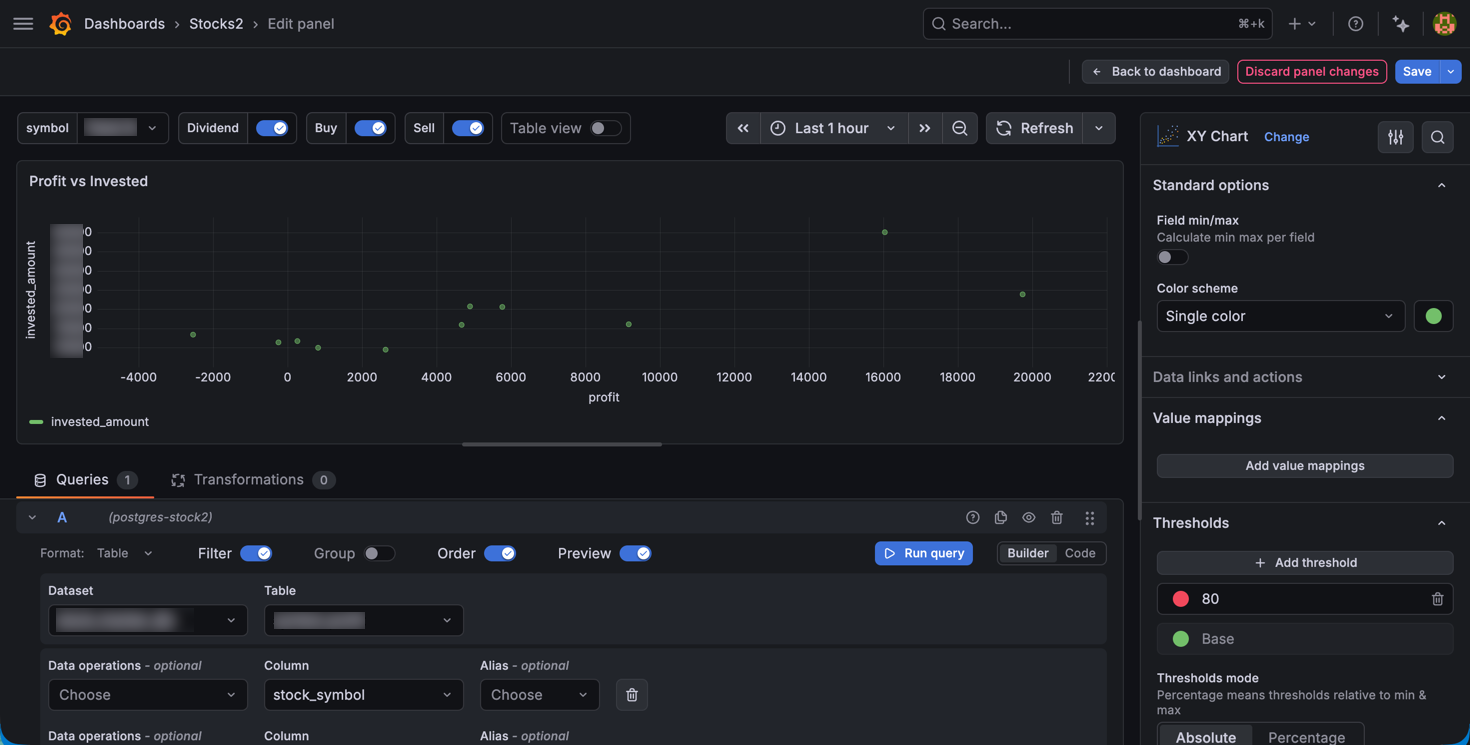
What I'd like is to have the points where the profit is negative to go red. Let's have Assistant help us with that.
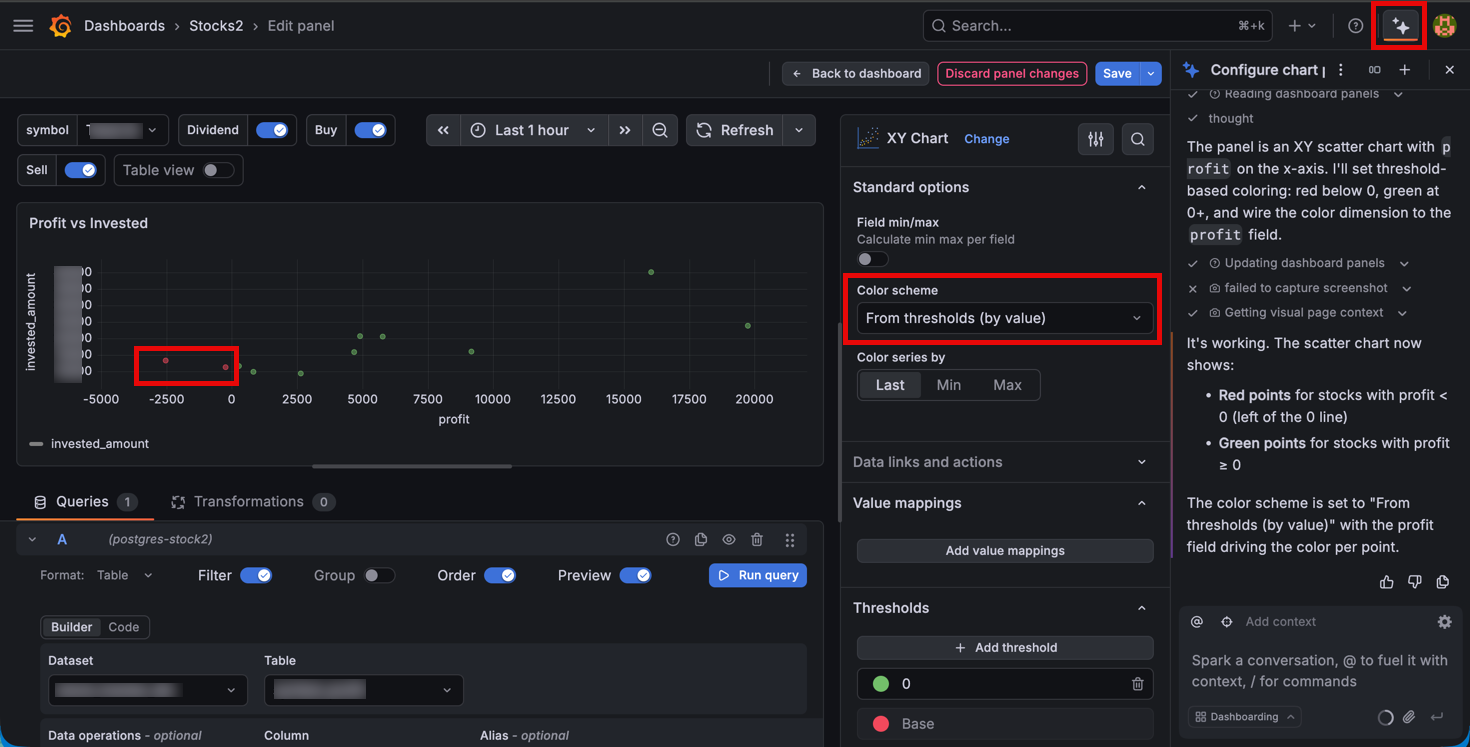
In the dashboard we'll hit the Assistant link in the top right corner to open a new Conversation.
The prompt used: In this chart I want the points to be red if the "profit" value is below 0
After thinking for a few seconds Grafana Assistant delivers
Summary
Even though this example might be quite simple it shows that in a matter of seconds Grafana Assistant can help with configuring charts and panels
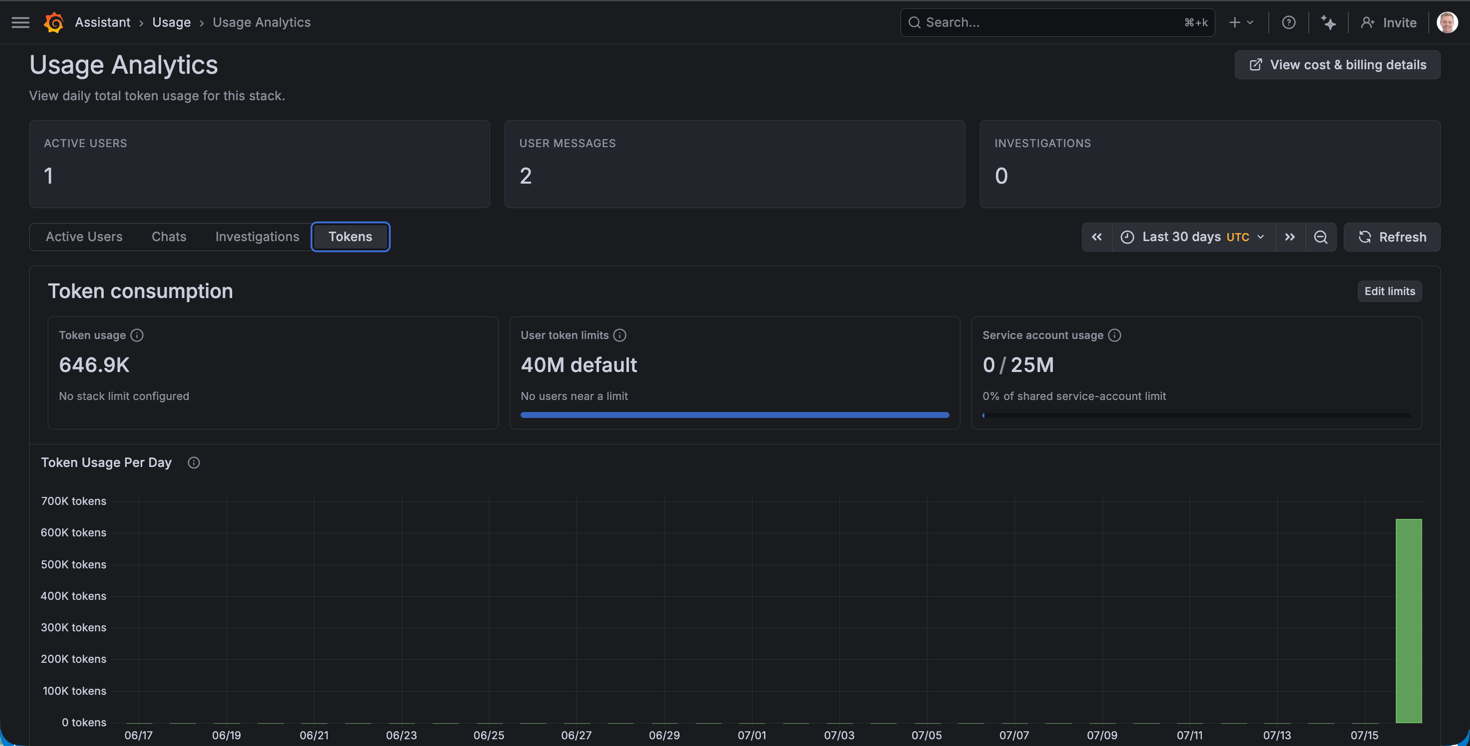
So how much did this cost in terms of tokens?
As always when it comes to AI use it with care. After learning how to configure a chart you'll maybe do it manually next time and let Assistant help you with tasks that are more difficult or time consuming.
Another point it this, at least for me, is that there's more to a dashboard than just the charts and panels. The dashboard is there for you to understand the status of your stuff and how it performs, and to understand you'll need to know what to look for and what's behind the values. If you let the AI handle everything I'd argue that you'll lose some of that understanding and what the numbers behind a chart actually represents.